| Param | Original file | Final file |
|---|---|---|
| Filename | modeM0/AS1C05_007T01_9000003518cztM0_level2.fits | modeM0/AS1C05_007T01_9000003518cztM0_level2_quad_clean.evt |
| Size (bytes) | 451,362,240 | 419,610,240 |
| Size | 430.5 MB | 400.2 MB |
| Events in quadrant A | 2,877,922 | 2,570,386 |
| Events in quadrant B | 2,300,936 | 2,163,288 |
| Events in quadrant C | 2,822,105 | 2,481,938 |
| Events in quadrant D | 2,428,116 | 2,253,595 |
| Mode M9 | |||
|---|---|---|---|
| Quadrant | BADHDUFLAG | Total packets | Discarded packets |
| A | 0 | 54 | 0 |
| B | 0 | 56 | 0 |
| C | 0 | 56 | 0 |
| D | 0 | 54 | 0 |
| Mode SS | |||
|---|---|---|---|
| Quadrant | BADHDUFLAG | Total packets | Discarded packets |
| A | 0 | 992 | 0 |
| B | 0 | 994 | 0 |
| C | 0 | 1006 | 0 |
| D | 0 | 1000 | 0 |
| Mode M0 | |||
|---|---|---|---|
| Quadrant | BADHDUFLAG | Total packets | Discarded packets |
| A | 0 | 101042 | 0 |
| B | 0 | 92427 | 0 |
| C | 0 | 103972 | 0 |
| D | 0 | 139934 | 0 |
| Quadrant | Total seconds | Saturated seconds | Saturation percentage |
|---|---|---|---|
| A | 49091 | 668 | 1.360738% |
| B | 41182 | 1226 | 2.977029% |
| C | 49035 | 1124 | 2.292240% |
| D | 48887 | 1982 | 4.054248% |
Noise dominated data is calculated using 1-second bins in cleaned event files. If a bin has >2000 counts, and if more than 50% of those come from <1% of pixels, then it is considered to be noise-dominated and hence unusable.
| Quadrant | # 1 sec bins | Bins with >0 counts | Bins with >2000 counts | High rate bins dominated by noise | Noise dominated (total time) | Noise dominated (detector-on time) | Marked lightcurve |
|---|---|---|---|---|---|---|---|
| A | 56897 | 49983 | 0 | 0 | 0.00% | 0.00% | 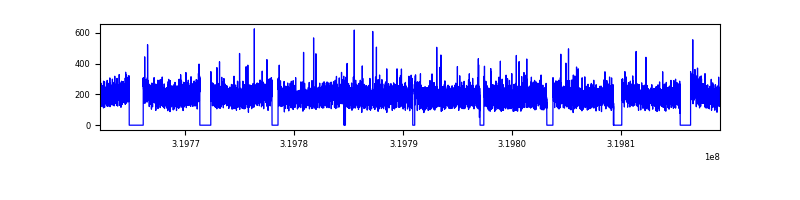 |
| B | 46322 | 41610 | 0 | 0 | 0.00% | 0.00% | 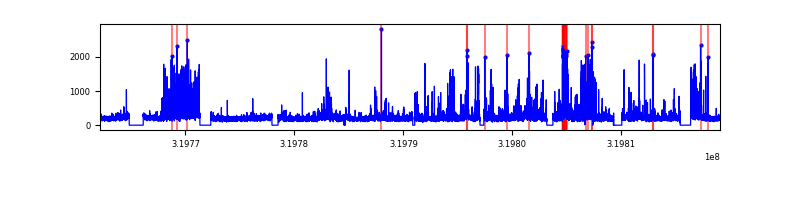 |
| C | 56897 | 49945 | 0 | 0 | 0.00% | 0.00% |  |
| D | 56897 | 49742 | 0 | 0 | 0.00% | 0.00% |  |
Top three noisy pixels from each quadrant. If the there are fewer than three noisy pixels in the level2.evt file, extra rows are filled as -1
| Pixel properties | Quadrant properties | ||||||
|---|---|---|---|---|---|---|---|
| Quadrant | DetID | PixID | Counts | Sigma | Mean | Median | Sigma |
| A | 0 | 29 | 2582 | 10.1 | 747 | 699 | 186.4 |
| A | 7 | 110 | 2307 | 8.63 | 747 | 699 | 186.4 |
| A | 9 | 19 | 2172 | 7.9 | 747 | 699 | 186.4 |
| B | 2 | 9 | 1904 | 10.96 | 607 | 577 | 121.1 |
| B | 5 | 232 | 1590 | 8.37 | 607 | 577 | 121.1 |
| B | 2 | 8 | 1573 | 8.23 | 607 | 577 | 121.1 |
| C | 12 | 241 | 1943 | 6.54 | 746 | 695 | 190.9 |
| C | 9 | 233 | 1921 | 6.42 | 746 | 695 | 190.9 |
| C | 3 | 126 | 1914 | 6.38 | 746 | 695 | 190.9 |
| D | 3 | 14 | 1744 | 5.98 | 692 | 630 | 186.1 |
| D | 7 | 3 | 1703 | 5.76 | 692 | 630 | 186.1 |
| D | 3 | 159 | 1678 | 5.63 | 692 | 630 | 186.1 |
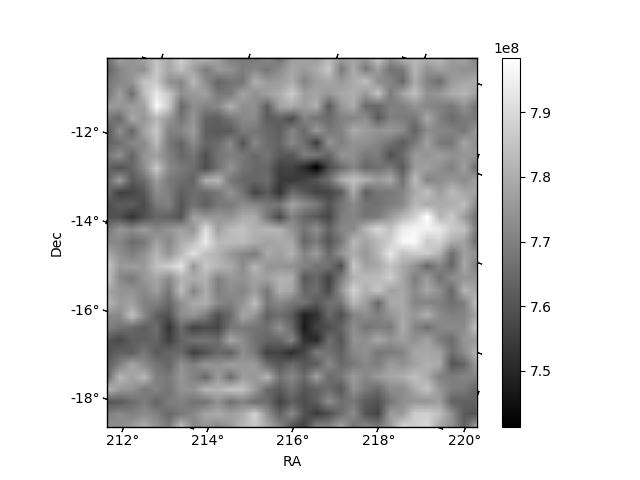
Histogram calculated using DETX and DETY for each event in the final _common_clean file
| Quadrant A | 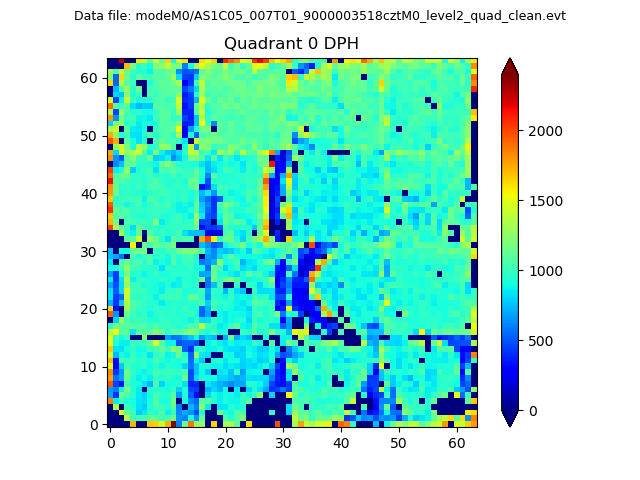 |
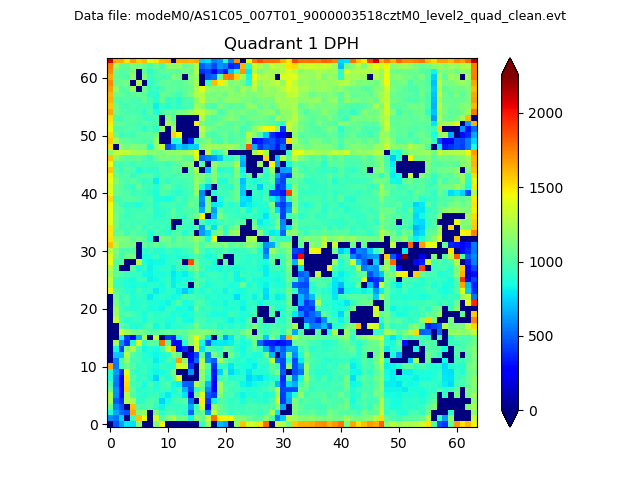 |
Quadrant B |
|---|---|---|---|
| Quadrant D | 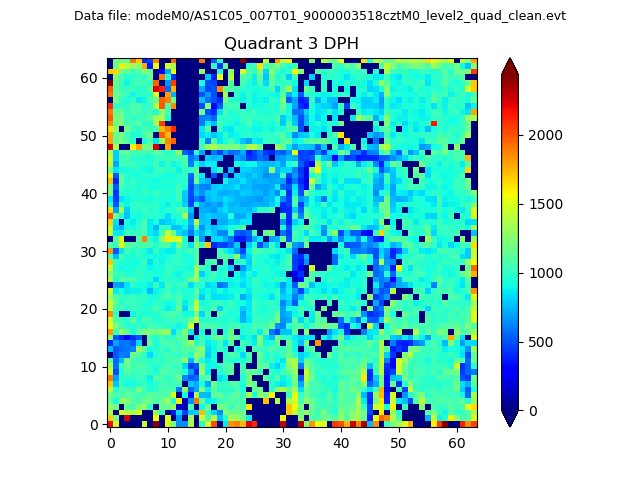 |
 |
Quadrant C |
| Plot type | Count rate plots | Images |
|---|---|---|
| Comparison with Poisson distribution Blue bars denote a histogram of data divided into 1 sec bins. Red curve is a Poisson curve with rate = median count rate of data. |
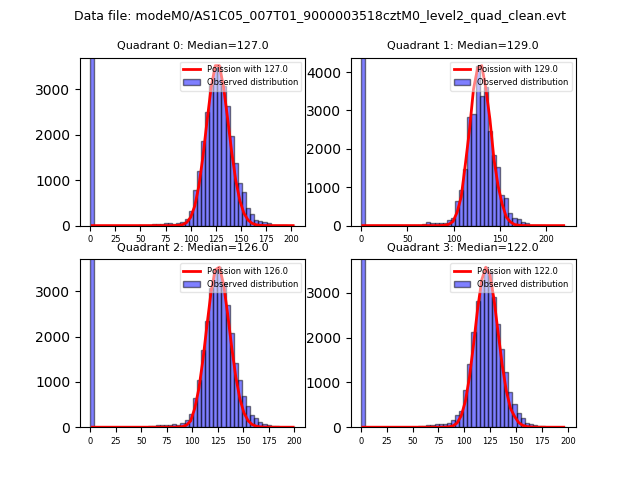 |
 |
| Quadrant-wise count rates Data is divided into 100 sec bins |
 |
|
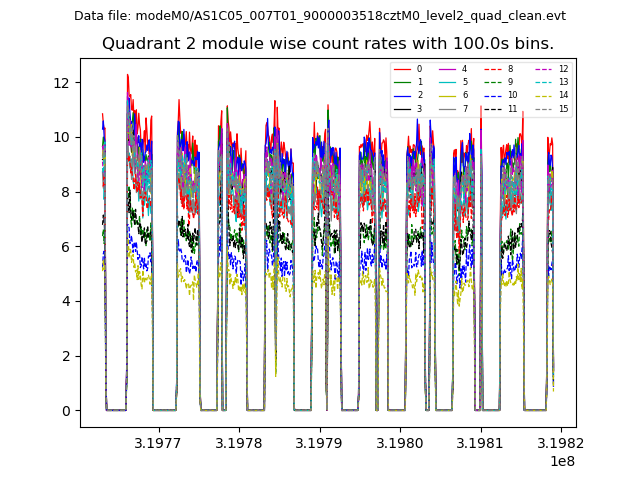
| Module-wise count rates for Quadrant A Data is divided into 100 sec bins |
 |
 |
| Module-wise count rates for Quadrant B Data is divided into 100 sec bins |
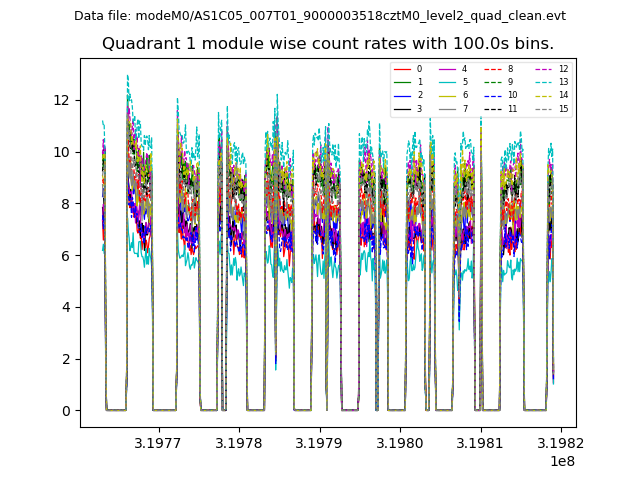 |
 |
| Module-wise count rates for Quadrant C Data is divided into 100 sec bins |
 |
 |
| Module-wise count rates for Quadrant D Data is divided into 100 sec bins |
 |
 |
| Parameter | Plot |
|---|---|
| CZT HV Monitor | 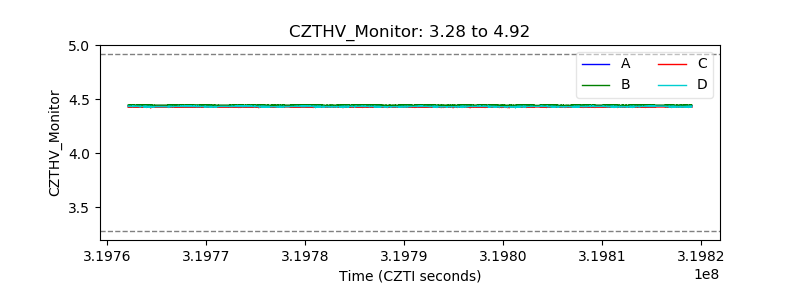 |
| D_VDD | 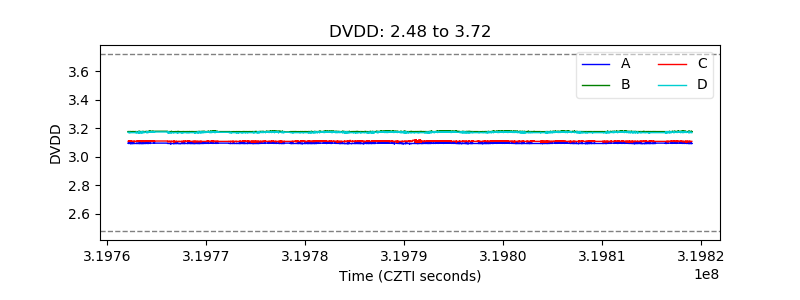 |
| Temperature 1 |  |
| Veto HV Monitor |  |
| Veto LLD |  |
| Alpha Counter |  |
| _CPM_Rate | 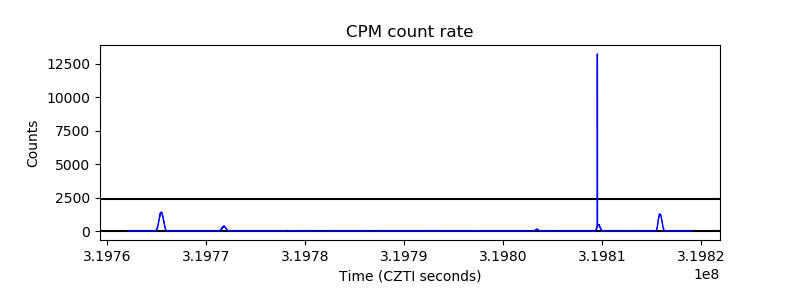 |
| CZT Counter |  |
| +2.5 Volts monitor |  |
| +5 Volts monitor |  |
| _ROLL_ROT |  |
| _Roll_DEC | 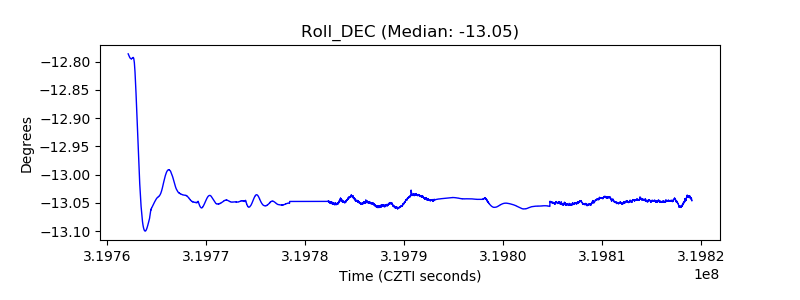 |
| _Roll_RA |  |
| Veto Counter |  |