| Param | Original file | Final file |
|---|---|---|
| Filename | modeM0/AS1C05_007T01_9000003518_23754cztM0_level2.evt | modeM0/AS1C05_007T01_9000003518_23754cztM0_level2_quad_clean.evt |
| Size (bytes) | 298,958,400 | 53,956,800 |
| Size | 285.1 MB | 51.5 MB |
| Events in quadrant A | 1,960,560 | 338,372 |
| Events in quadrant B | 2,028,905 | 353,895 |
| Events in quadrant C | 2,036,806 | 341,521 |
| Events in quadrant D | 2,759,667 | 322,423 |
| Mode M9 | |||
|---|---|---|---|
| Quadrant | BADHDUFLAG | Total packets | Discarded packets |
| A | 0 | 13 | 0 |
| B | 0 | 13 | 0 |
| C | 0 | 13 | 0 |
| D | 0 | 13 | 0 |
| Mode SS | |||
|---|---|---|---|
| Quadrant | BADHDUFLAG | Total packets | Discarded packets |
| A | 0 | 80 | 0 |
| B | 0 | 80 | 0 |
| C | 0 | 80 | 0 |
| D | 0 | 80 | 0 |
| Mode M0 | |||
|---|---|---|---|
| Quadrant | BADHDUFLAG | Total packets | Discarded packets |
| A | 0 | 8288 | 1 |
| B | 0 | 8408 | 1 |
| C | 0 | 8373 | 1 |
| D | 0 | 10918 | 1 |
| Quadrant | Total seconds | Saturated seconds | Saturation percentage |
|---|---|---|---|
| A | 3930 | 48 | 1.221374% |
| B | 3930 | 79 | 2.010178% |
| C | 3930 | 79 | 2.010178% |
| D | 3930 | 99 | 2.519084% |
Noise dominated data is calculated using 1-second bins in cleaned event files. If a bin has >2000 counts, and if more than 50% of those come from <1% of pixels, then it is considered to be noise-dominated and hence unusable.
| Quadrant | # 1 sec bins | Bins with >0 counts | Bins with >2000 counts | High rate bins dominated by noise | Noise dominated (total time) | Noise dominated (detector-on time) | Marked lightcurve |
|---|---|---|---|---|---|---|---|
| A | 5220 | 3931 | 0 | 0 | 0.00% | 0.00% | 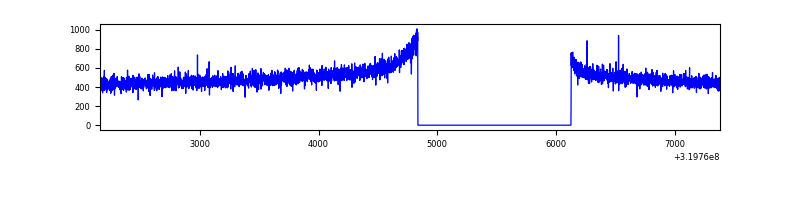 |
| B | 5220 | 3930 | 0 | 0 | 0.00% | 0.00% | 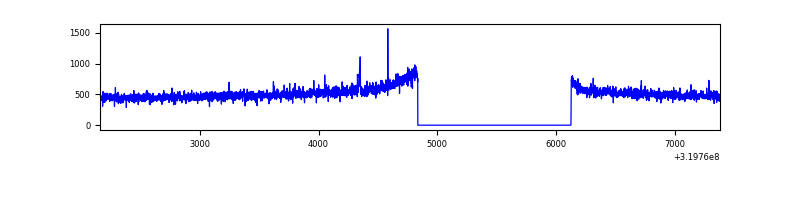 |
| C | 5220 | 3931 | 1 | 1 | 0.02% | 0.03% | 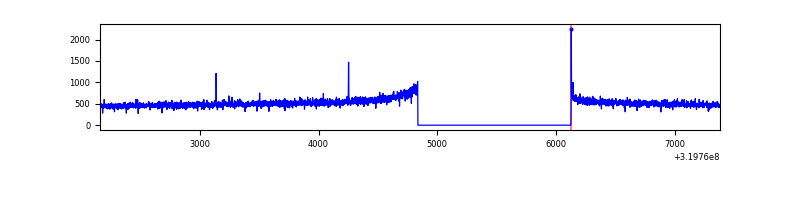 |
| D | 5220 | 3931 | 53 | 53 | 1.02% | 1.35% | 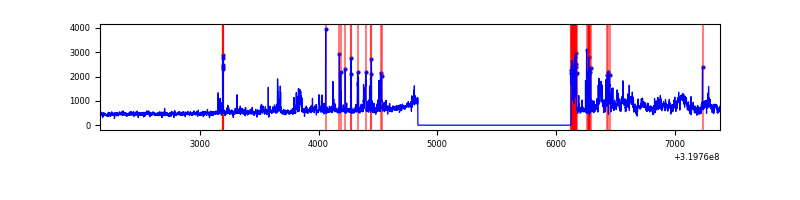 |
Top three noisy pixels from each quadrant. If the there are fewer than three noisy pixels in the level2.evt file, extra rows are filled as -1
| Pixel properties | Quadrant properties | ||||||
|---|---|---|---|---|---|---|---|
| Quadrant | DetID | PixID | Counts | Sigma | Mean | Median | Sigma |
| A | 13 | 254 | 6531 | 57.81 | 508 | 497 | 104.4 |
| A | 0 | 226 | 4441 | 37.78 | 508 | 497 | 104.4 |
| A | 3 | 137 | 4297 | 36.4 | 508 | 497 | 104.4 |
| B | 12 | 111 | 11450 | 111.76 | 512 | 499 | 98.0 |
| B | 11 | 111 | 10358 | 100.62 | 512 | 499 | 98.0 |
| B | 0 | 189 | 9941 | 96.36 | 512 | 499 | 98.0 |
| C | 14 | 238 | 78254 | 662.6 | 499 | 501 | 117.3 |
| C | 7 | 247 | 10113 | 81.91 | 499 | 501 | 117.3 |
| C | 13 | 61 | 3361 | 24.37 | 499 | 501 | 117.3 |
| D | 1 | 52 | 606674 | 4961.18 | 498 | 483 | 122.2 |
| D | 8 | 195 | 240178 | 1961.71 | 498 | 483 | 122.2 |
| D | 2 | 234 | 15712 | 124.64 | 498 | 483 | 122.2 |
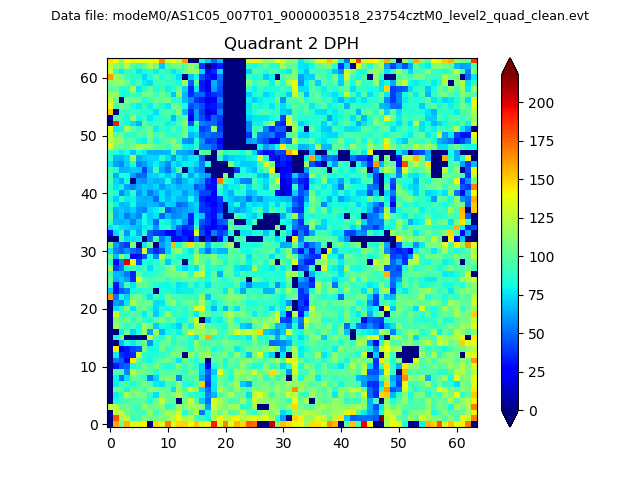
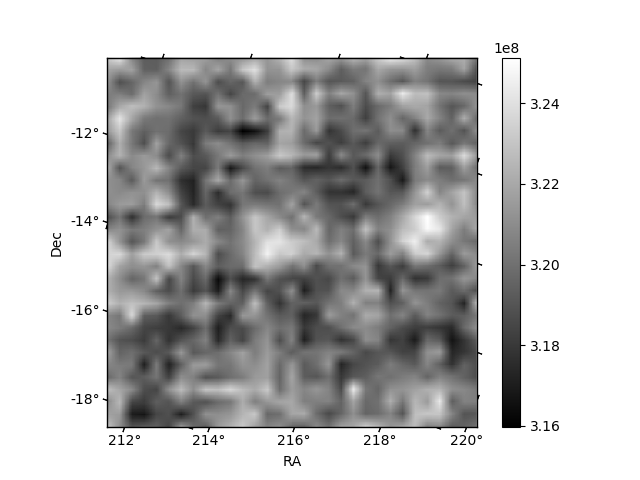
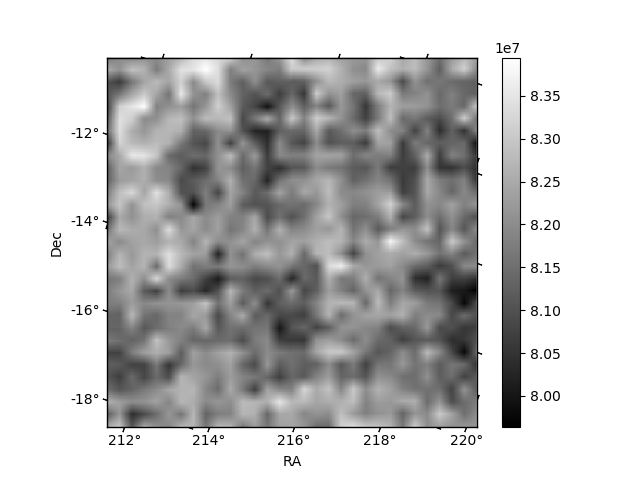
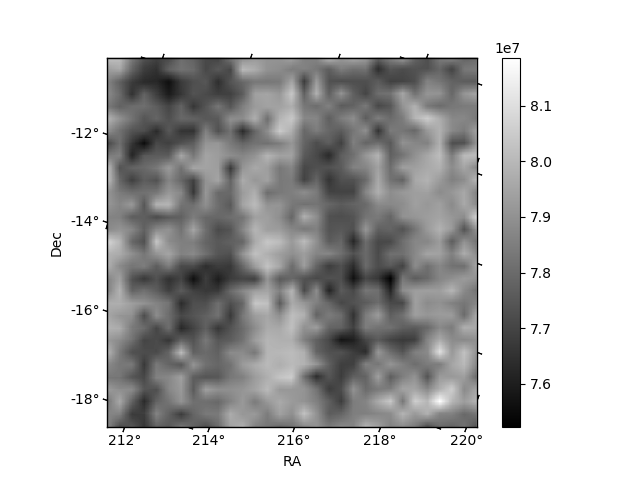
Histogram calculated using DETX and DETY for each event in the final _common_clean file
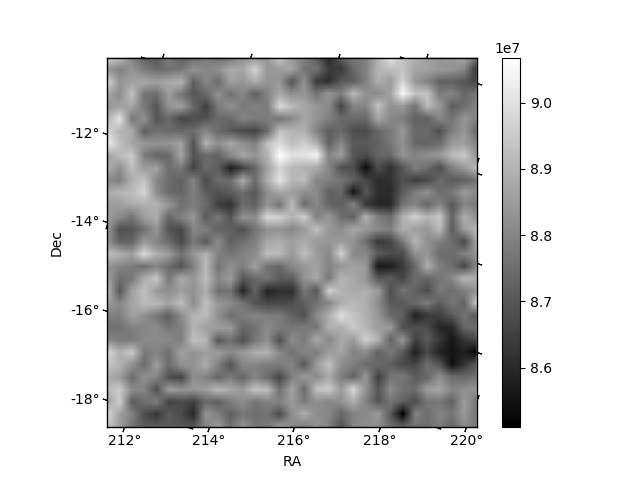
| Quadrant A | 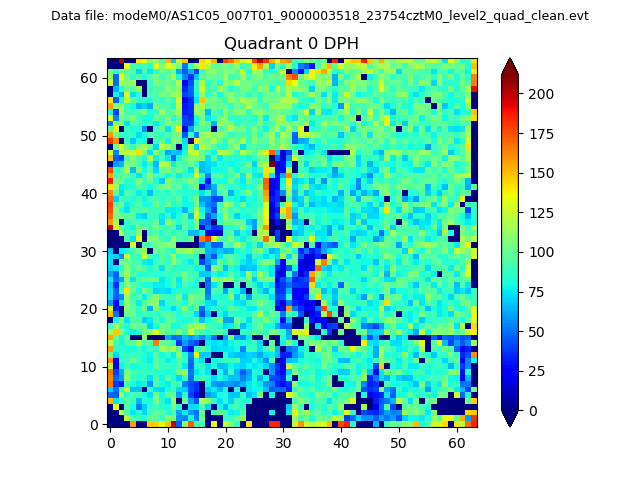 |
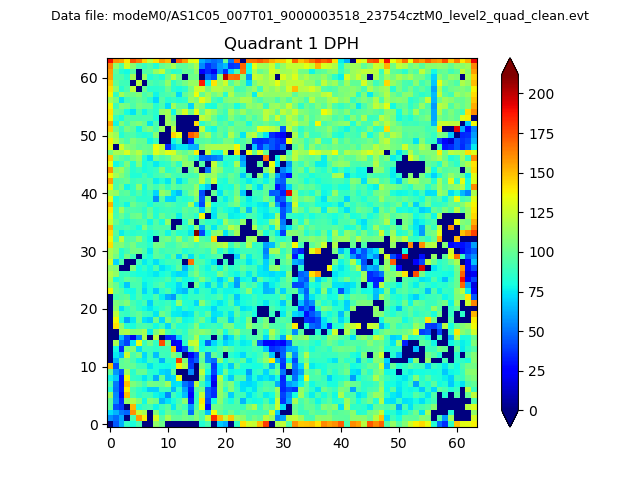 |
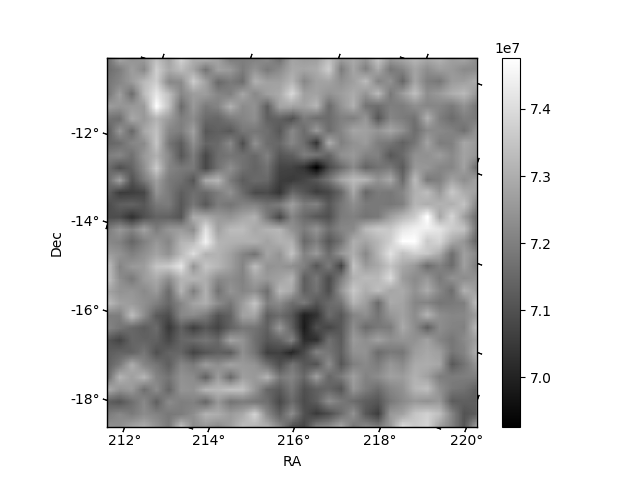
Quadrant B |
|---|---|---|---|
| Quadrant D | 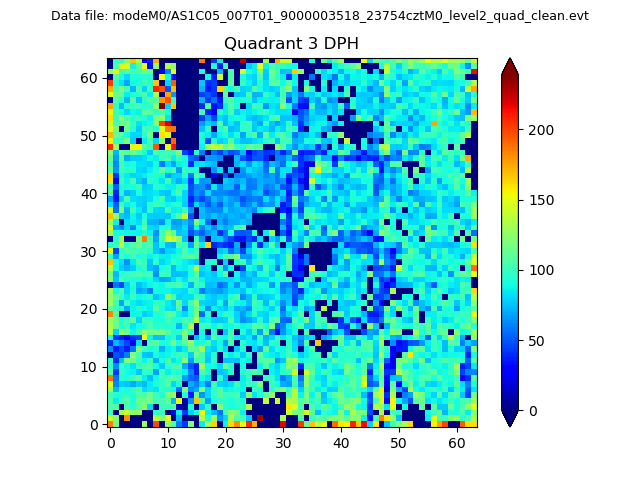 |
 |
Quadrant C |
| Plot type | Count rate plots | Images |
|---|---|---|
| Comparison with Poisson distribution Blue bars denote a histogram of data divided into 1 sec bins. Red curve is a Poisson curve with rate = median count rate of data. |
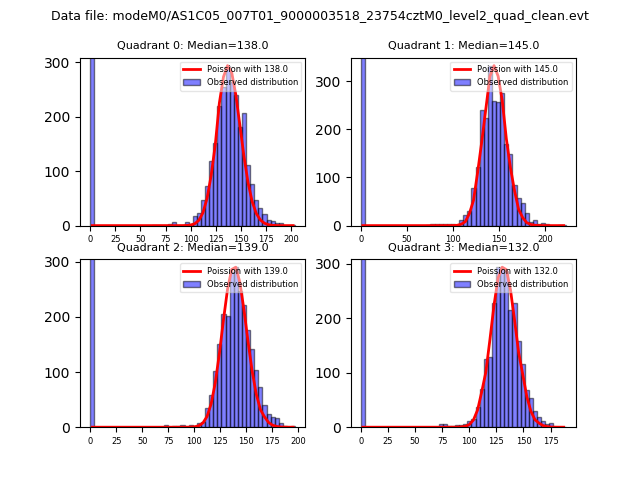 |
 |
| Quadrant-wise count rates Data is divided into 100 sec bins |
 |
|
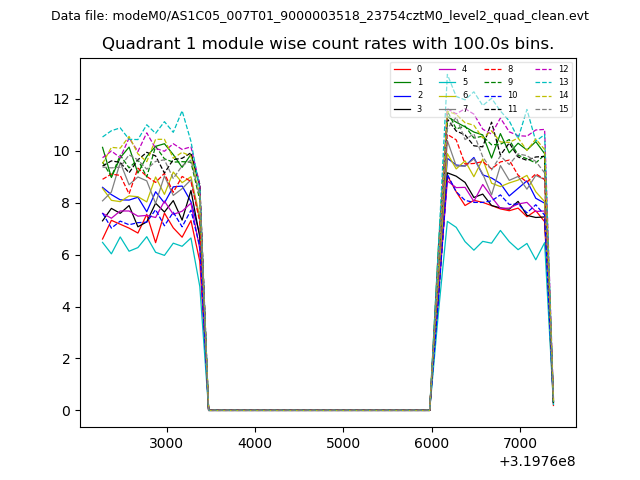
| Module-wise count rates for Quadrant A Data is divided into 100 sec bins |
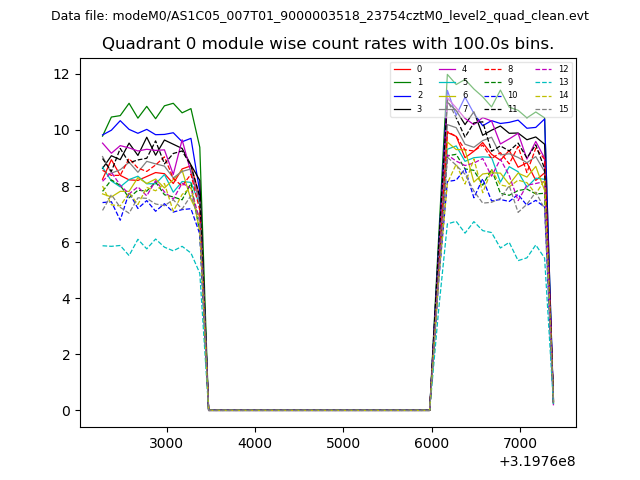 |
 |
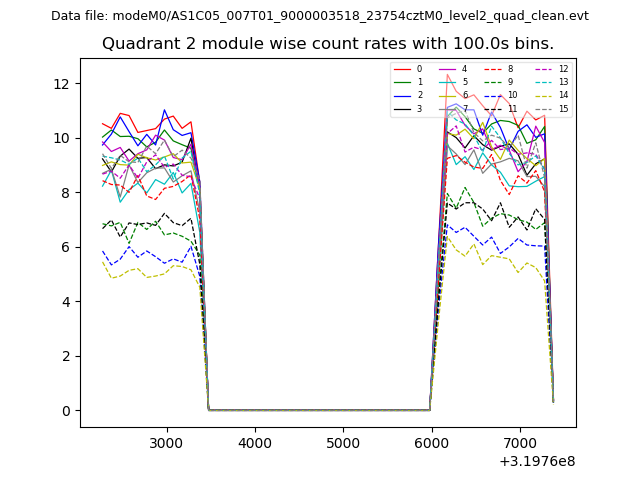
| Module-wise count rates for Quadrant B Data is divided into 100 sec bins |
 |
 |
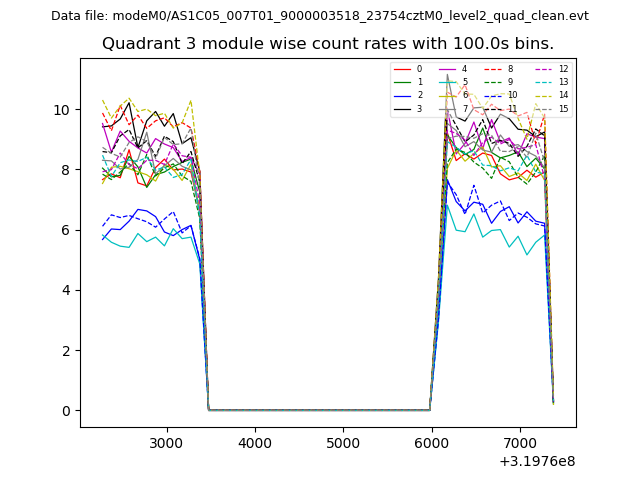
| Module-wise count rates for Quadrant C Data is divided into 100 sec bins |
 |
 |
| Module-wise count rates for Quadrant D Data is divided into 100 sec bins |
 |
 |
| Parameter | Plot |
|---|---|
| CZT HV Monitor | 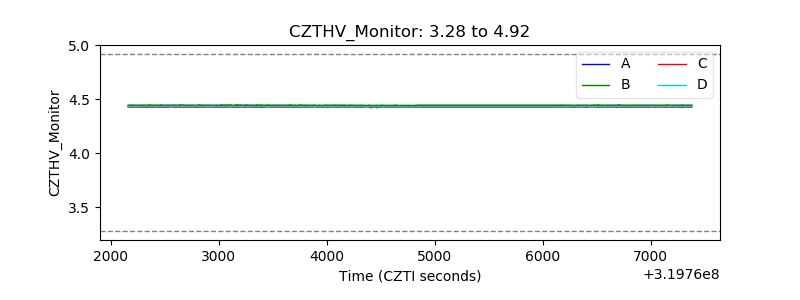 |
| D_VDD | 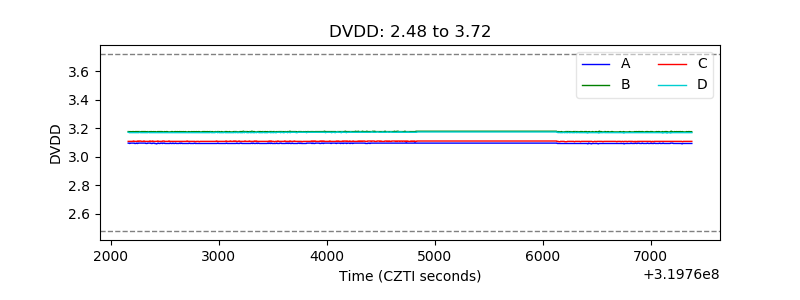 |
| Temperature 1 | 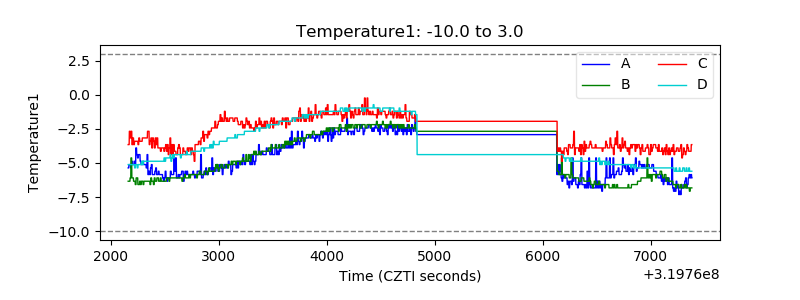 |
| Veto HV Monitor | 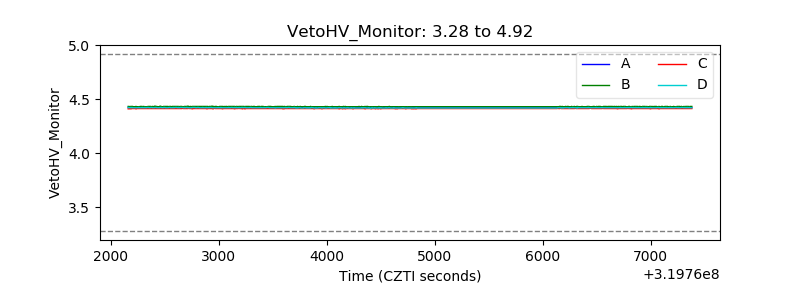 |
| Veto LLD | 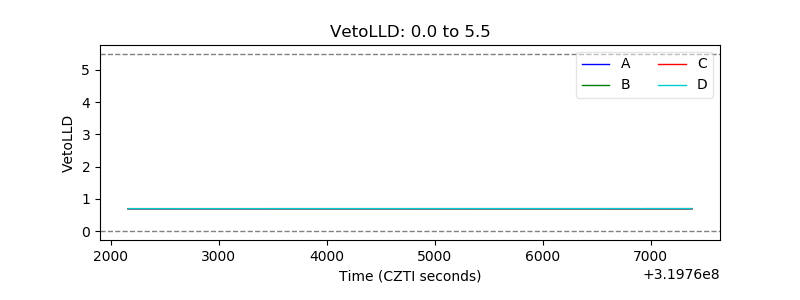 |
| Alpha Counter | 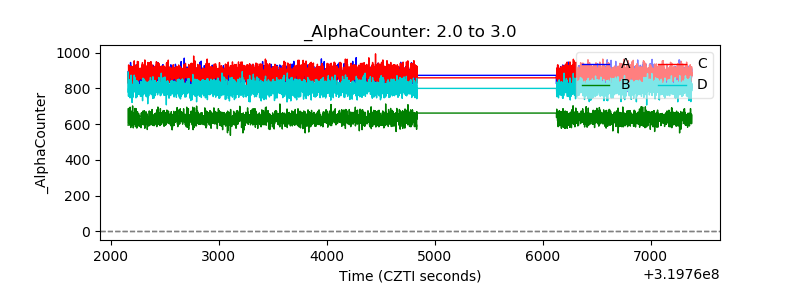 |
| _CPM_Rate |  |
| CZT Counter | 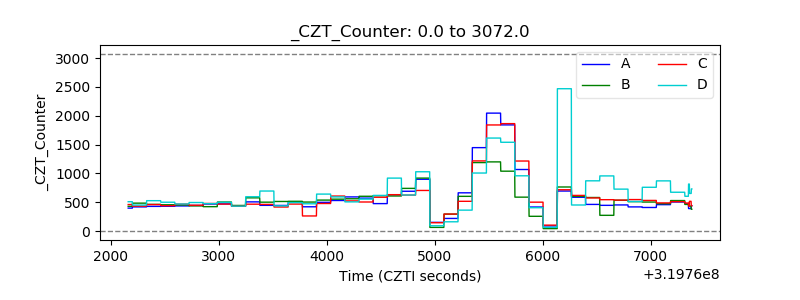 |
| +2.5 Volts monitor |  |
| +5 Volts monitor | 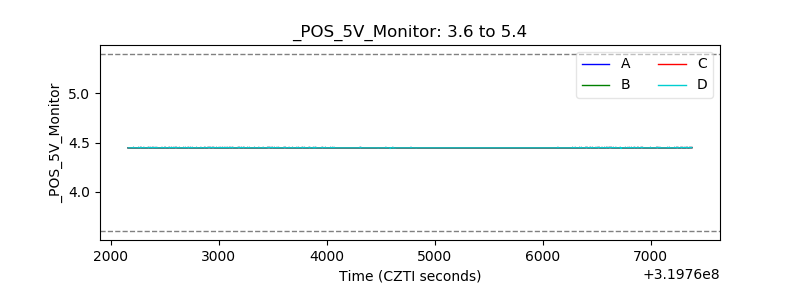 |
| _ROLL_ROT | 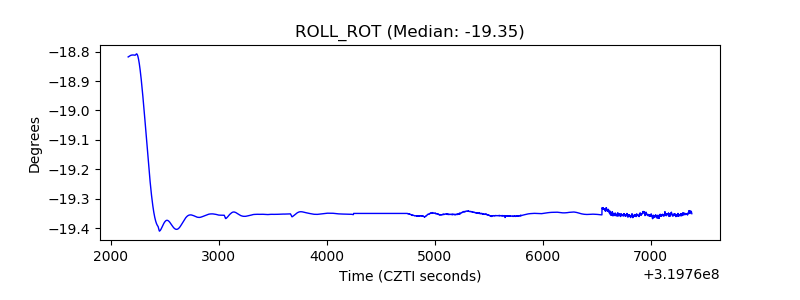 |
| _Roll_DEC | 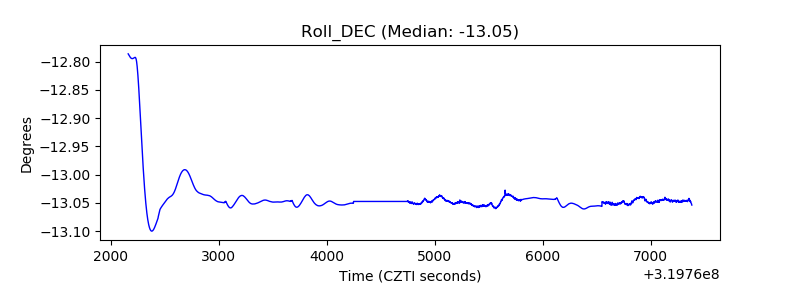 |
| _Roll_RA | 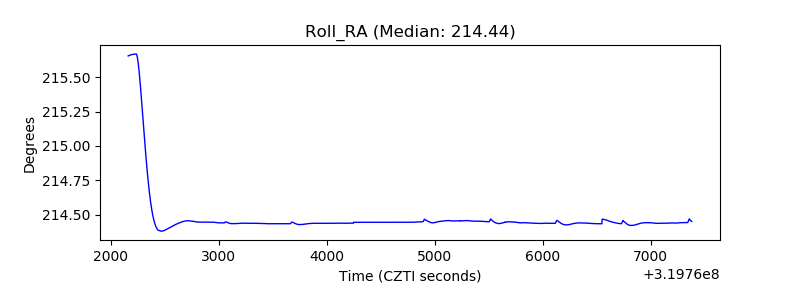 |
| Veto Counter | 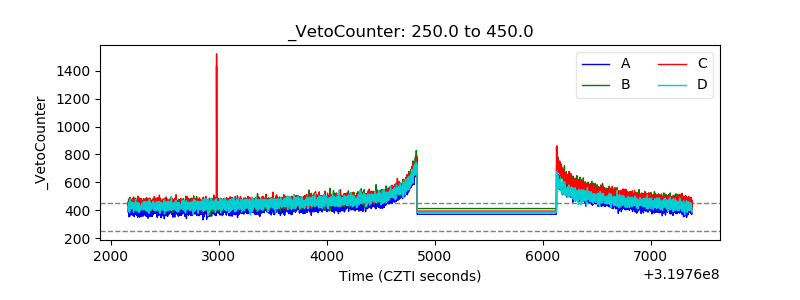 |