| Param | Original file | Final file |
|---|---|---|
| Filename | modeM0/AS1C05_007T01_9000003518_23755cztM0_level2.evt | modeM0/AS1C05_007T01_9000003518_23755cztM0_level2_quad_clean.evt |
| Size (bytes) | 590,011,200 | 101,600,640 |
| Size | 562.7 MB | 96.9 MB |
| Events in quadrant A | 3,307,087 | 653,760 |
| Events in quadrant B | 4,325,039 | 673,658 |
| Events in quadrant C | 3,582,434 | 652,557 |
| Events in quadrant D | 6,185,249 | 614,745 |
| Mode M9 | |||
|---|---|---|---|
| Quadrant | BADHDUFLAG | Total packets | Discarded packets |
| A | 0 | 16 | 0 |
| B | 0 | 17 | 0 |
| C | 0 | 17 | 0 |
| D | 0 | 17 | 0 |
| Mode SS | |||
|---|---|---|---|
| Quadrant | BADHDUFLAG | Total packets | Discarded packets |
| A | 0 | 140 | 0 |
| B | 0 | 140 | 0 |
| C | 0 | 140 | 0 |
| D | 0 | 140 | 0 |
| Mode M0 | |||
|---|---|---|---|
| Quadrant | BADHDUFLAG | Total packets | Discarded packets |
| A | 0 | 14363 | 2 |
| B | 0 | 17324 | 2 |
| C | 0 | 14770 | 2 |
| D | 0 | 23289 | 2 |
| Quadrant | Total seconds | Saturated seconds | Saturation percentage |
|---|---|---|---|
| A | 6926 | 51 | 0.736356% |
| B | 6925 | 307 | 4.433213% |
| C | 6925 | 116 | 1.675090% |
| D | 6925 | 221 | 3.191336% |
Noise dominated data is calculated using 1-second bins in cleaned event files. If a bin has >2000 counts, and if more than 50% of those come from <1% of pixels, then it is considered to be noise-dominated and hence unusable.
| Quadrant | # 1 sec bins | Bins with >0 counts | Bins with >2000 counts | High rate bins dominated by noise | Noise dominated (total time) | Noise dominated (detector-on time) | Marked lightcurve |
|---|---|---|---|---|---|---|---|
| A | 7931 | 6926 | 0 | 0 | 0.00% | 0.00% | 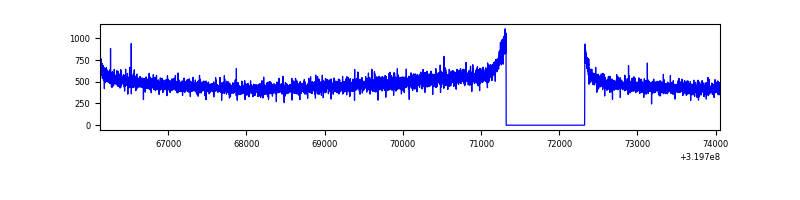 |
| B | 7930 | 6925 | 107 | 107 | 1.35% | 1.55% | 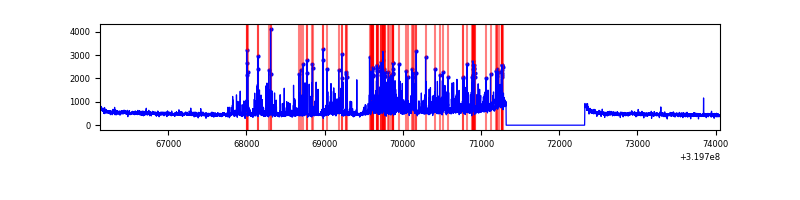 |
| C | 7930 | 6925 | 8 | 8 | 0.10% | 0.12% | 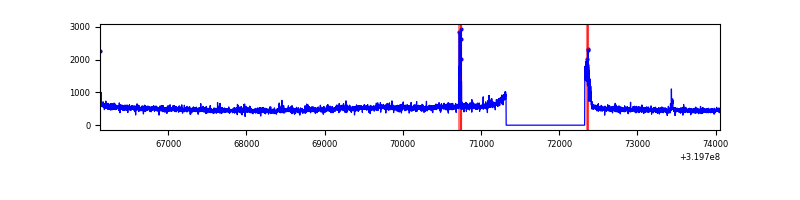 |
| D | 7930 | 6926 | 260 | 260 | 3.28% | 3.75% | 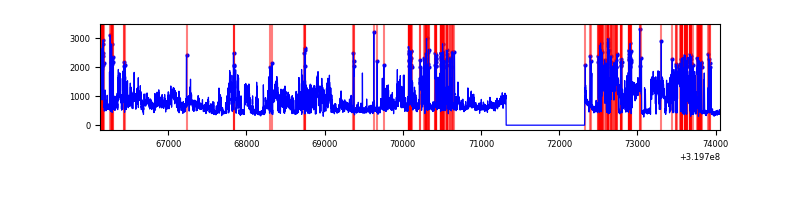 |
Top three noisy pixels from each quadrant. If the there are fewer than three noisy pixels in the level2.evt file, extra rows are filled as -1
| Pixel properties | Quadrant properties | ||||||
|---|---|---|---|---|---|---|---|
| Quadrant | DetID | PixID | Counts | Sigma | Mean | Median | Sigma |
| A | 13 | 254 | 11270 | 60.12 | 858 | 840 | 173.5 |
| A | 3 | 137 | 7429 | 37.98 | 858 | 840 | 173.5 |
| A | 0 | 226 | 7361 | 37.59 | 858 | 840 | 173.5 |
| B | 3 | 64 | 895764 | 5567.78 | 853 | 832 | 160.7 |
| B | 0 | 189 | 52441 | 321.08 | 853 | 832 | 160.7 |
| B | 12 | 111 | 19691 | 117.33 | 853 | 832 | 160.7 |
| C | 14 | 238 | 129575 | 655.27 | 836 | 844 | 196.5 |
| C | 0 | 10 | 78061 | 393.05 | 836 | 844 | 196.5 |
| C | 10 | 91 | 72742 | 365.98 | 836 | 844 | 196.5 |
| D | 1 | 52 | 2551211 | 12629.75 | 831 | 807 | 201.9 |
| D | 8 | 195 | 493957 | 2442.11 | 831 | 807 | 201.9 |
| D | 2 | 234 | 26797 | 128.7 | 831 | 807 | 201.9 |
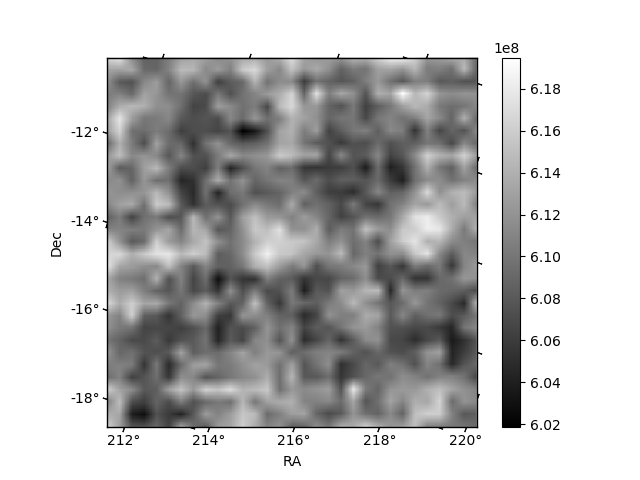
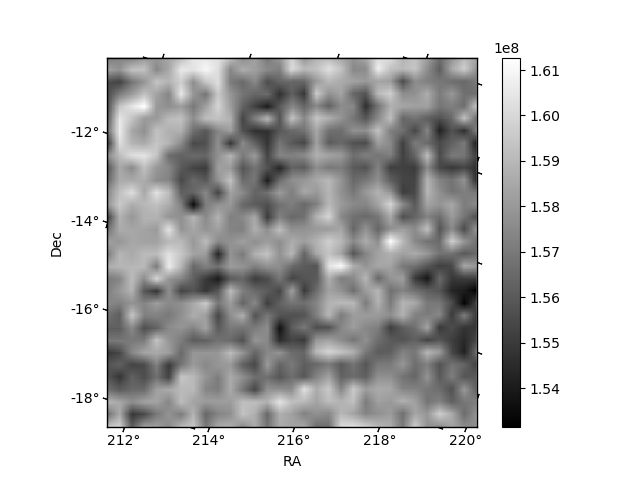
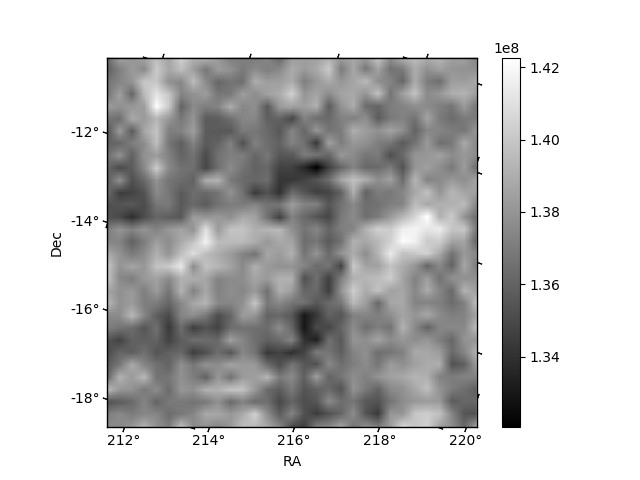
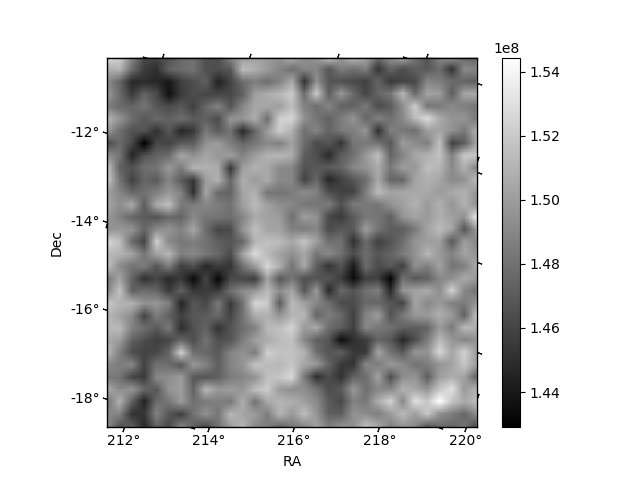
Histogram calculated using DETX and DETY for each event in the final _common_clean file
| Quadrant A | 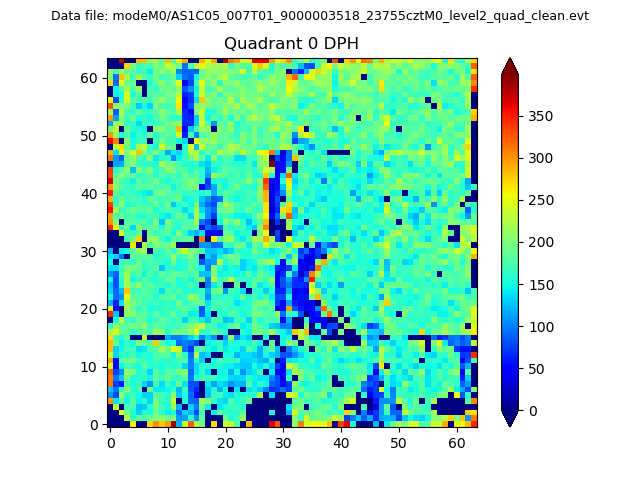 |
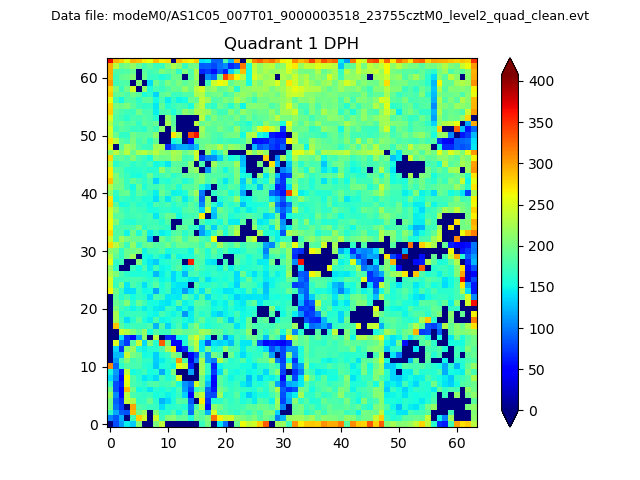 |
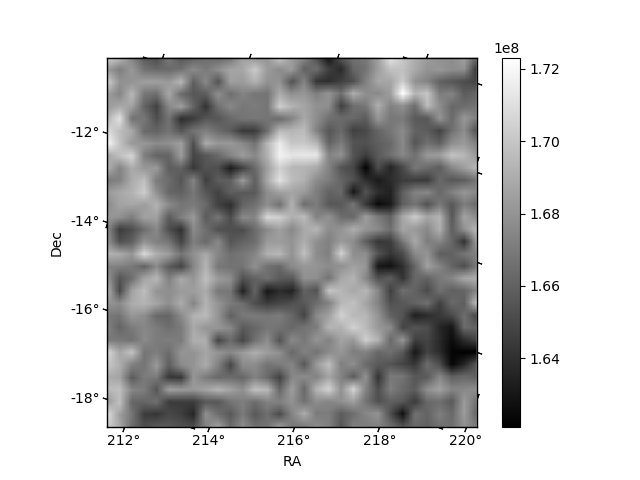
Quadrant B |
|---|---|---|---|
| Quadrant D | 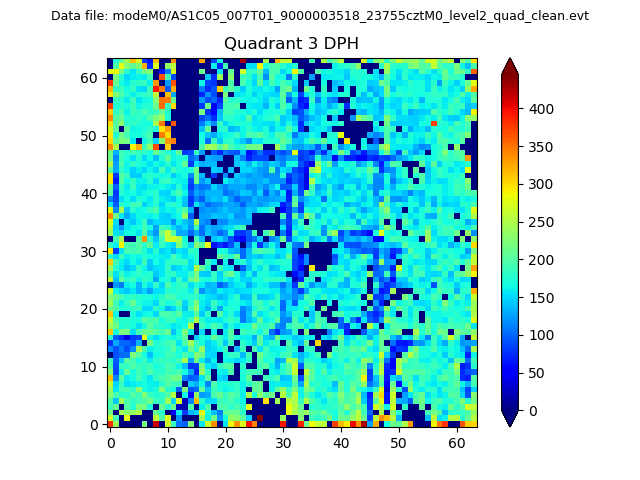 |
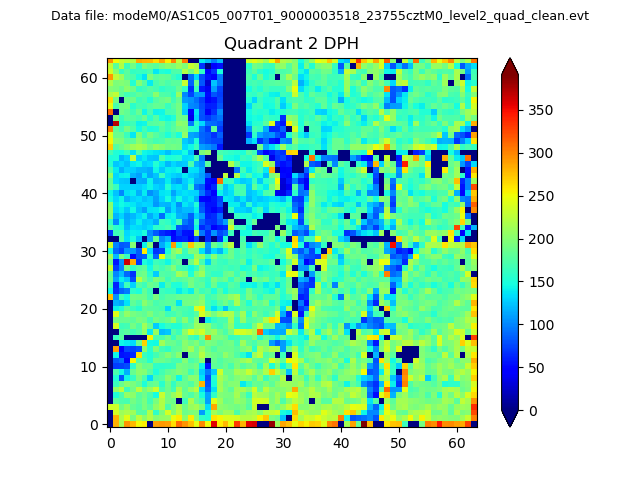 |
Quadrant C |
| Plot type | Count rate plots | Images |
|---|---|---|
| Comparison with Poisson distribution Blue bars denote a histogram of data divided into 1 sec bins. Red curve is a Poisson curve with rate = median count rate of data. |
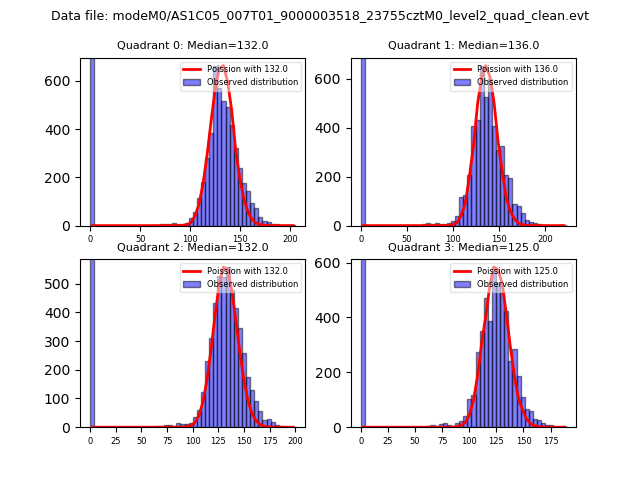 |
 |
| Quadrant-wise count rates Data is divided into 100 sec bins |
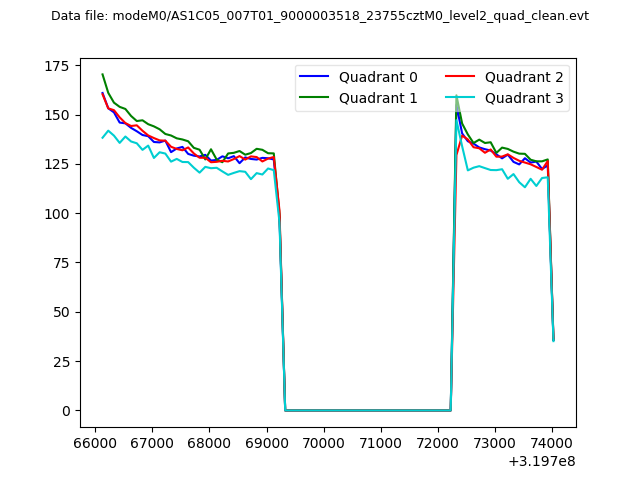 |
|
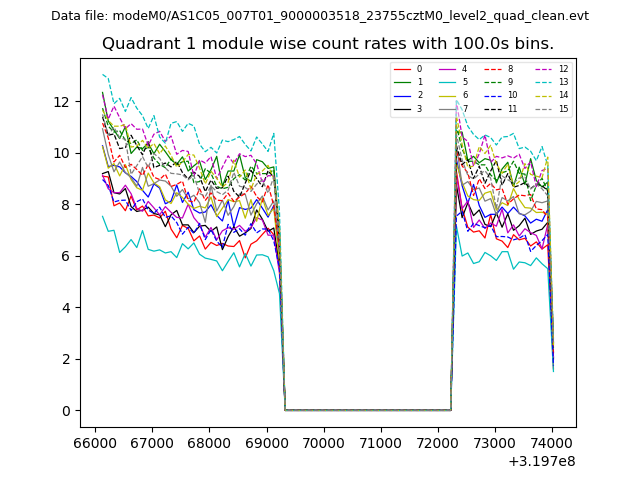
| Module-wise count rates for Quadrant A Data is divided into 100 sec bins |
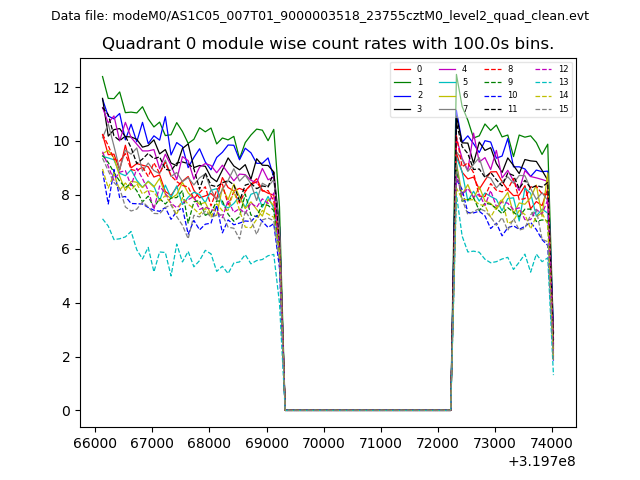 |
 |
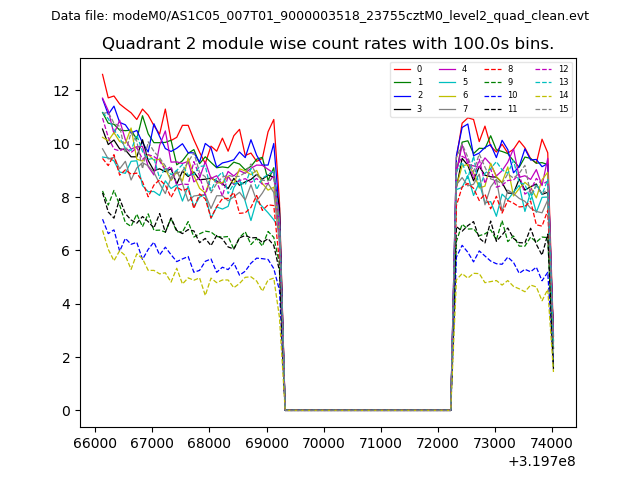
| Module-wise count rates for Quadrant B Data is divided into 100 sec bins |
 |
 |
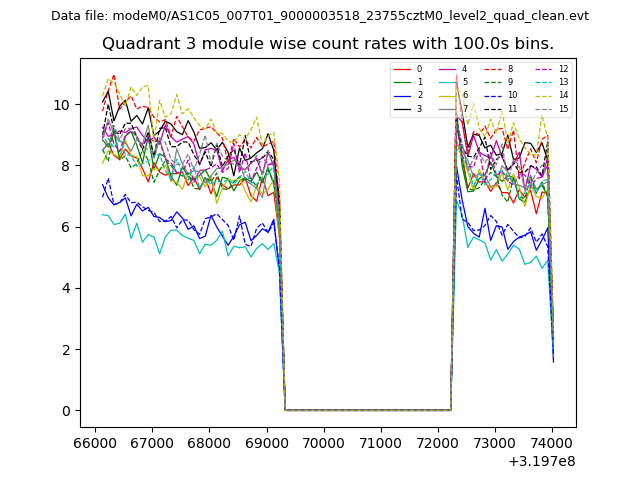
| Module-wise count rates for Quadrant C Data is divided into 100 sec bins |
 |
 |
| Module-wise count rates for Quadrant D Data is divided into 100 sec bins |
 |
 |
| Parameter | Plot |
|---|---|
| CZT HV Monitor | 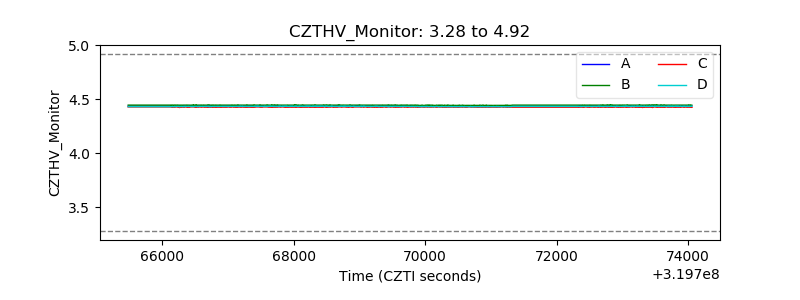 |
| D_VDD | 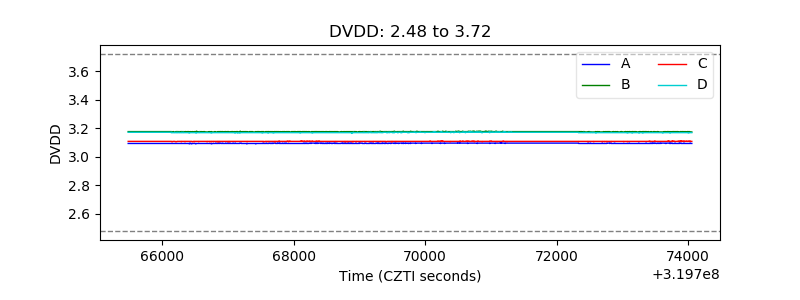 |
| Temperature 1 | 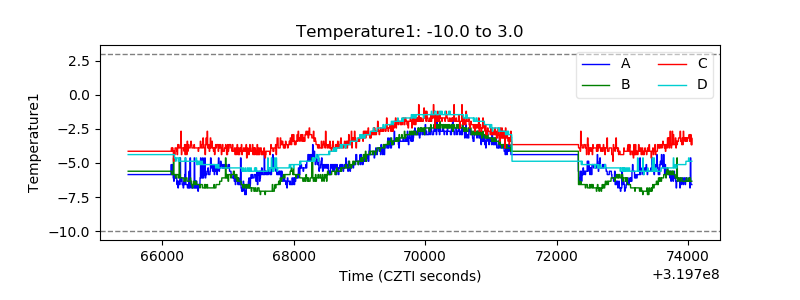 |
| Veto HV Monitor | 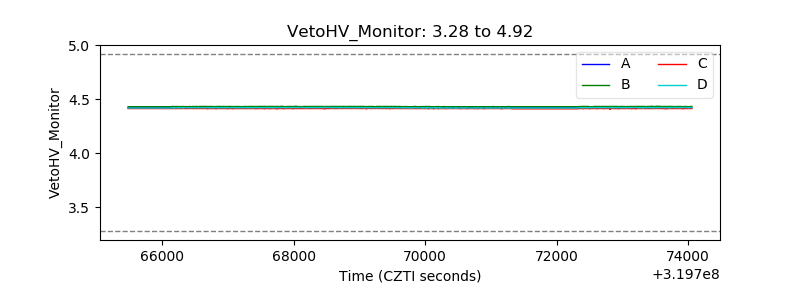 |
| Veto LLD | 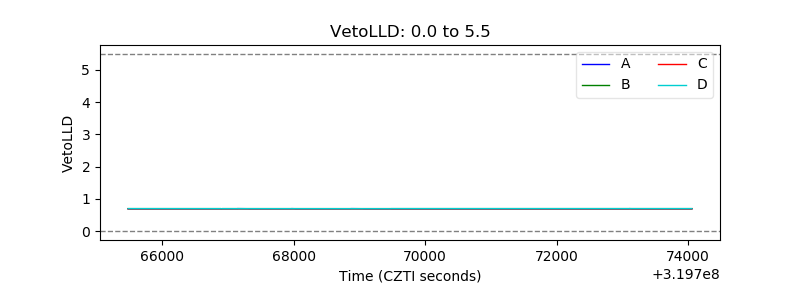 |
| Alpha Counter | 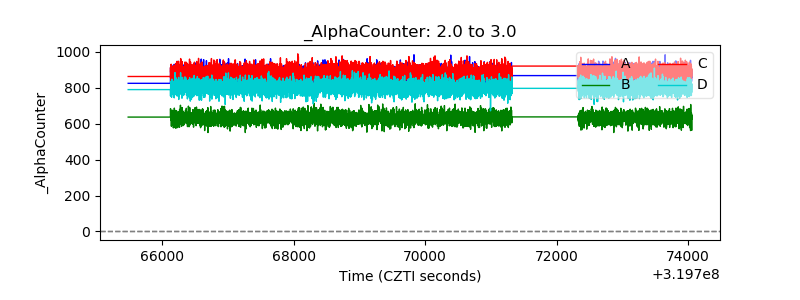 |
| _CPM_Rate | 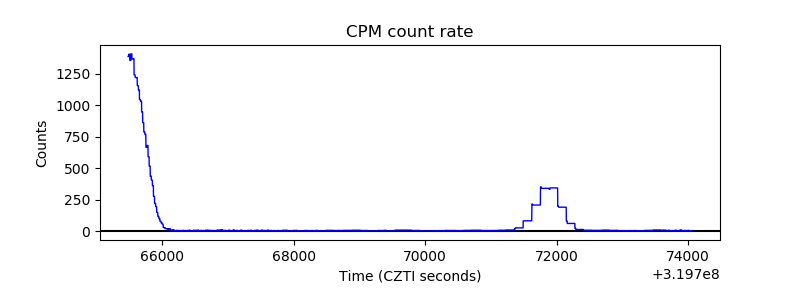 |
| CZT Counter | 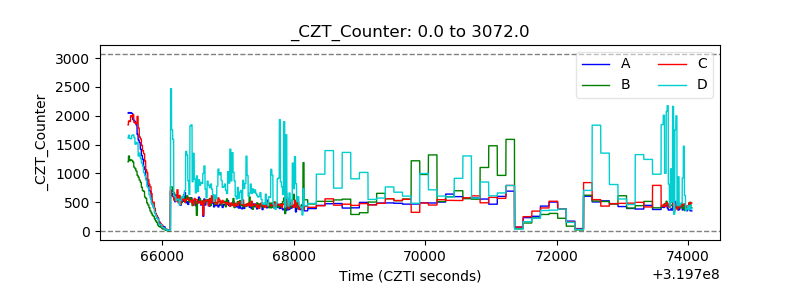 |
| +2.5 Volts monitor |  |
| +5 Volts monitor |  |
| _ROLL_ROT | 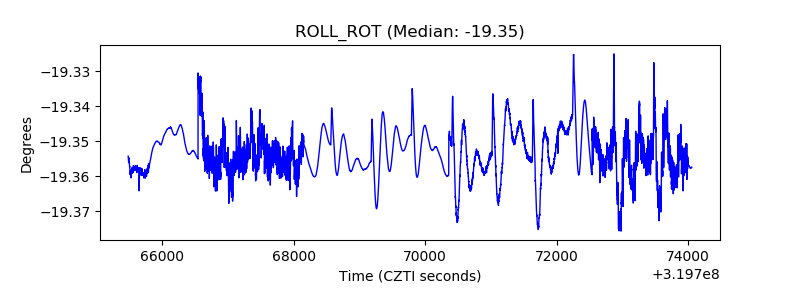 |
| _Roll_DEC | 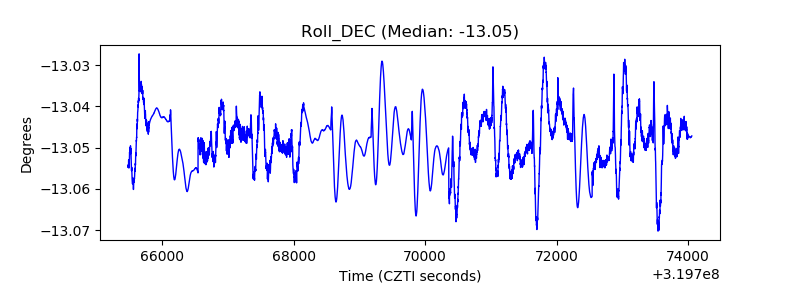 |
| _Roll_RA | 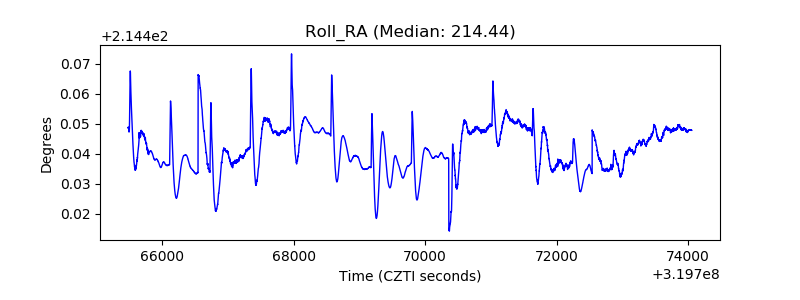 |
| Veto Counter | 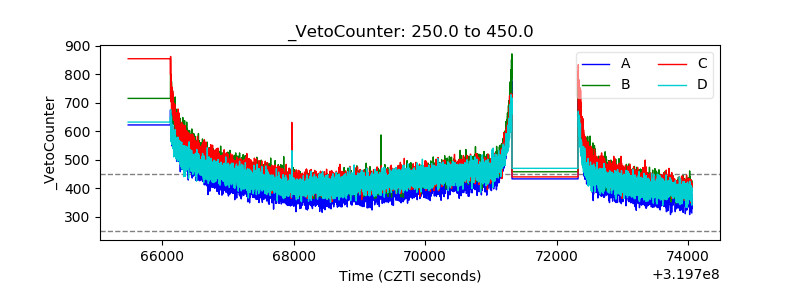 |