| Param | Original file | Final file |
|---|---|---|
| Filename | modeM0/AS1C05_007T01_9000003518_23756cztM0_level2.evt | modeM0/AS1C05_007T01_9000003518_23756cztM0_level2_quad_clean.evt |
| Size (bytes) | 617,238,720 | 102,568,320 |
| Size | 588.6 MB | 97.8 MB |
| Events in quadrant A | 3,469,743 | 655,522 |
| Events in quadrant B | 3,591,613 | 673,359 |
| Events in quadrant C | 3,821,832 | 650,766 |
| Events in quadrant D | 7,311,851 | 614,543 |
| Mode M9 | |||
|---|---|---|---|
| Quadrant | BADHDUFLAG | Total packets | Discarded packets |
| A | 0 | 14 | 0 |
| B | 0 | 15 | 0 |
| C | 0 | 15 | 0 |
| D | 0 | 15 | 0 |
| Mode SS | |||
|---|---|---|---|
| Quadrant | BADHDUFLAG | Total packets | Discarded packets |
| A | 0 | 148 | 0 |
| B | 0 | 148 | 0 |
| C | 0 | 148 | 0 |
| D | 0 | 148 | 0 |
| Mode M0 | |||
|---|---|---|---|
| Quadrant | BADHDUFLAG | Total packets | Discarded packets |
| A | 0 | 15157 | 2 |
| B | 0 | 15319 | 2 |
| C | 0 | 15910 | 2 |
| D | 0 | 26599 | 2 |
| Quadrant | Total seconds | Saturated seconds | Saturation percentage |
|---|---|---|---|
| A | 7359 | 62 | 0.842506% |
| B | 7359 | 89 | 1.209403% |
| C | 7359 | 162 | 2.201386% |
| D | 7359 | 731 | 9.933415% |
Noise dominated data is calculated using 1-second bins in cleaned event files. If a bin has >2000 counts, and if more than 50% of those come from <1% of pixels, then it is considered to be noise-dominated and hence unusable.
| Quadrant | # 1 sec bins | Bins with >0 counts | Bins with >2000 counts | High rate bins dominated by noise | Noise dominated (total time) | Noise dominated (detector-on time) | Marked lightcurve |
|---|---|---|---|---|---|---|---|
| A | 7919 | 7360 | 0 | 0 | 0.00% | 0.00% | 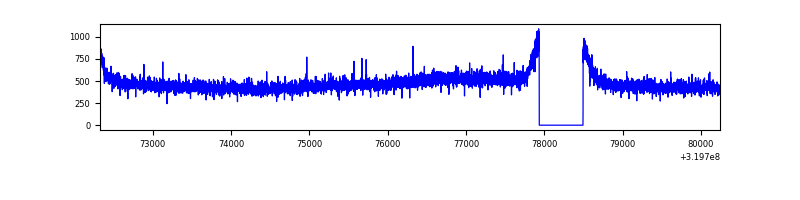 |
| B | 7919 | 7360 | 0 | 0 | 0.00% | 0.00% | 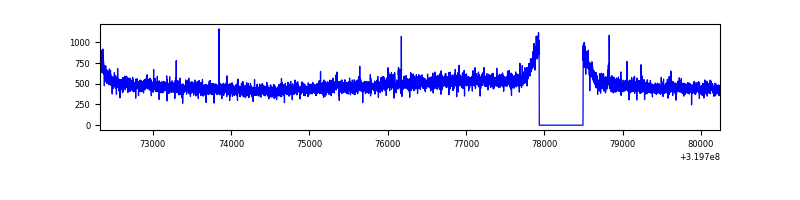 |
| C | 7919 | 7359 | 7 | 7 | 0.09% | 0.10% | 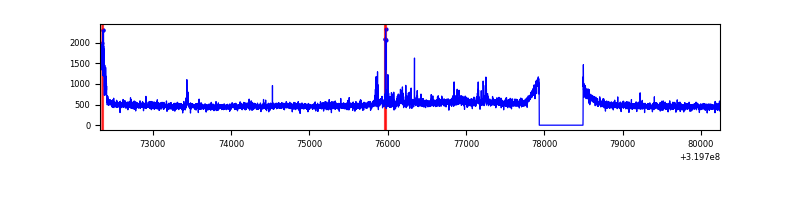 |
| D | 7919 | 7360 | 742 | 742 | 9.37% | 10.08% | 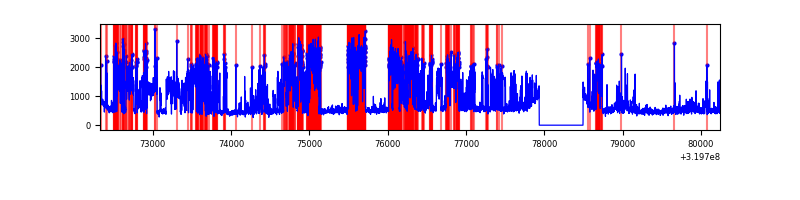 |
Top three noisy pixels from each quadrant. If the there are fewer than three noisy pixels in the level2.evt file, extra rows are filled as -1
| Pixel properties | Quadrant properties | ||||||
|---|---|---|---|---|---|---|---|
| Quadrant | DetID | PixID | Counts | Sigma | Mean | Median | Sigma |
| A | 13 | 254 | 12963 | 66.91 | 899 | 881 | 180.6 |
| A | 3 | 137 | 8070 | 39.81 | 899 | 881 | 180.6 |
| A | 0 | 226 | 7804 | 38.34 | 899 | 881 | 180.6 |
| B | 12 | 111 | 21402 | 117.95 | 903 | 879 | 174.0 |
| B | 11 | 111 | 19453 | 106.75 | 903 | 879 | 174.0 |
| B | 14 | 111 | 17472 | 95.36 | 903 | 879 | 174.0 |
| C | 14 | 238 | 135901 | 647.59 | 878 | 885 | 208.5 |
| C | 7 | 247 | 108394 | 515.66 | 878 | 885 | 208.5 |
| C | 0 | 10 | 76545 | 362.9 | 878 | 885 | 208.5 |
| D | 1 | 52 | 3639357 | 17183.64 | 866 | 842 | 211.7 |
| D | 8 | 195 | 400716 | 1888.49 | 866 | 842 | 211.7 |
| D | 2 | 234 | 28026 | 128.38 | 866 | 842 | 211.7 |
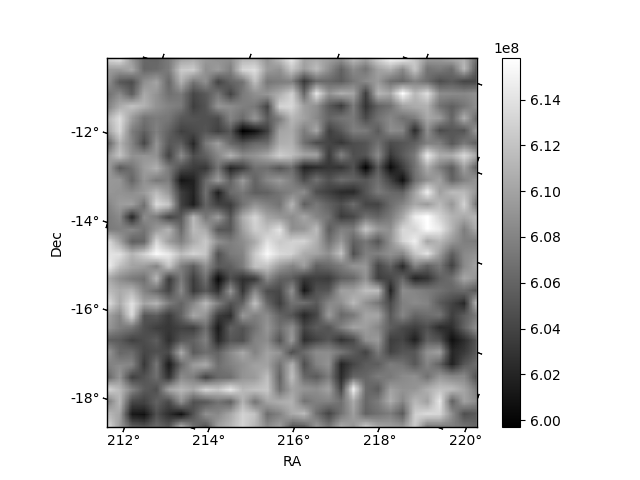
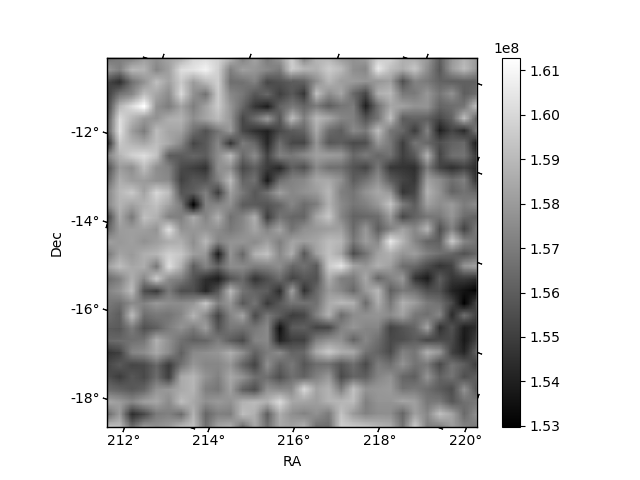
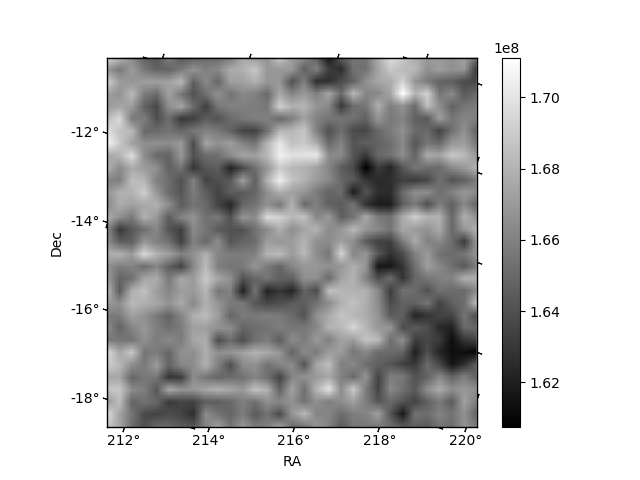
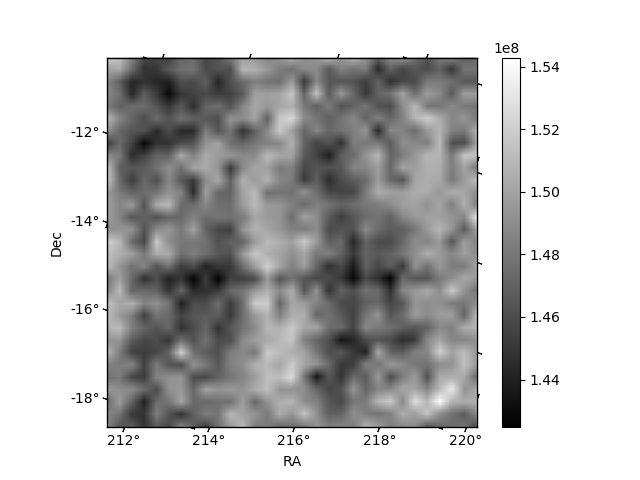
Histogram calculated using DETX and DETY for each event in the final _common_clean file
| Quadrant A | 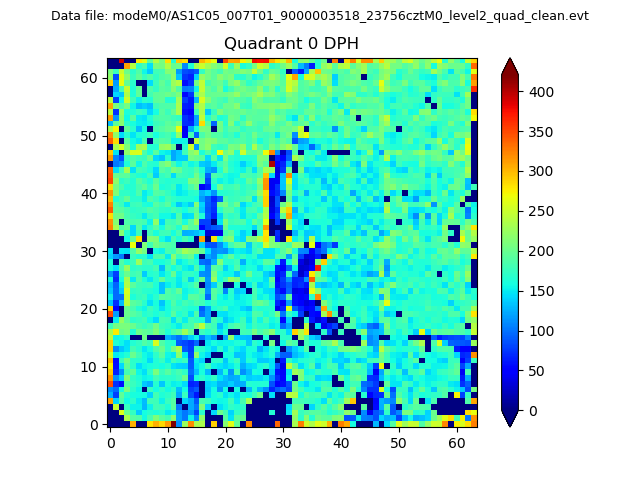 |
 |
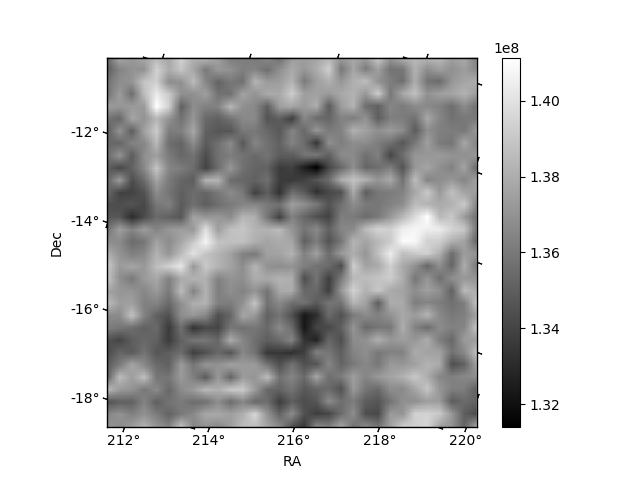
Quadrant B |
|---|---|---|---|
| Quadrant D | 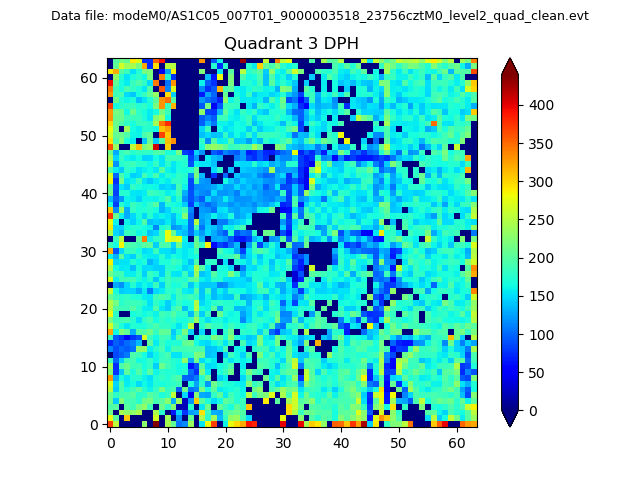 |
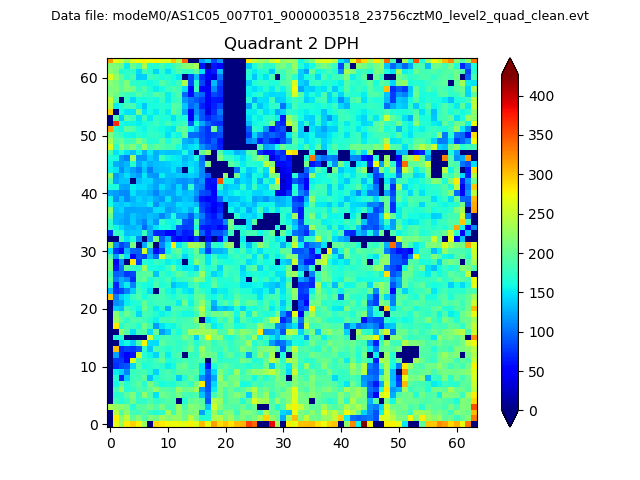 |
Quadrant C |
| Plot type | Count rate plots | Images |
|---|---|---|
| Comparison with Poisson distribution Blue bars denote a histogram of data divided into 1 sec bins. Red curve is a Poisson curve with rate = median count rate of data. |
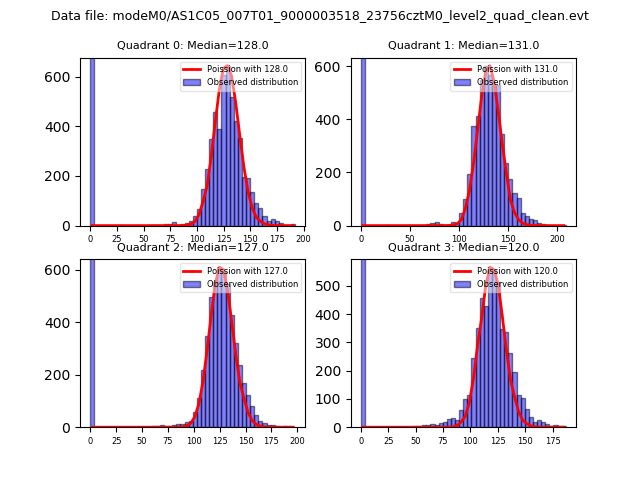 |
 |
| Quadrant-wise count rates Data is divided into 100 sec bins |
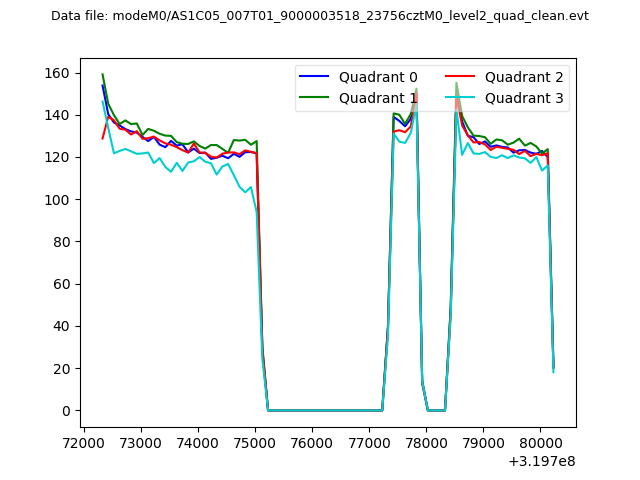 |
|
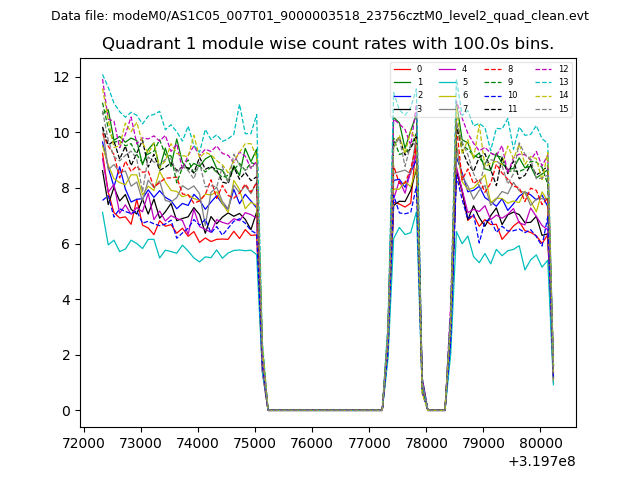
| Module-wise count rates for Quadrant A Data is divided into 100 sec bins |
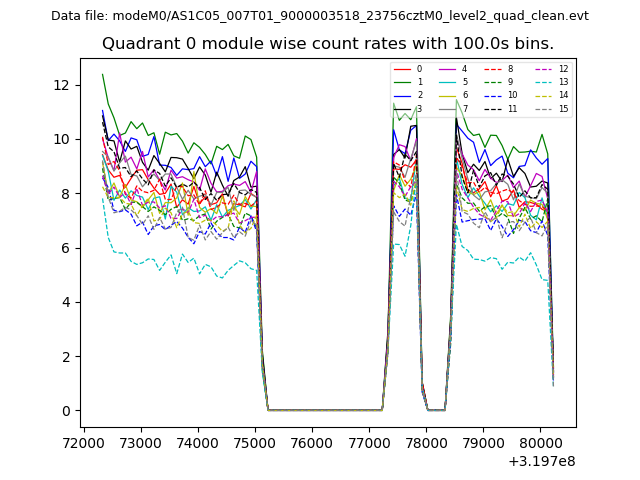 |
 |
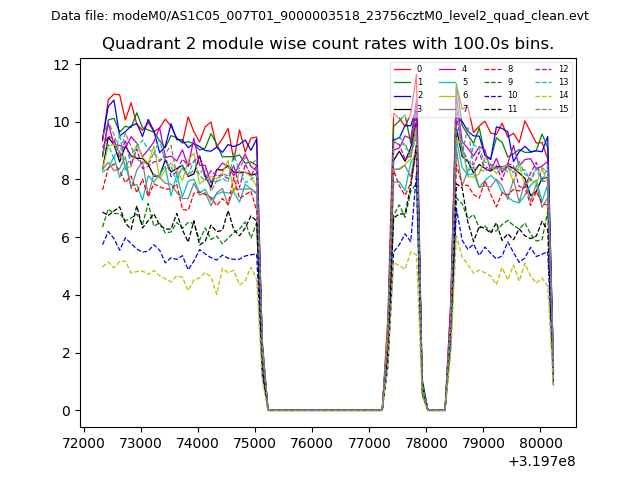
| Module-wise count rates for Quadrant B Data is divided into 100 sec bins |
 |
 |
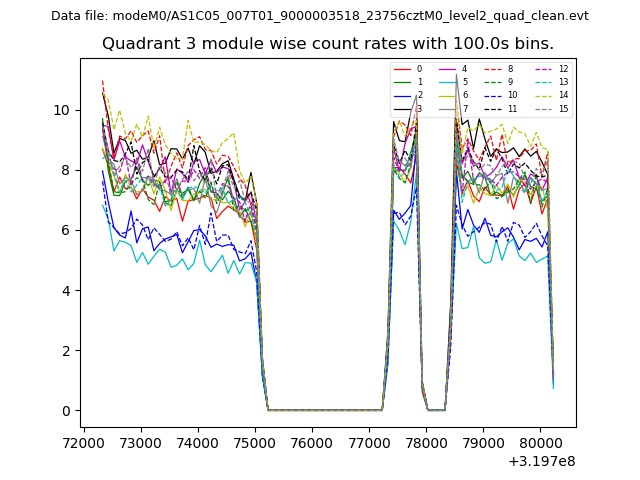
| Module-wise count rates for Quadrant C Data is divided into 100 sec bins |
 |
 |
| Module-wise count rates for Quadrant D Data is divided into 100 sec bins |
 |
 |
| Parameter | Plot |
|---|---|
| CZT HV Monitor | 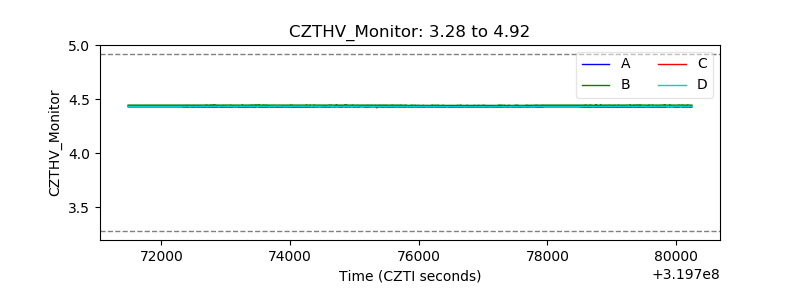 |
| D_VDD | 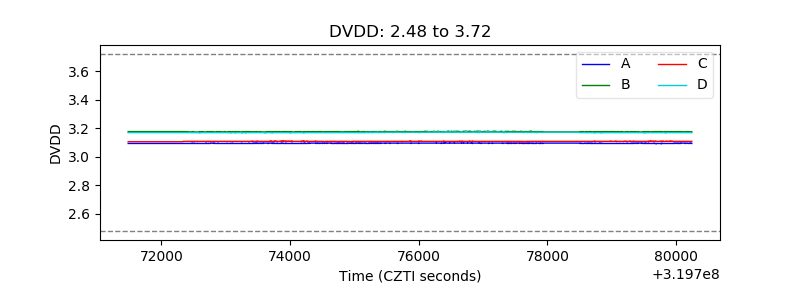 |
| Temperature 1 | 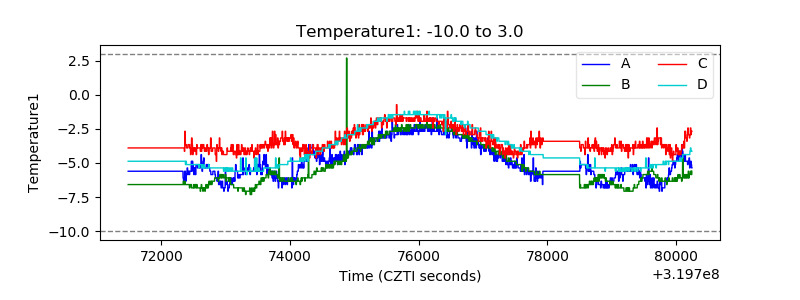 |
| Veto HV Monitor | 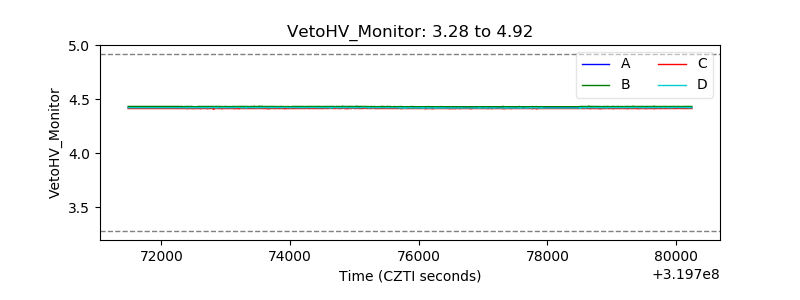 |
| Veto LLD | 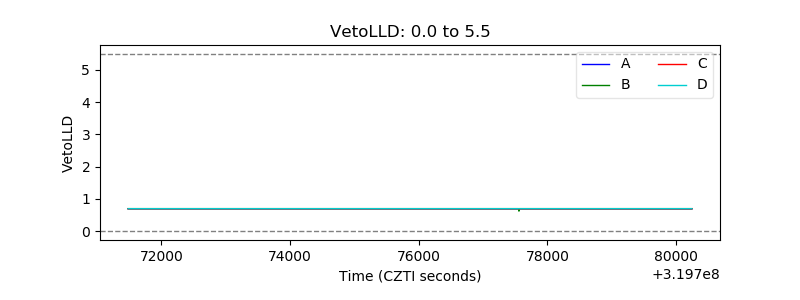 |
| Alpha Counter | 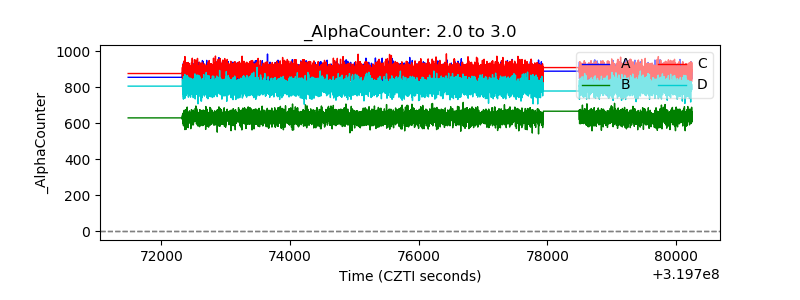 |
| _CPM_Rate | 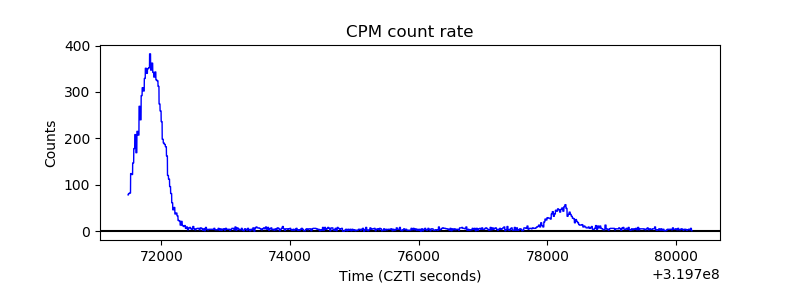 |
| CZT Counter | 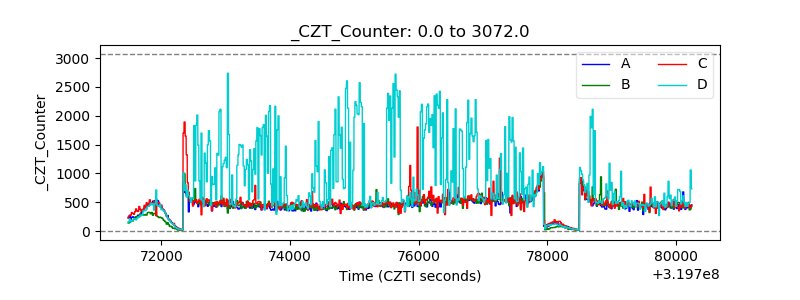 |
| +2.5 Volts monitor | 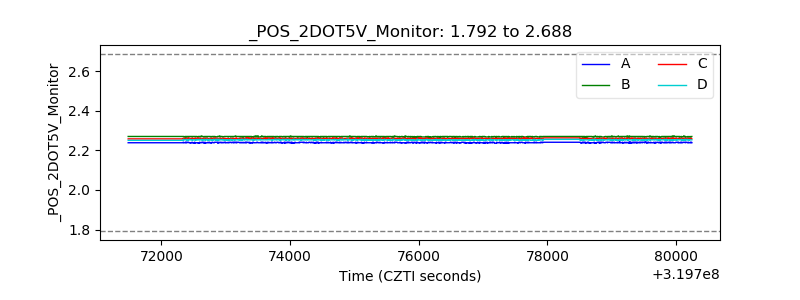 |
| +5 Volts monitor |  |
| _ROLL_ROT | 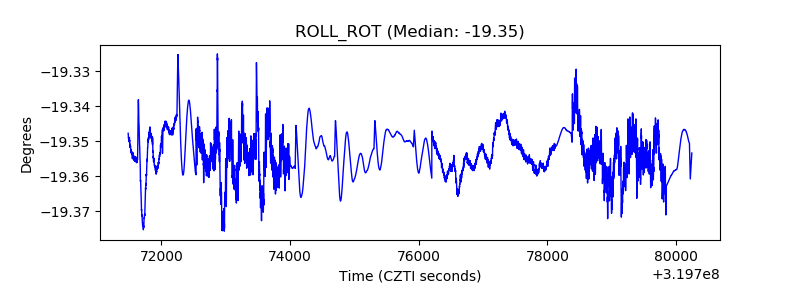 |
| _Roll_DEC |  |
| _Roll_RA | 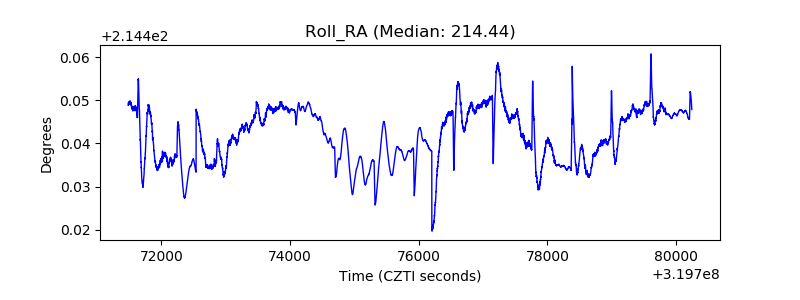 |
| Veto Counter | 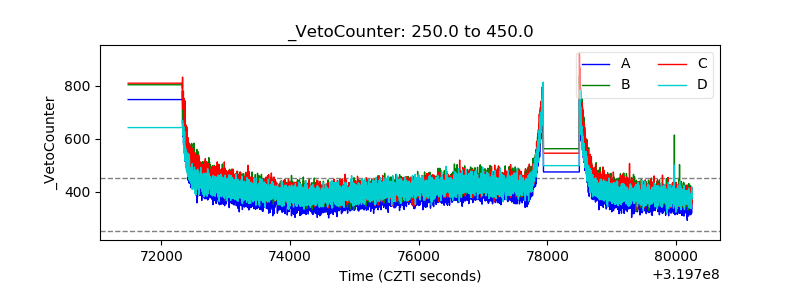 |