| Param | Original file | Final file |
|---|---|---|
| Filename | modeM0/AS1C05_007T01_9000003518_23757cztM0_level2.evt | modeM0/AS1C05_007T01_9000003518_23757cztM0_level2_quad_clean.evt |
| Size (bytes) | 631,022,400 | 124,076,160 |
| Size | 601.8 MB | 118.3 MB |
| Events in quadrant A | 4,077,451 | 797,589 |
| Events in quadrant B | 4,281,405 | 816,104 |
| Events in quadrant C | 4,240,941 | 789,390 |
| Events in quadrant D | 5,934,131 | 763,723 |
| Mode M9 | |||
|---|---|---|---|
| Quadrant | BADHDUFLAG | Total packets | Discarded packets |
| A | 0 | 7 | 0 |
| B | 0 | 7 | 0 |
| C | 0 | 7 | 0 |
| D | 0 | 7 | 0 |
| Mode SS | |||
|---|---|---|---|
| Quadrant | BADHDUFLAG | Total packets | Discarded packets |
| A | 0 | 174 | 0 |
| B | 0 | 174 | 0 |
| C | 0 | 174 | 0 |
| D | 0 | 174 | 0 |
| Mode M0 | |||
|---|---|---|---|
| Quadrant | BADHDUFLAG | Total packets | Discarded packets |
| A | 0 | 17718 | 2 |
| B | 0 | 18155 | 2 |
| C | 0 | 17912 | 2 |
| D | 0 | 23316 | 2 |
| Quadrant | Total seconds | Saturated seconds | Saturation percentage |
|---|---|---|---|
| A | 8506 | 174 | 2.045615% |
| B | 8506 | 221 | 2.598166% |
| C | 8506 | 262 | 3.080179% |
| D | 8506 | 338 | 3.973666% |
Noise dominated data is calculated using 1-second bins in cleaned event files. If a bin has >2000 counts, and if more than 50% of those come from <1% of pixels, then it is considered to be noise-dominated and hence unusable.
| Quadrant | # 1 sec bins | Bins with >0 counts | Bins with >2000 counts | High rate bins dominated by noise | Noise dominated (total time) | Noise dominated (detector-on time) | Marked lightcurve |
|---|---|---|---|---|---|---|---|
| A | 9181 | 8509 | 0 | 0 | 0.00% | 0.00% | 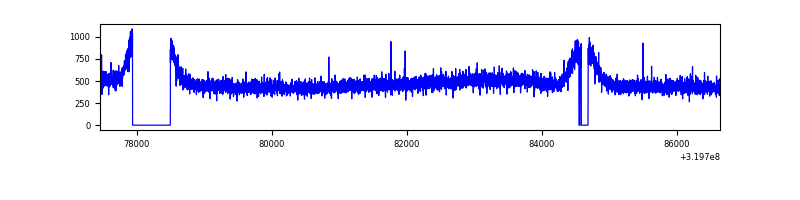 |
| B | 9181 | 8508 | 4 | 4 | 0.04% | 0.05% | 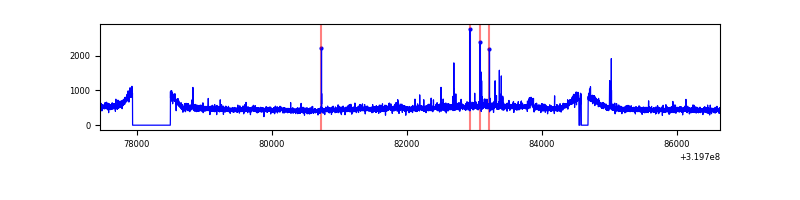 |
| C | 9181 | 8508 | 1 | 1 | 0.01% | 0.01% | 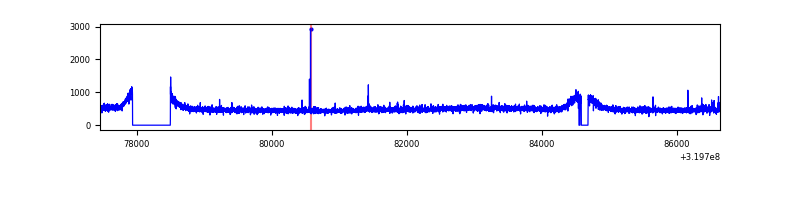 |
| D | 9181 | 8508 | 146 | 146 | 1.59% | 1.72% | 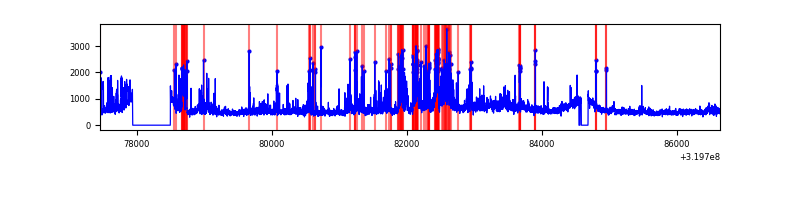 |
Top three noisy pixels from each quadrant. If the there are fewer than three noisy pixels in the level2.evt file, extra rows are filled as -1
| Pixel properties | Quadrant properties | ||||||
|---|---|---|---|---|---|---|---|
| Quadrant | DetID | PixID | Counts | Sigma | Mean | Median | Sigma |
| A | 13 | 254 | 15410 | 66.74 | 1057 | 1031 | 215.4 |
| A | 3 | 137 | 9504 | 39.33 | 1057 | 1031 | 215.4 |
| A | 0 | 226 | 9033 | 37.14 | 1057 | 1031 | 215.4 |
| B | 3 | 64 | 46579 | 223.1 | 1056 | 1029 | 204.2 |
| B | 0 | 229 | 33113 | 157.14 | 1056 | 1029 | 204.2 |
| B | 0 | 189 | 28159 | 132.88 | 1056 | 1029 | 204.2 |
| C | 14 | 238 | 158698 | 646.24 | 1029 | 1036 | 244.0 |
| C | 10 | 91 | 36675 | 146.08 | 1029 | 1036 | 244.0 |
| C | 7 | 247 | 32897 | 130.6 | 1029 | 1036 | 244.0 |
| D | 1 | 52 | 1130275 | 4469.71 | 1031 | 1000 | 252.7 |
| D | 8 | 195 | 661283 | 2613.43 | 1031 | 1000 | 252.7 |
| D | 12 | 233 | 239845 | 945.36 | 1031 | 1000 | 252.7 |
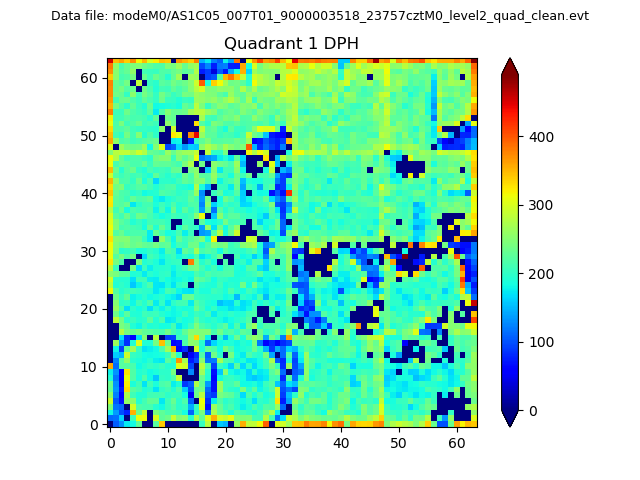
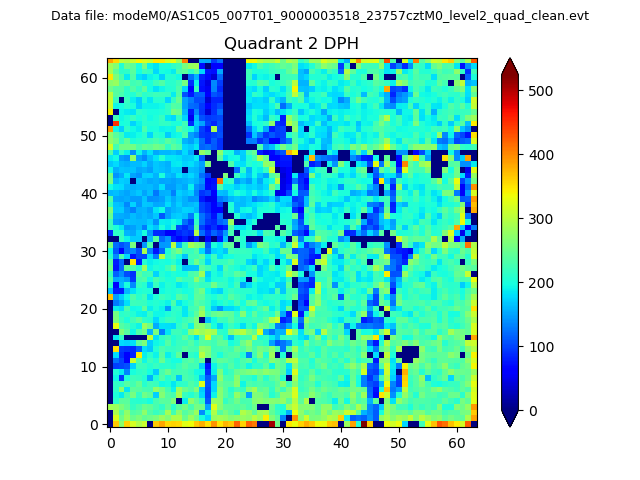
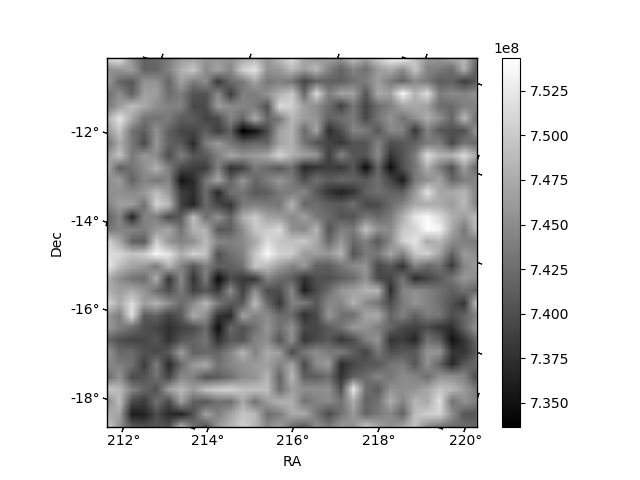
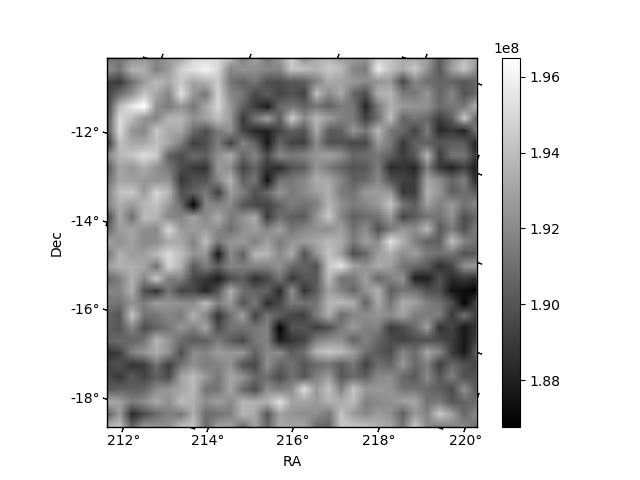
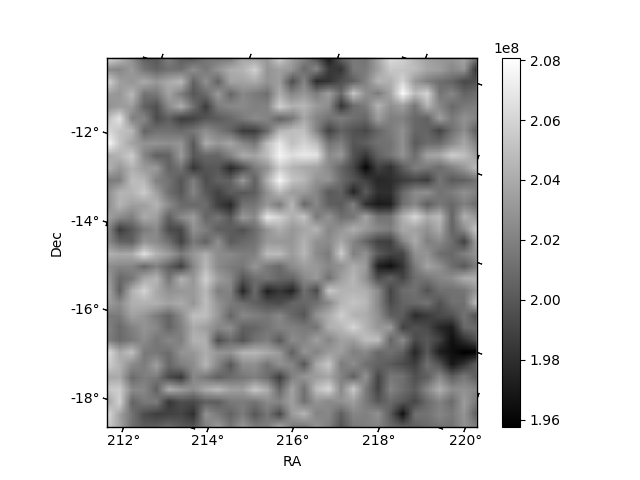
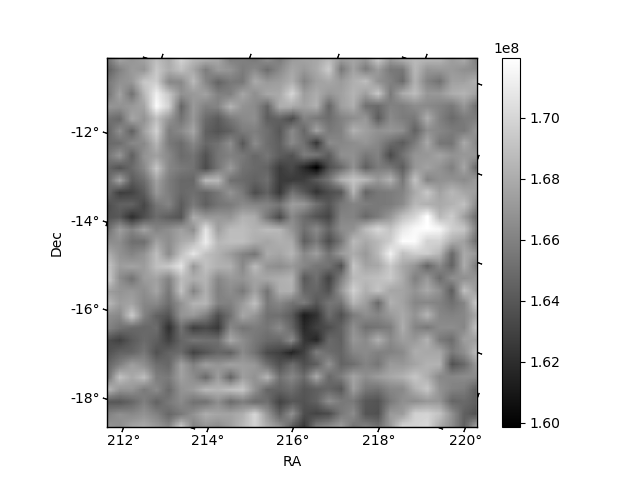
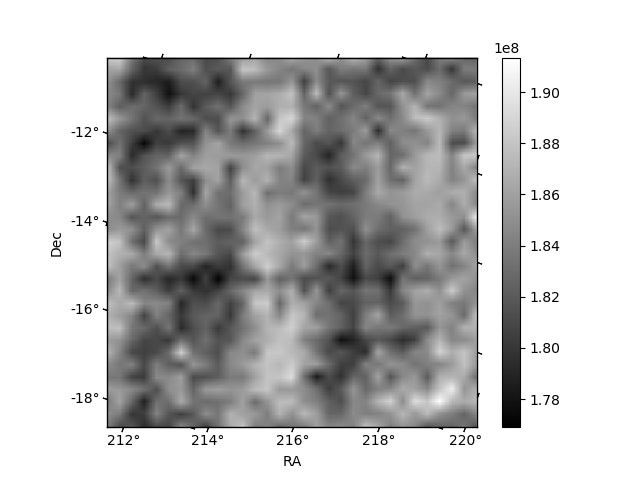
Histogram calculated using DETX and DETY for each event in the final _common_clean file
| Quadrant A |  |
 |
Quadrant B |
|---|---|---|---|
| Quadrant D | 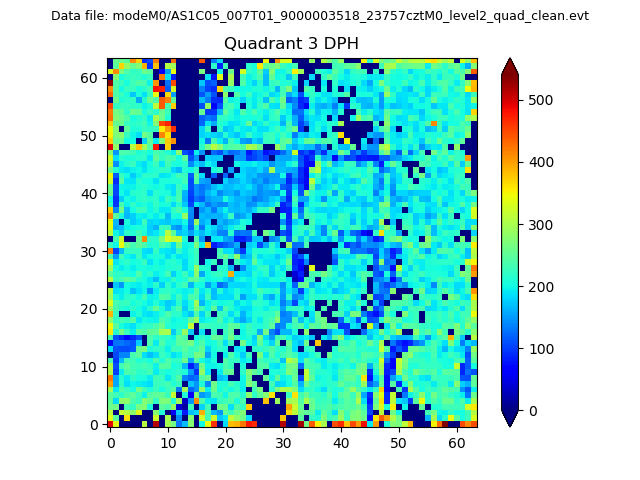 |
 |
Quadrant C |
| Plot type | Count rate plots | Images |
|---|---|---|
| Comparison with Poisson distribution Blue bars denote a histogram of data divided into 1 sec bins. Red curve is a Poisson curve with rate = median count rate of data. |
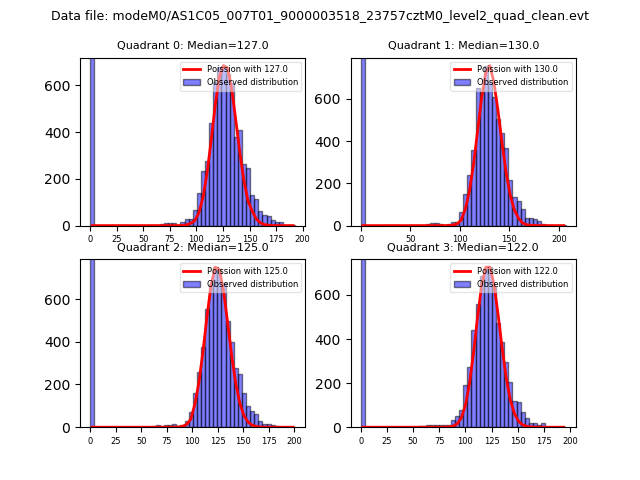 |
 |
| Quadrant-wise count rates Data is divided into 100 sec bins |
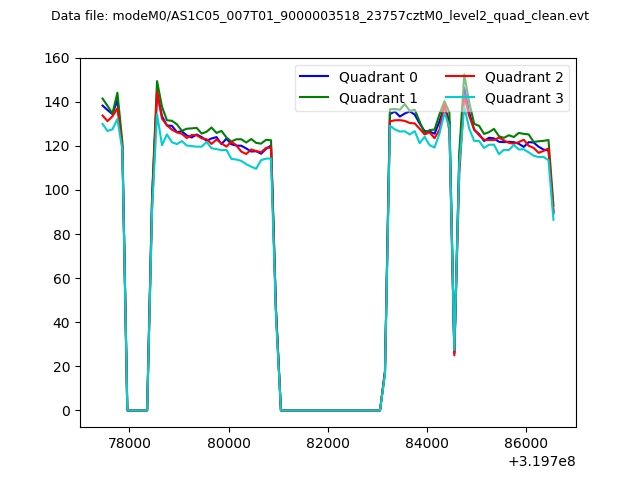 |
|
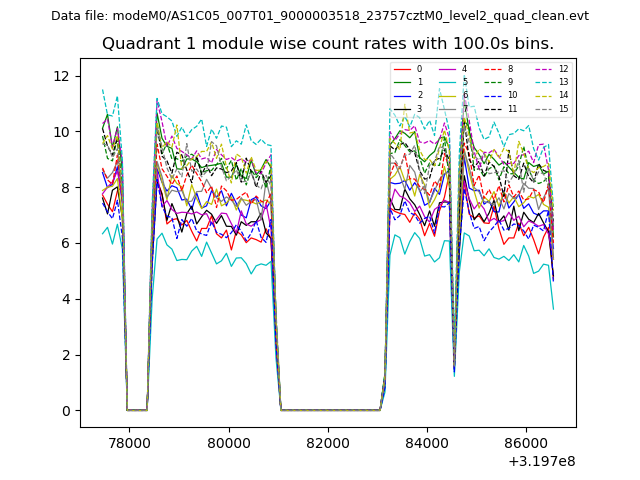
| Module-wise count rates for Quadrant A Data is divided into 100 sec bins |
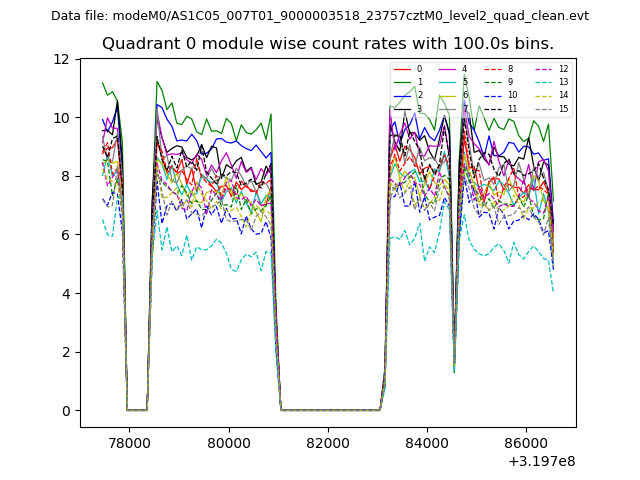 |
 |
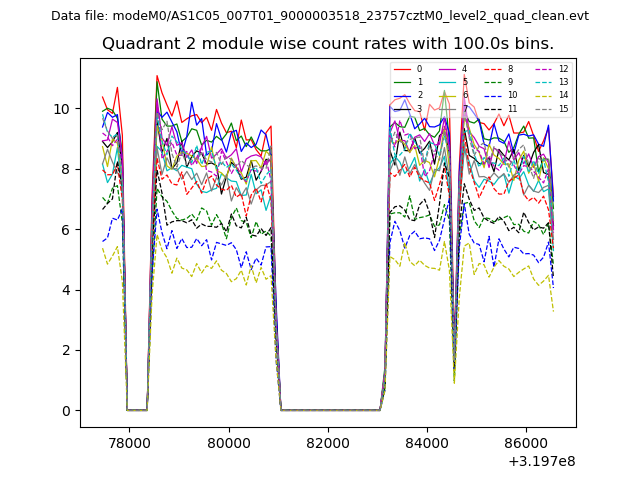
| Module-wise count rates for Quadrant B Data is divided into 100 sec bins |
 |
 |
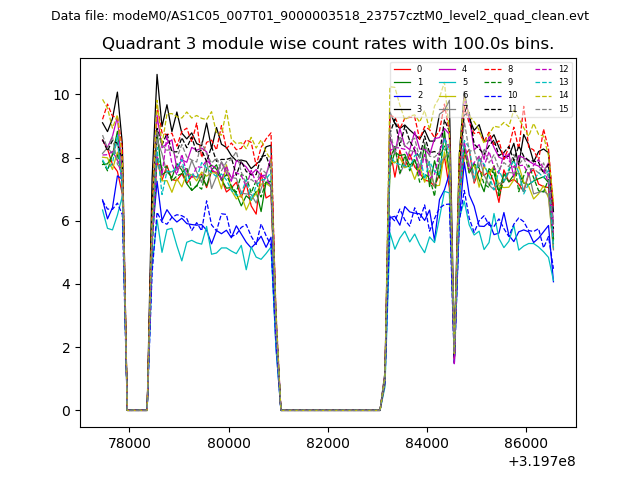
| Module-wise count rates for Quadrant C Data is divided into 100 sec bins |
 |
 |
| Module-wise count rates for Quadrant D Data is divided into 100 sec bins |
 |
 |
| Parameter | Plot |
|---|---|
| CZT HV Monitor | 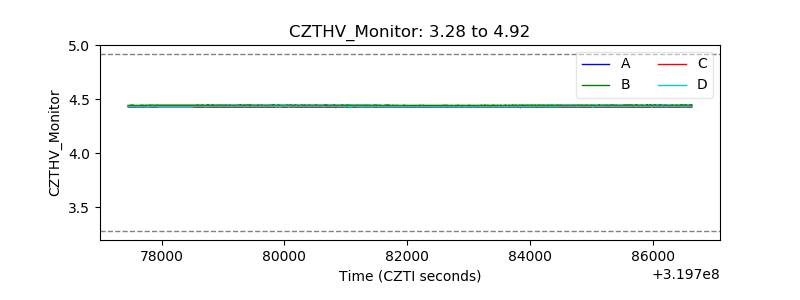 |
| D_VDD | 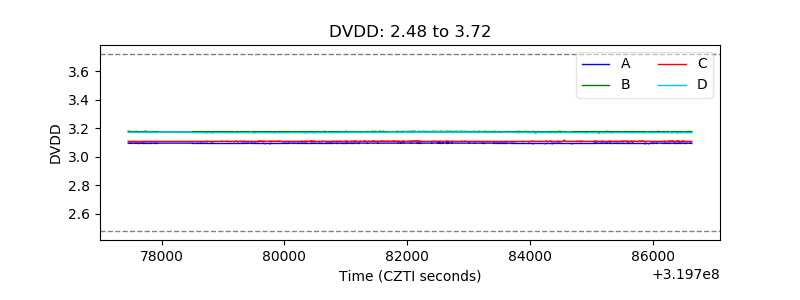 |
| Temperature 1 | 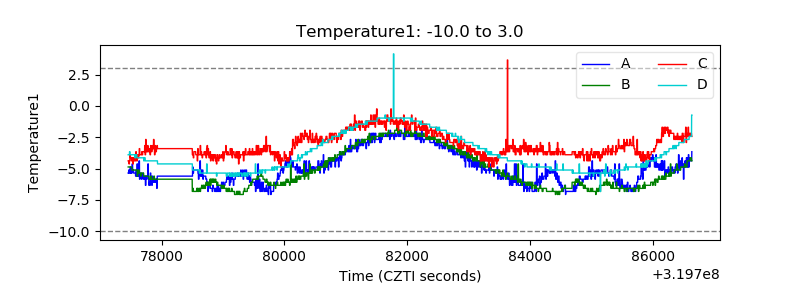 |
| Veto HV Monitor |  |
| Veto LLD | 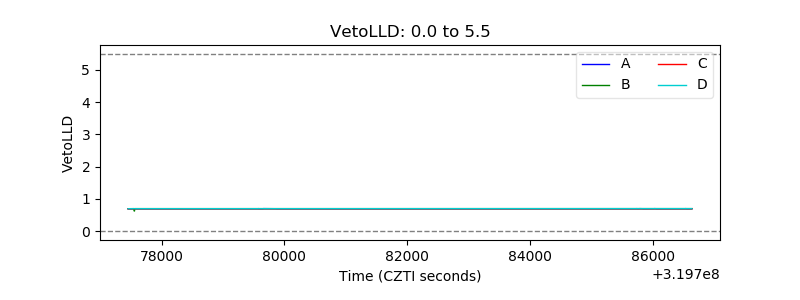 |
| Alpha Counter | 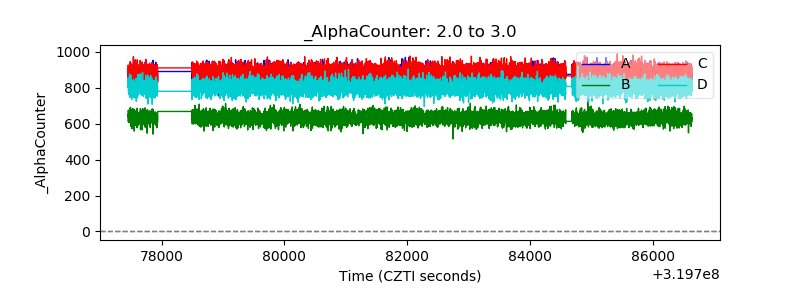 |
| _CPM_Rate | 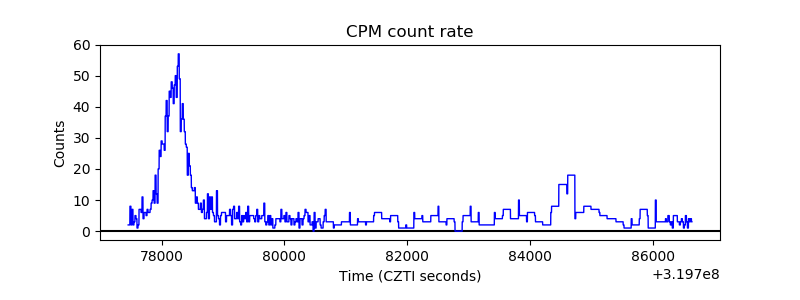 |
| CZT Counter | 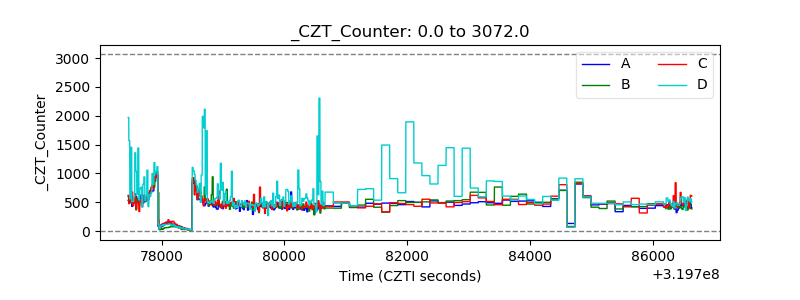 |
| +2.5 Volts monitor |  |
| +5 Volts monitor |  |
| _ROLL_ROT | 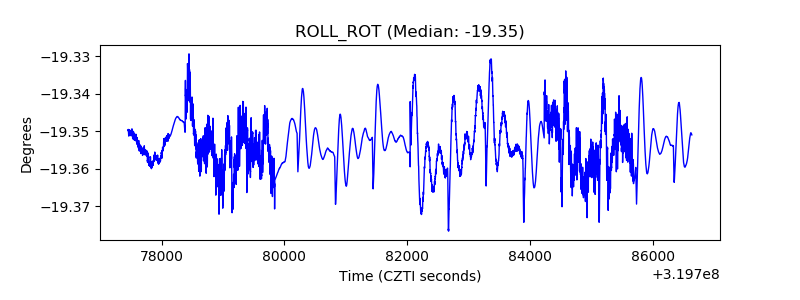 |
| _Roll_DEC |  |
| _Roll_RA |  |
| Veto Counter | 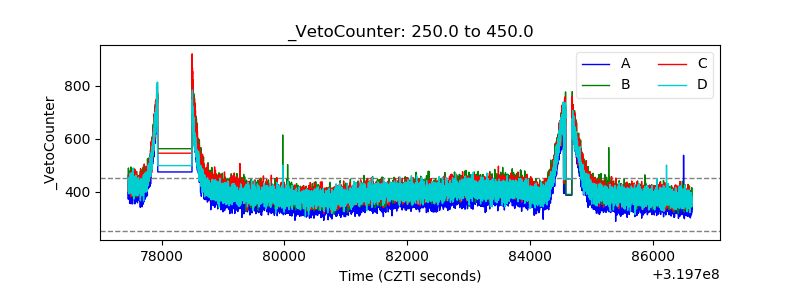 |