| Param | Original file | Final file |
|---|---|---|
| Filename | modeM0/AS1C05_007T01_9000003518_23759cztM0_level2.evt | modeM0/AS1C05_007T01_9000003518_23759cztM0_level2_quad_clean.evt |
| Size (bytes) | 521,951,040 | 85,098,240 |
| Size | 497.8 MB | 81.2 MB |
| Events in quadrant A | 3,197,211 | 527,841 |
| Events in quadrant B | 3,717,643 | 537,624 |
| Events in quadrant C | 3,288,111 | 526,541 |
| Events in quadrant D | 5,138,492 | 506,223 |
| Mode M9 | |||
|---|---|---|---|
| Quadrant | BADHDUFLAG | Total packets | Discarded packets |
| A | 0 | 3 | 0 |
| B | 0 | 3 | 0 |
| C | 0 | 3 | 0 |
| D | 0 | 3 | 0 |
| Mode SS | |||
|---|---|---|---|
| Quadrant | BADHDUFLAG | Total packets | Discarded packets |
| A | 0 | 140 | 0 |
| B | 0 | 140 | 0 |
| C | 0 | 140 | 0 |
| D | 0 | 140 | 0 |
| Mode M0 | |||
|---|---|---|---|
| Quadrant | BADHDUFLAG | Total packets | Discarded packets |
| A | 0 | 13991 | 1 |
| B | 0 | 15338 | 1 |
| C | 0 | 14060 | 1 |
| D | 0 | 19924 | 3 |
| Quadrant | Total seconds | Saturated seconds | Saturation percentage |
|---|---|---|---|
| A | 6863 | 122 | 1.777648% |
| B | 6864 | 211 | 3.074009% |
| C | 6864 | 145 | 2.112471% |
| D | 6863 | 255 | 3.715576% |
Noise dominated data is calculated using 1-second bins in cleaned event files. If a bin has >2000 counts, and if more than 50% of those come from <1% of pixels, then it is considered to be noise-dominated and hence unusable.
| Quadrant | # 1 sec bins | Bins with >0 counts | Bins with >2000 counts | High rate bins dominated by noise | Noise dominated (total time) | Noise dominated (detector-on time) | Marked lightcurve |
|---|---|---|---|---|---|---|---|
| A | 7218 | 6863 | 0 | 0 | 0.00% | 0.00% | 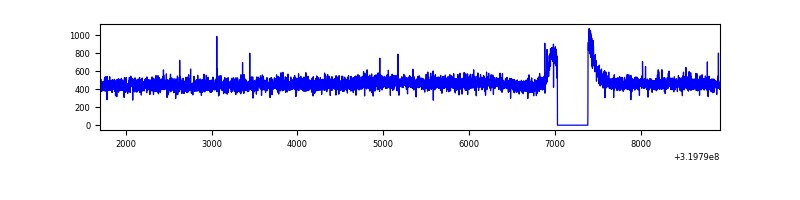 |
| B | 7219 | 6864 | 37 | 37 | 0.51% | 0.54% |  |
| C | 7219 | 6864 | 0 | 0 | 0.00% | 0.00% | 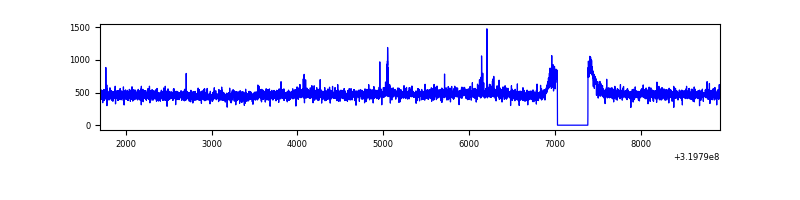 |
| D | 7218 | 6863 | 150 | 150 | 2.08% | 2.19% | 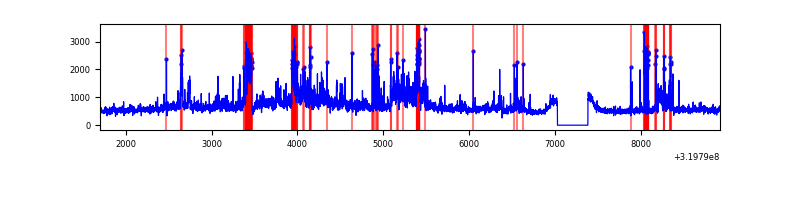 |
Top three noisy pixels from each quadrant. If the there are fewer than three noisy pixels in the level2.evt file, extra rows are filled as -1
| Pixel properties | Quadrant properties | ||||||
|---|---|---|---|---|---|---|---|
| Quadrant | DetID | PixID | Counts | Sigma | Mean | Median | Sigma |
| A | 13 | 254 | 12271 | 67.9 | 828 | 809 | 168.8 |
| A | 3 | 137 | 7632 | 40.42 | 828 | 809 | 168.8 |
| A | 0 | 226 | 7164 | 37.65 | 828 | 809 | 168.8 |
| B | 3 | 64 | 229633 | 1434.72 | 820 | 801 | 159.5 |
| B | 14 | 207 | 117939 | 734.43 | 820 | 801 | 159.5 |
| B | 7 | 234 | 68460 | 424.2 | 820 | 801 | 159.5 |
| C | 14 | 238 | 125623 | 659.16 | 803 | 810 | 189.4 |
| C | 7 | 247 | 26433 | 135.32 | 803 | 810 | 189.4 |
| C | 13 | 61 | 5547 | 25.02 | 803 | 810 | 189.4 |
| D | 8 | 195 | 1158538 | 5847.5 | 809 | 786 | 198.0 |
| D | 1 | 52 | 885165 | 4466.77 | 809 | 786 | 198.0 |
| D | 2 | 234 | 29158 | 143.3 | 809 | 786 | 198.0 |
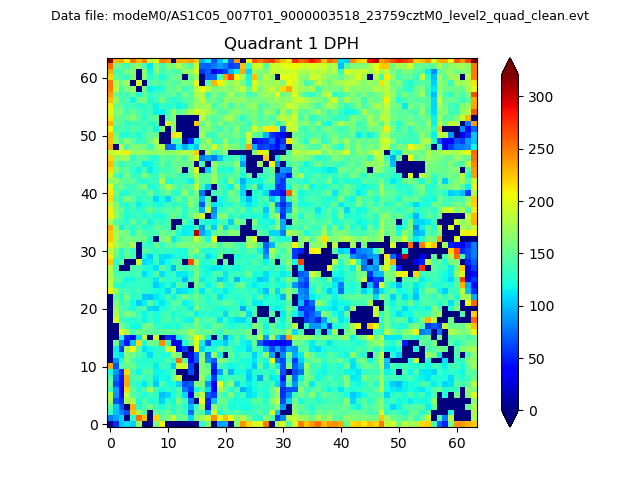
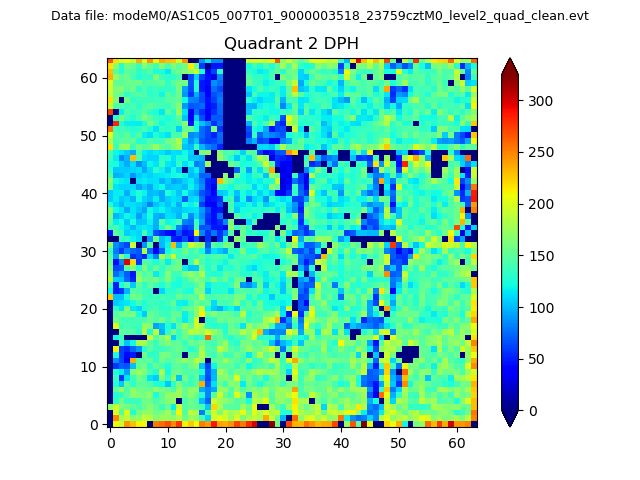
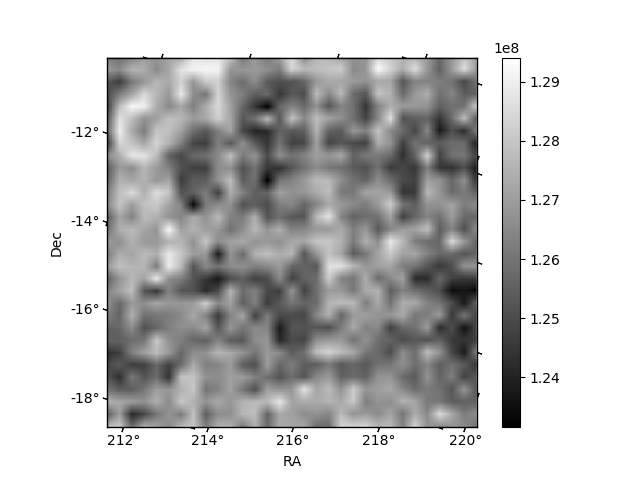
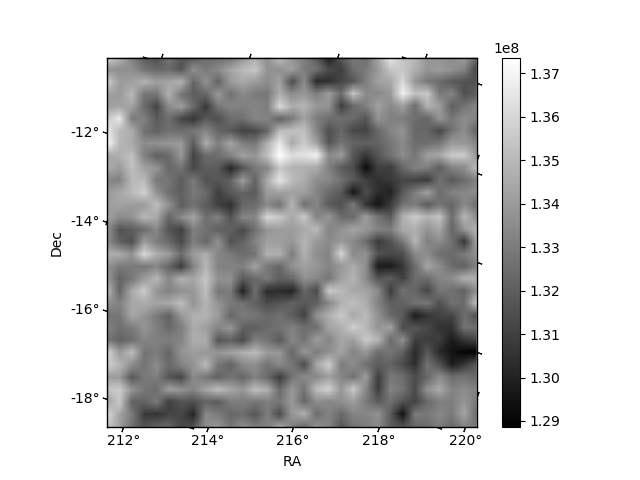
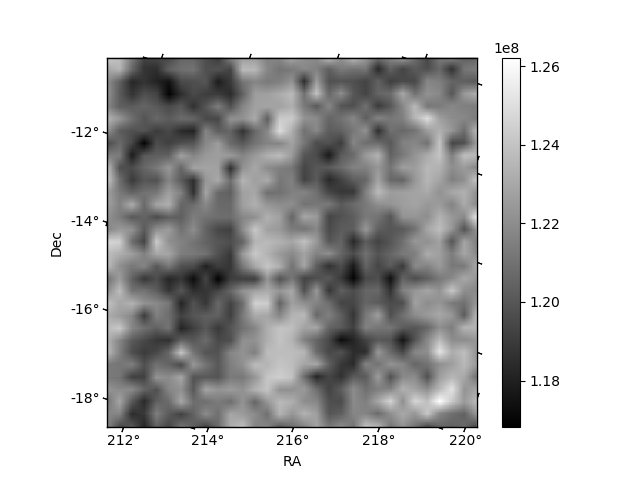
Histogram calculated using DETX and DETY for each event in the final _common_clean file
| Quadrant A |  |
 |
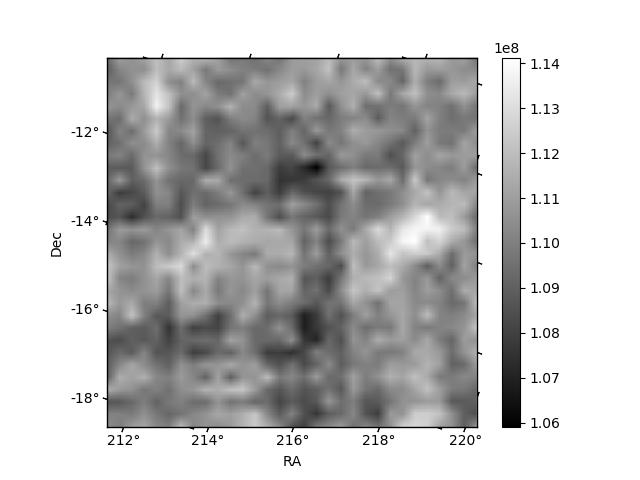
Quadrant B |
|---|---|---|---|
| Quadrant D | 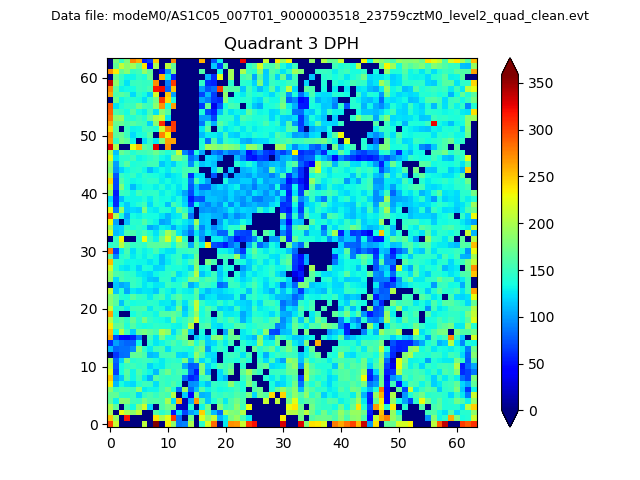 |
 |
Quadrant C |
| Plot type | Count rate plots | Images |
|---|---|---|
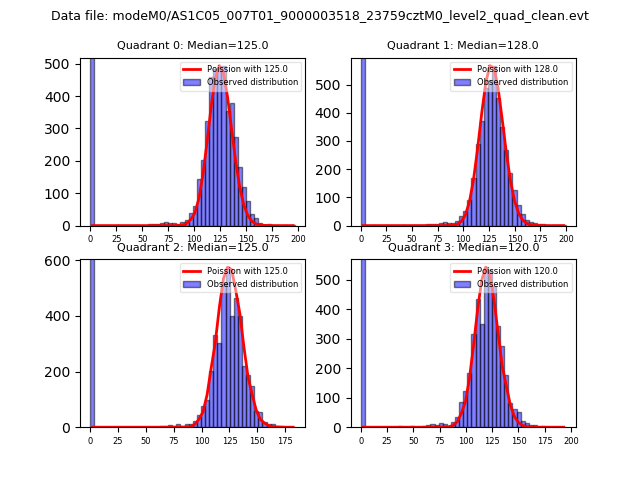
| Comparison with Poisson distribution Blue bars denote a histogram of data divided into 1 sec bins. Red curve is a Poisson curve with rate = median count rate of data. |
 |
 |
| Quadrant-wise count rates Data is divided into 100 sec bins |
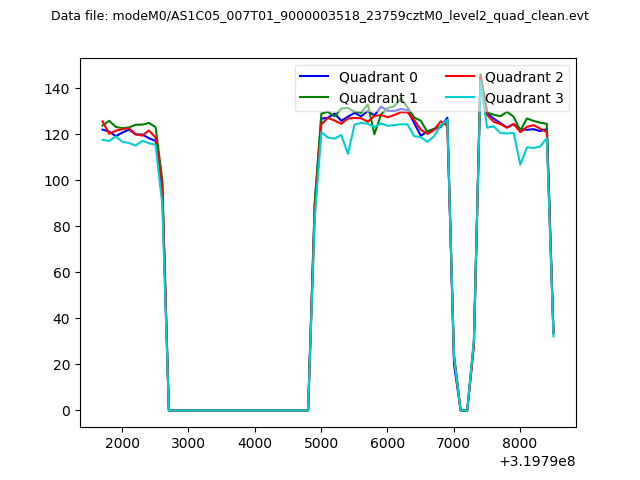 |
|
| Module-wise count rates for Quadrant A Data is divided into 100 sec bins |
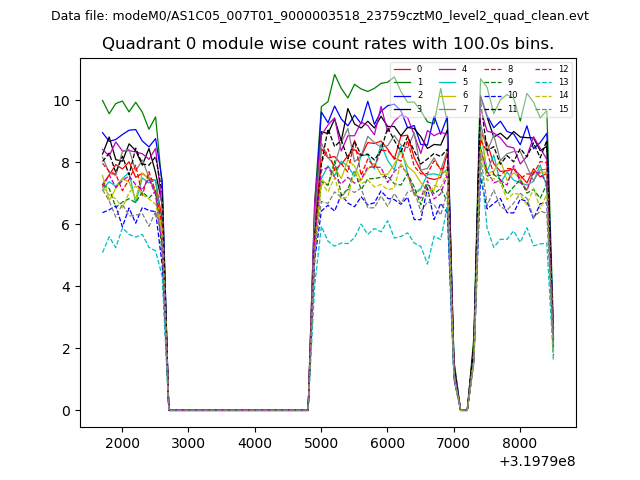 |
 |
| Module-wise count rates for Quadrant B Data is divided into 100 sec bins |
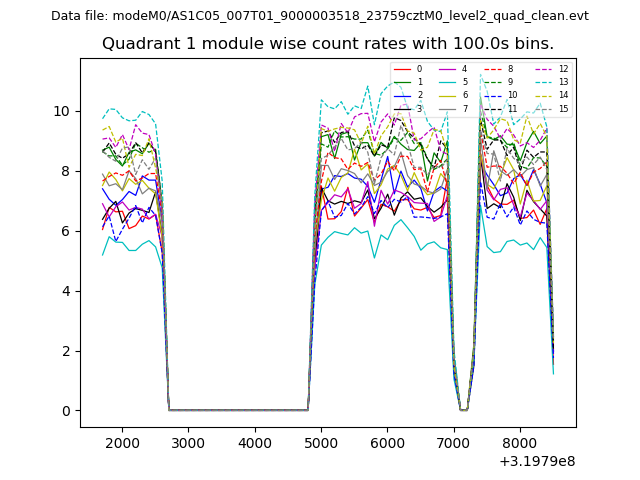 |
 |
| Module-wise count rates for Quadrant C Data is divided into 100 sec bins |
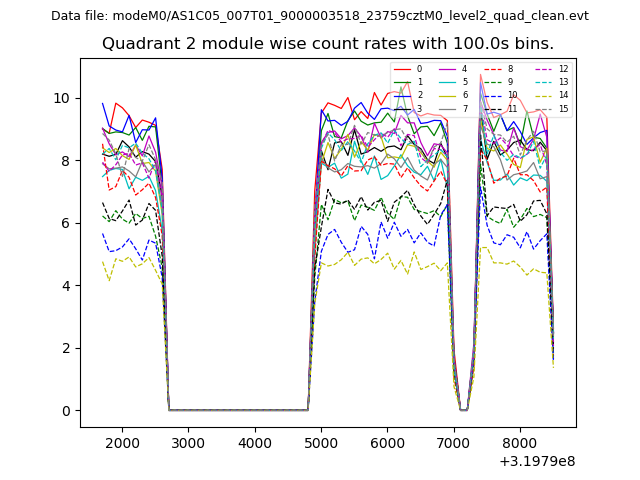 |
 |
| Module-wise count rates for Quadrant D Data is divided into 100 sec bins |
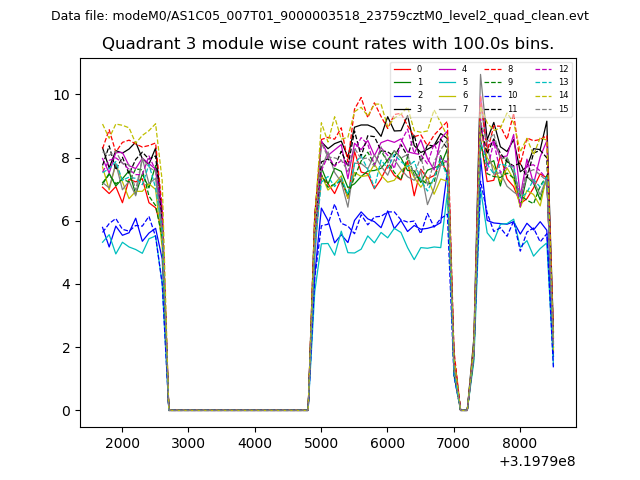 |
 |
| Parameter | Plot |
|---|---|
| CZT HV Monitor | 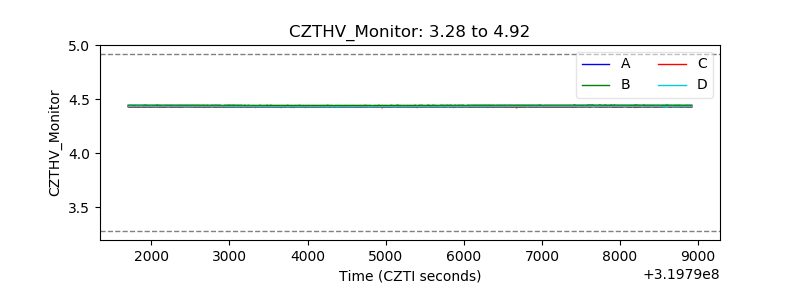 |
| D_VDD | 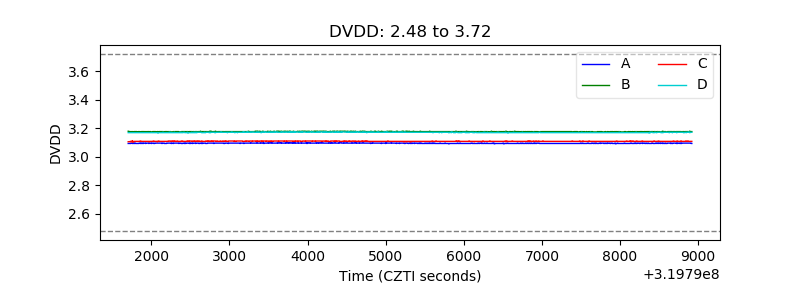 |
| Temperature 1 | 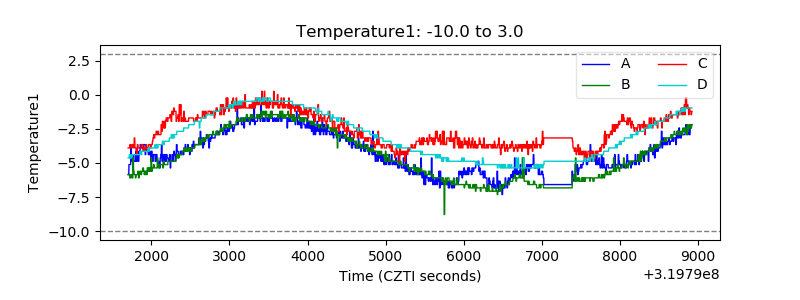 |
| Veto HV Monitor | 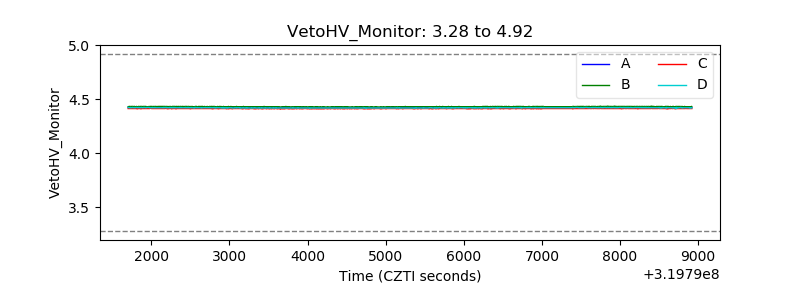 |
| Veto LLD | 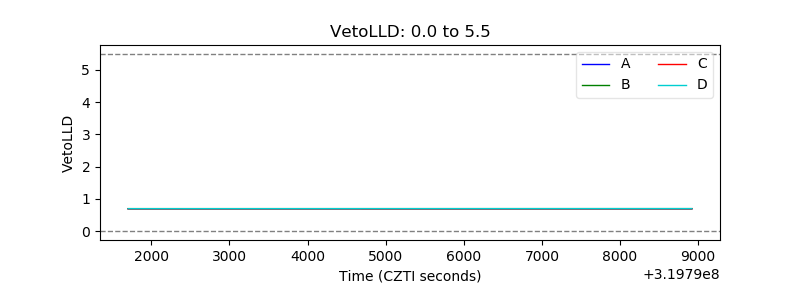 |
| Alpha Counter | 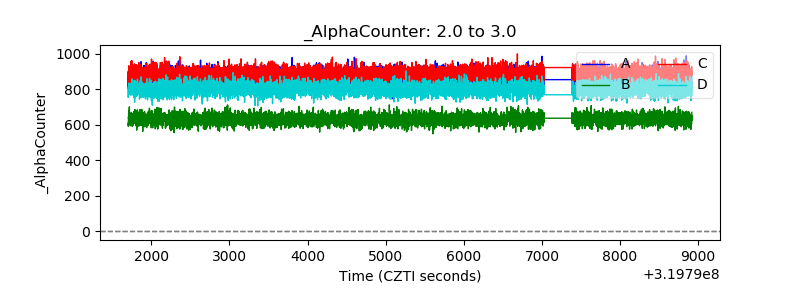 |
| _CPM_Rate |  |
| CZT Counter | 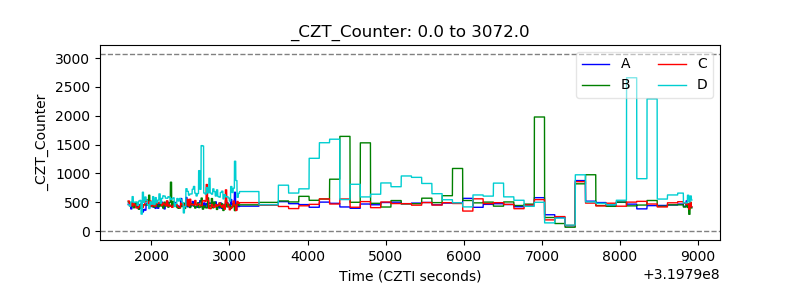 |
| +2.5 Volts monitor | 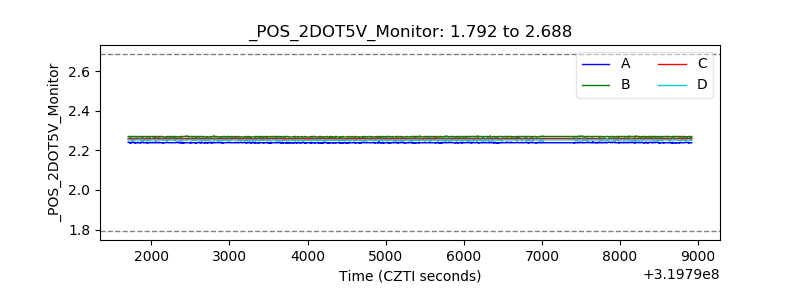 |
| +5 Volts monitor | 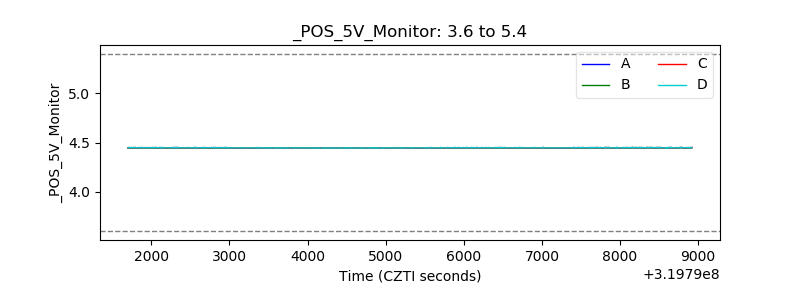 |
| _ROLL_ROT | 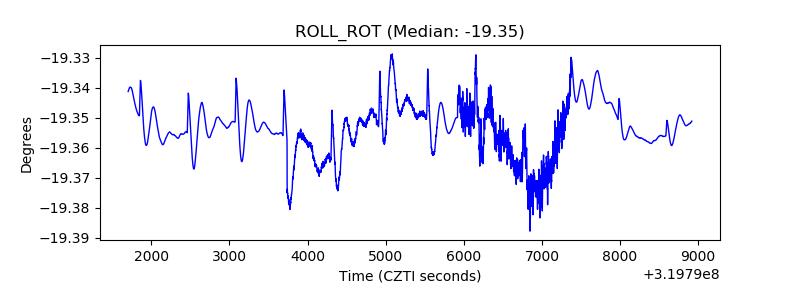 |
| _Roll_DEC |  |
| _Roll_RA | 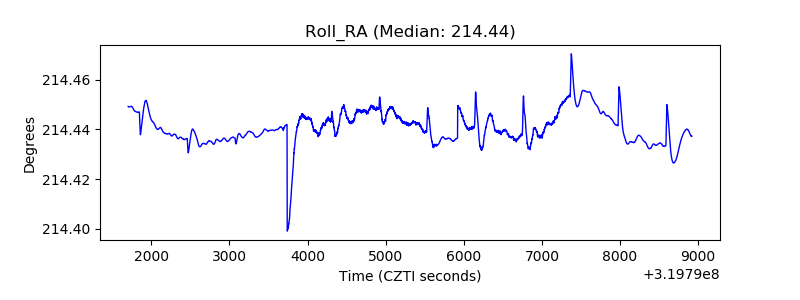 |
| Veto Counter | 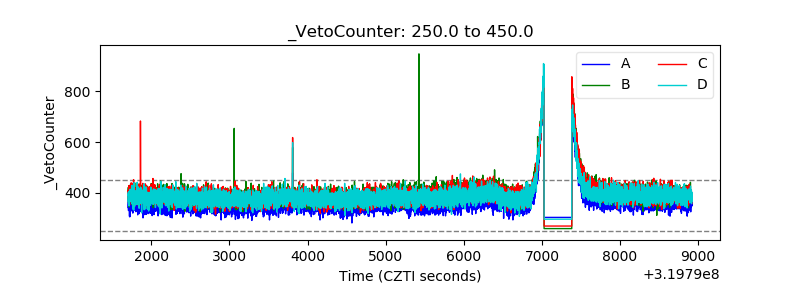 |