| Param | Original file | Final file |
|---|---|---|
| Filename | modeM0/AS1C05_007T01_9000003518_23761cztM0_level2.evt | modeM0/AS1C05_007T01_9000003518_23761cztM0_level2_quad_clean.evt |
| Size (bytes) | 745,634,880 | 110,813,760 |
| Size | 711.1 MB | 105.7 MB |
| Events in quadrant A | 4,840,077 | 695,872 |
| Events in quadrant B | 5,155,733 | 629,102 |
| Events in quadrant C | 5,437,105 | 675,705 |
| Events in quadrant D | 6,469,343 | 660,789 |
| Mode M9 | |||
|---|---|---|---|
| Quadrant | BADHDUFLAG | Total packets | Discarded packets |
| A | 0 | 13 | 3 |
| B | 0 | 13 | 1 |
| C | 0 | 13 | 1 |
| D | 0 | 13 | 3 |
| Mode SS | |||
|---|---|---|---|
| Quadrant | BADHDUFLAG | Total packets | Discarded packets |
| A | 0 | 254 | 50 |
| B | 0 | 254 | 50 |
| C | 0 | 254 | 38 |
| D | 0 | 254 | 44 |
| Mode M0 | |||
|---|---|---|---|
| Quadrant | BADHDUFLAG | Total packets | Discarded packets |
| A | 0 | 25338 | 4183 |
| B | 0 | 29593 | 8614 |
| C | 0 | 27493 | 4856 |
| D | 0 | 31222 | 5691 |
| Quadrant | Total seconds | Saturated seconds | Saturation percentage |
|---|---|---|---|
| A | 10408 | 126 | 1.210607% |
| B | 8996 | 292 | 3.245887% |
| C | 10344 | 287 | 2.774555% |
| D | 10201 | 340 | 3.333007% |
Noise dominated data is calculated using 1-second bins in cleaned event files. If a bin has >2000 counts, and if more than 50% of those come from <1% of pixels, then it is considered to be noise-dominated and hence unusable.
| Quadrant | # 1 sec bins | Bins with >0 counts | Bins with >2000 counts | High rate bins dominated by noise | Noise dominated (total time) | Noise dominated (detector-on time) | Marked lightcurve |
|---|---|---|---|---|---|---|---|
| A | 13754 | 11328 | 0 | 0 | 0.00% | 0.00% | 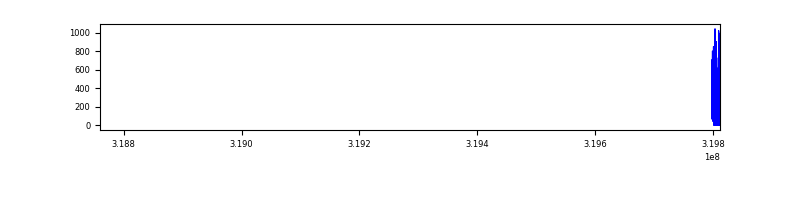 |
| B | 1048576 | 9475 | 99 | 99 | 0.01% | 1.04% |  |
| C | 13756 | 11290 | 96 | 96 | 0.70% | 0.85% | 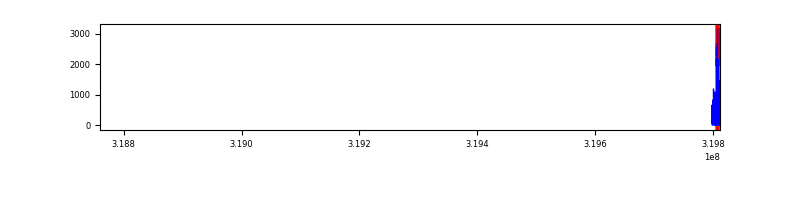 |
| D | 13758 | 11120 | 208 | 208 | 1.51% | 1.87% | 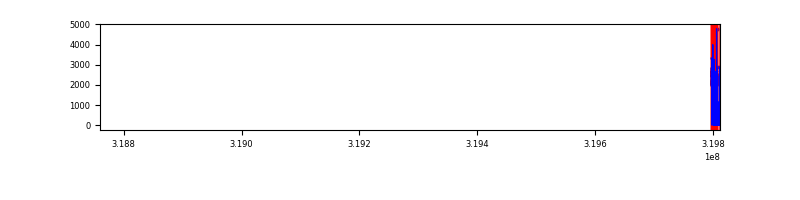 |
Top three noisy pixels from each quadrant. If the there are fewer than three noisy pixels in the level2.evt file, extra rows are filled as -1
| Pixel properties | Quadrant properties | ||||||
|---|---|---|---|---|---|---|---|
| Quadrant | DetID | PixID | Counts | Sigma | Mean | Median | Sigma |
| A | 13 | 254 | 18244 | 67.19 | 1252 | 1217 | 253.4 |
| A | 3 | 137 | 11338 | 39.94 | 1252 | 1217 | 253.4 |
| A | 0 | 226 | 10625 | 37.12 | 1252 | 1217 | 253.4 |
| B | 3 | 64 | 870860 | 4289.79 | 1050 | 1023 | 202.8 |
| B | 0 | 229 | 72797 | 353.97 | 1050 | 1023 | 202.8 |
| B | 0 | 189 | 54983 | 266.12 | 1050 | 1023 | 202.8 |
| C | 10 | 9 | 534013 | 1884.21 | 1200 | 1210 | 282.8 |
| C | 14 | 238 | 188494 | 662.31 | 1200 | 1210 | 282.8 |
| C | 7 | 247 | 23081 | 77.34 | 1200 | 1210 | 282.8 |
| D | 8 | 195 | 888717 | 3061.95 | 1191 | 1157 | 289.9 |
| D | 1 | 52 | 785294 | 2705.16 | 1191 | 1157 | 289.9 |
| D | 13 | 174 | 153696 | 526.24 | 1191 | 1157 | 289.9 |
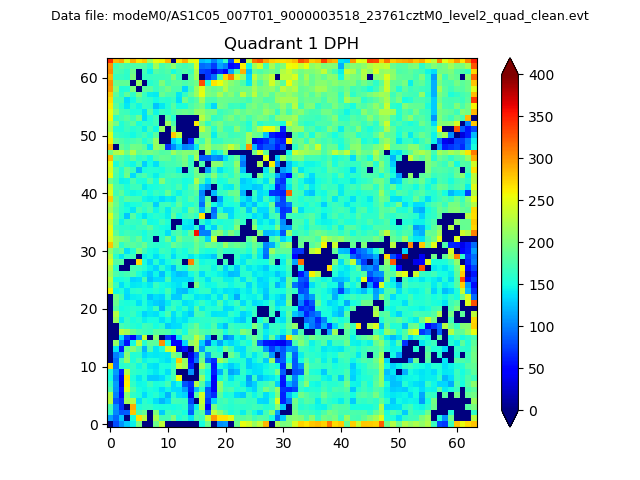
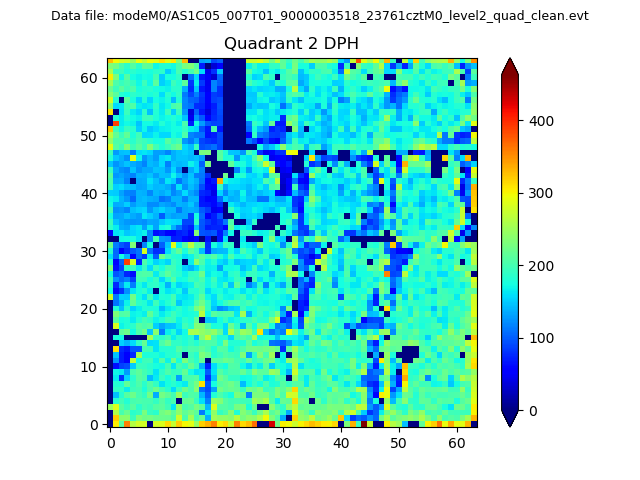
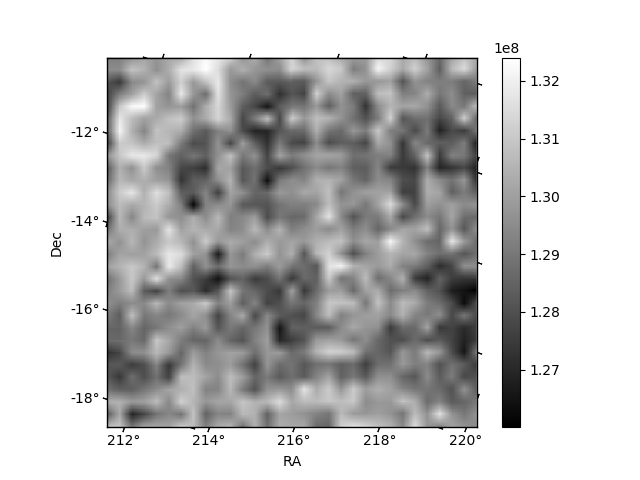
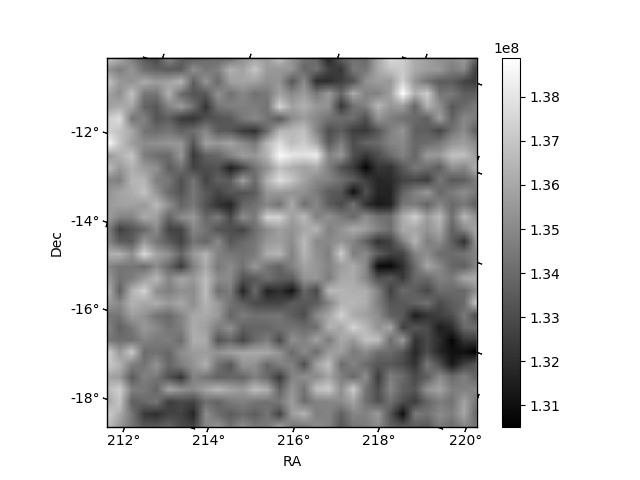
Histogram calculated using DETX and DETY for each event in the final _common_clean file
| Quadrant A |  |
 |
Quadrant B |
|---|---|---|---|
| Quadrant D | 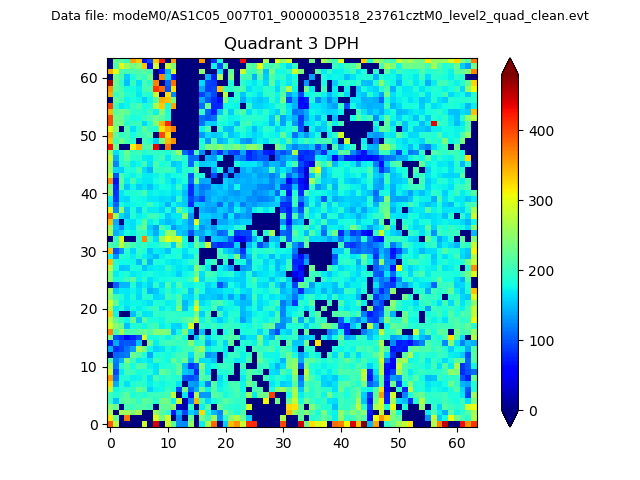 |
 |
Quadrant C |
| Plot type | Count rate plots | Images |
|---|---|---|
| Comparison with Poisson distribution Blue bars denote a histogram of data divided into 1 sec bins. Red curve is a Poisson curve with rate = median count rate of data. |
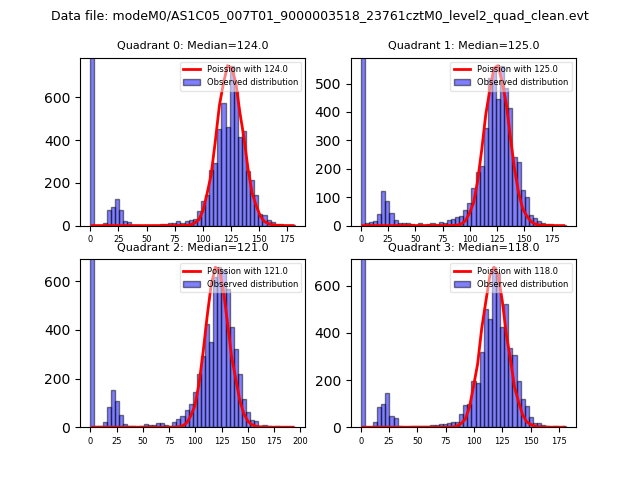 |
 |
| Quadrant-wise count rates Data is divided into 100 sec bins |
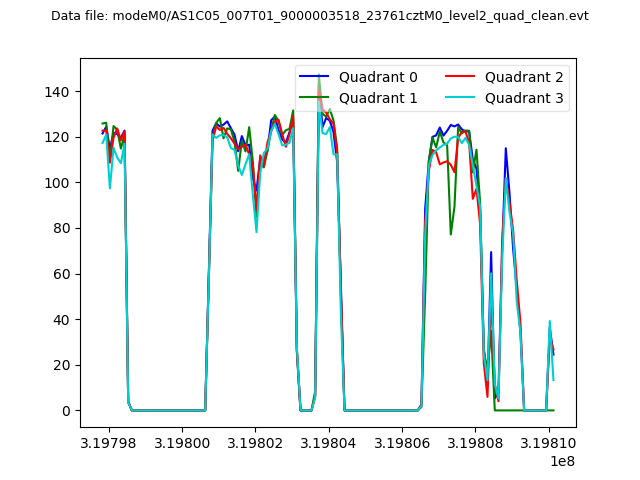 |
|
| Module-wise count rates for Quadrant A Data is divided into 100 sec bins |
 |
 |
| Module-wise count rates for Quadrant B Data is divided into 100 sec bins |
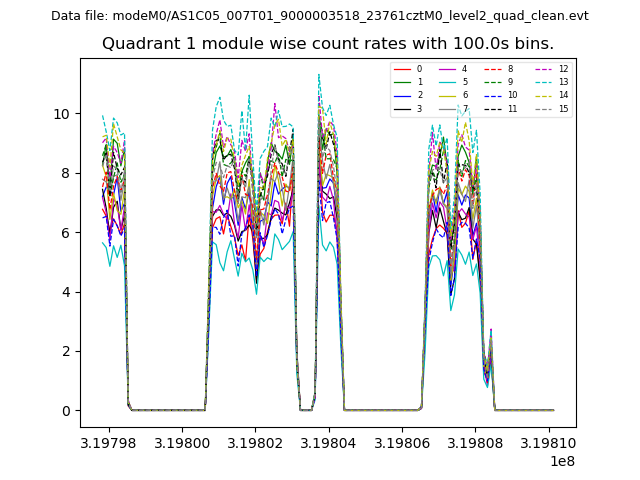 |
 |
| Module-wise count rates for Quadrant C Data is divided into 100 sec bins |
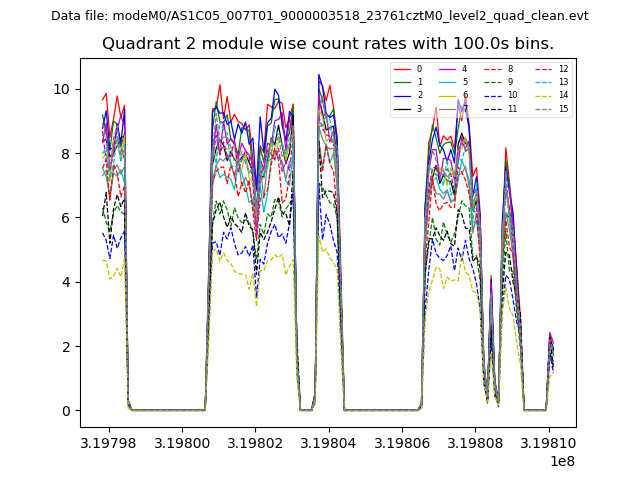 |
 |
| Module-wise count rates for Quadrant D Data is divided into 100 sec bins |
 |
 |
| Parameter | Plot |
|---|---|
| CZT HV Monitor |  |
| D_VDD | 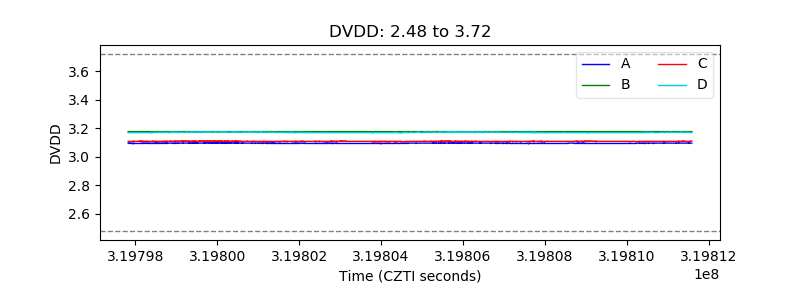 |
| Temperature 1 |  |
| Veto HV Monitor | 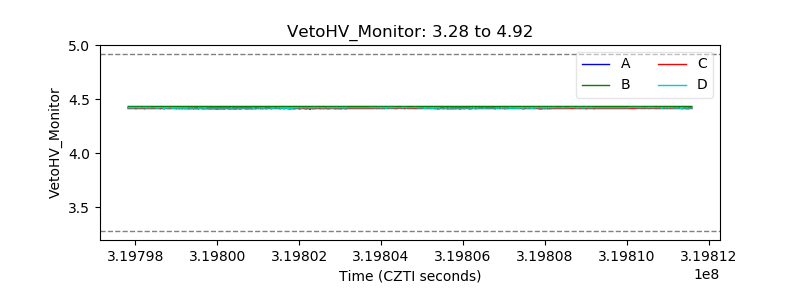 |
| Veto LLD | 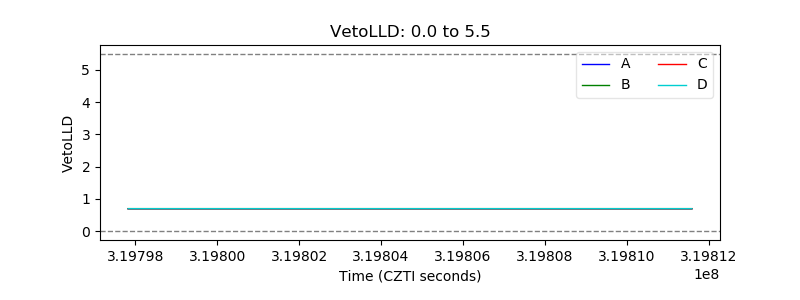 |
| Alpha Counter | 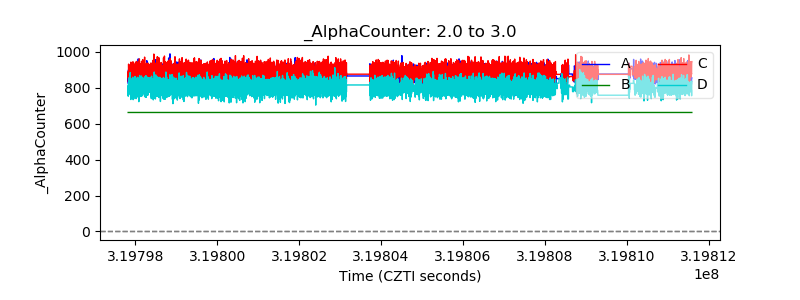 |
| _CPM_Rate | 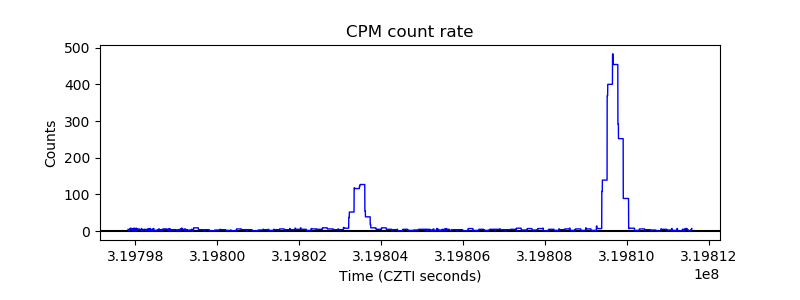 |
| CZT Counter | 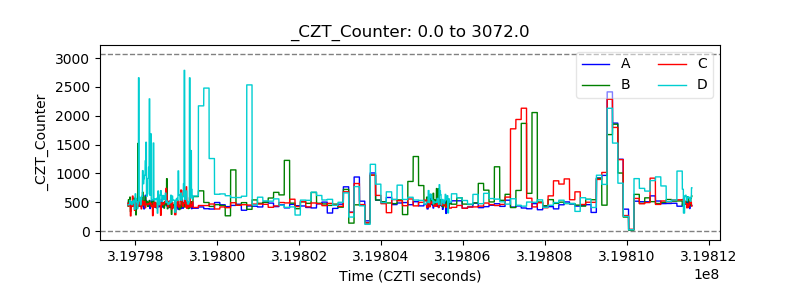 |
| +2.5 Volts monitor | 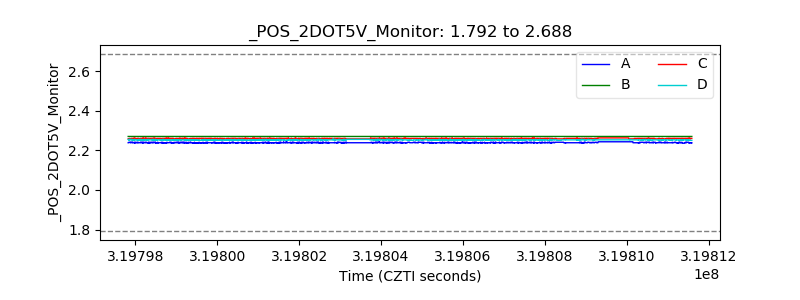 |
| +5 Volts monitor |  |
| _ROLL_ROT |  |
| _Roll_DEC | 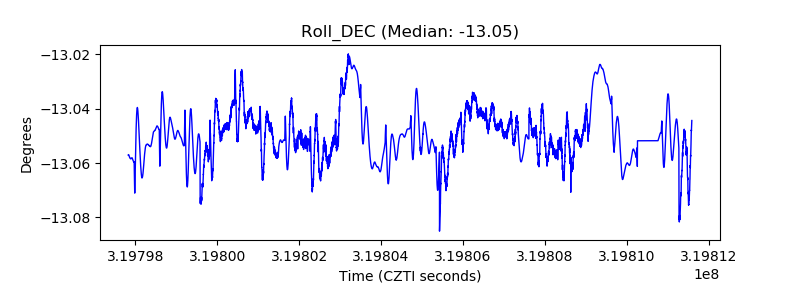 |
| _Roll_RA | 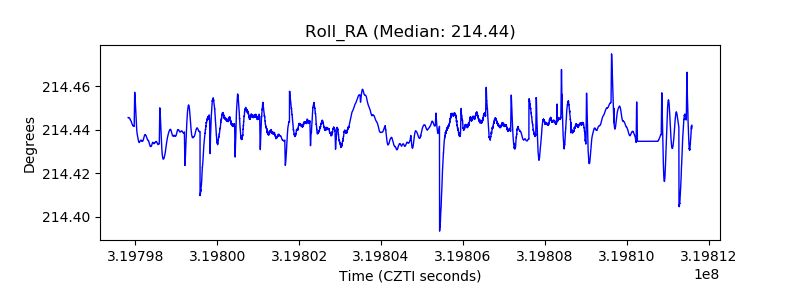 |
| Veto Counter | 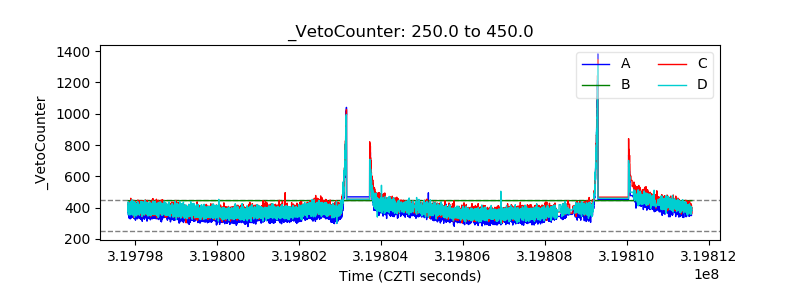 |