| Param | Original file | Final file |
|---|---|---|
| Filename | modeM0/AS1C05_007T01_9000003518_23762cztM0_level2.evt | modeM0/AS1C05_007T01_9000003518_23762cztM0_level2_quad_clean.evt |
| Size (bytes) | 1,287,915,840 | 183,389,760 |
| Size | 1.2 GB | 174.9 MB |
| Events in quadrant A | 8,022,158 | 1,110,075 |
| Events in quadrant B | 10,149,247 | 1,106,993 |
| Events in quadrant C | 8,883,927 | 1,088,594 |
| Events in quadrant D | 10,797,529 | 1,072,433 |
| Mode M9 | |||
|---|---|---|---|
| Quadrant | BADHDUFLAG | Total packets | Discarded packets |
| A | 0 | 22 | 0 |
| B | 0 | 22 | 0 |
| C | 0 | 22 | 0 |
| D | 0 | 22 | 0 |
| Mode SS | |||
|---|---|---|---|
| Quadrant | BADHDUFLAG | Total packets | Discarded packets |
| A | 0 | 348 | 0 |
| B | 0 | 348 | 0 |
| C | 0 | 348 | 0 |
| D | 0 | 348 | 0 |
| Mode M0 | |||
|---|---|---|---|
| Quadrant | BADHDUFLAG | Total packets | Discarded packets |
| A | 0 | 34935 | 3 |
| B | 0 | 40793 | 3 |
| C | 0 | 37142 | 3 |
| D | 0 | 43058 | 4 |
| Quadrant | Total seconds | Saturated seconds | Saturation percentage |
|---|---|---|---|
| A | 17045 | 208 | 1.220299% |
| B | 17045 | 787 | 4.617190% |
| C | 17046 | 420 | 2.463921% |
| D | 17045 | 443 | 2.599003% |
Noise dominated data is calculated using 1-second bins in cleaned event files. If a bin has >2000 counts, and if more than 50% of those come from <1% of pixels, then it is considered to be noise-dominated and hence unusable.
| Quadrant | # 1 sec bins | Bins with >0 counts | Bins with >2000 counts | High rate bins dominated by noise | Noise dominated (total time) | Noise dominated (detector-on time) | Marked lightcurve |
|---|---|---|---|---|---|---|---|
| A | 19315 | 17045 | 0 | 0 | 0.00% | 0.00% | 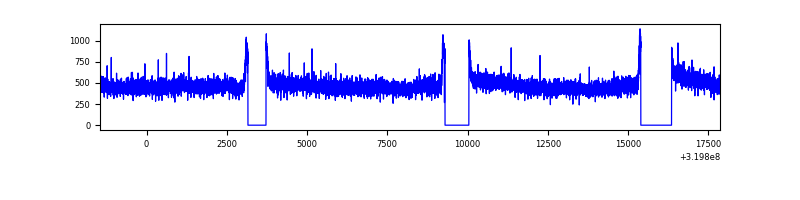 |
| B | 19315 | 17045 | 357 | 357 | 1.85% | 2.09% | 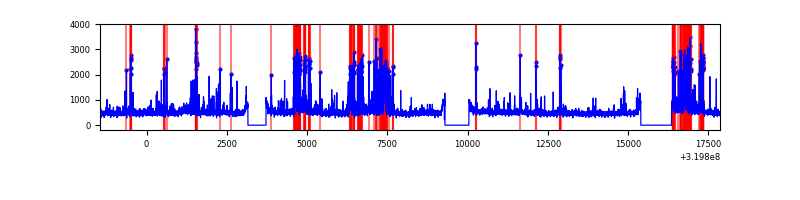 |
| C | 19316 | 17046 | 100 | 100 | 0.52% | 0.59% | 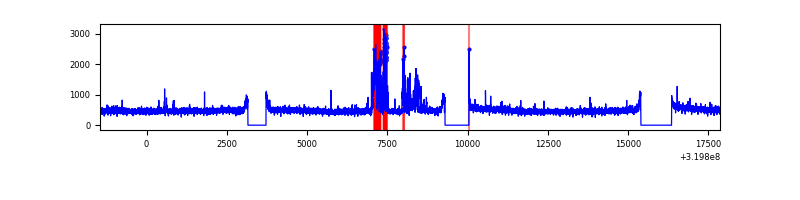 |
| D | 19315 | 17045 | 218 | 218 | 1.13% | 1.28% | 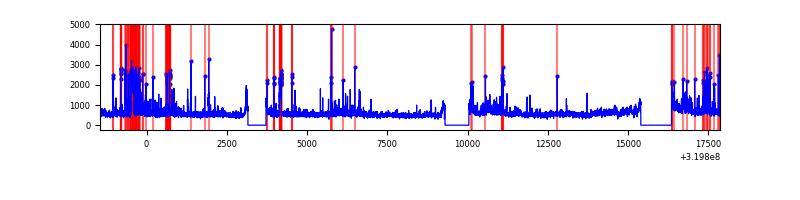 |
Top three noisy pixels from each quadrant. If the there are fewer than three noisy pixels in the level2.evt file, extra rows are filled as -1
| Pixel properties | Quadrant properties | ||||||
|---|---|---|---|---|---|---|---|
| Quadrant | DetID | PixID | Counts | Sigma | Mean | Median | Sigma |
| A | 13 | 254 | 29875 | 66.67 | 2077 | 2027 | 417.7 |
| A | 3 | 137 | 18731 | 39.99 | 2077 | 2027 | 417.7 |
| A | 0 | 226 | 17811 | 37.79 | 2077 | 2027 | 417.7 |
| B | 3 | 64 | 1850820 | 4752.13 | 2034 | 1980 | 389.1 |
| B | 0 | 229 | 117872 | 297.88 | 2034 | 1980 | 389.1 |
| B | 0 | 189 | 116725 | 294.93 | 2034 | 1980 | 389.1 |
| C | 10 | 9 | 693924 | 1472.03 | 2008 | 2023 | 470.0 |
| C | 14 | 238 | 315042 | 665.95 | 2008 | 2023 | 470.0 |
| C | 7 | 247 | 30346 | 60.26 | 2008 | 2023 | 470.0 |
| D | 8 | 195 | 1576245 | 3179.11 | 2026 | 1967 | 495.2 |
| D | 1 | 52 | 818925 | 1649.77 | 2026 | 1967 | 495.2 |
| D | 13 | 174 | 315985 | 634.13 | 2026 | 1967 | 495.2 |
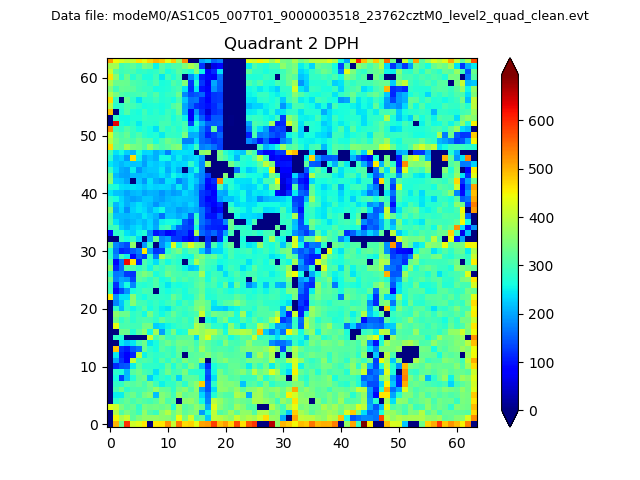
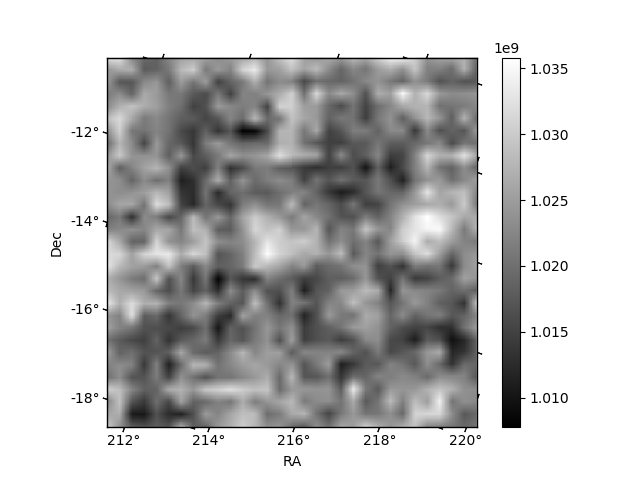
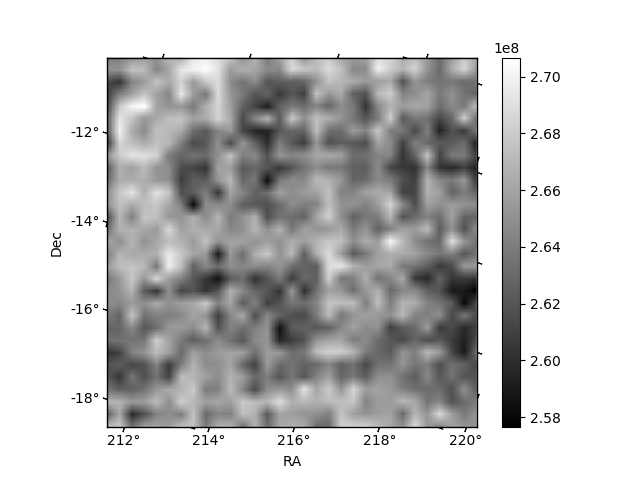
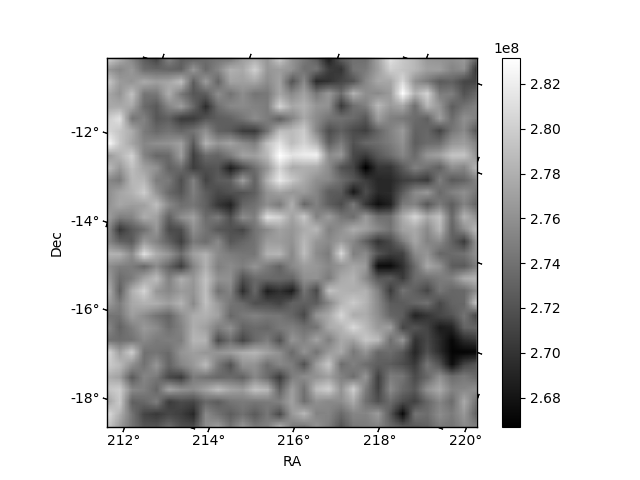
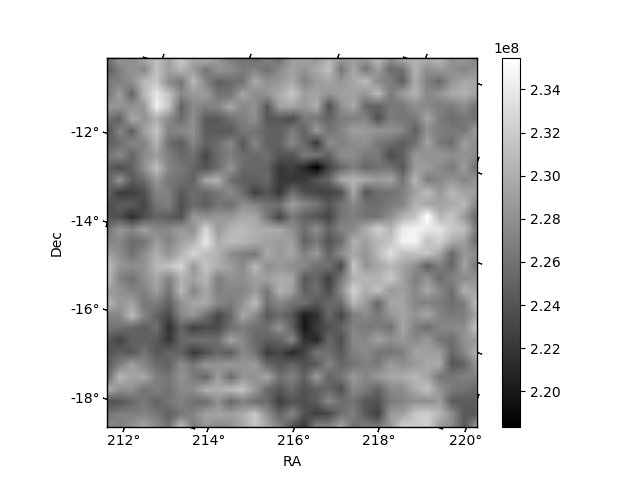
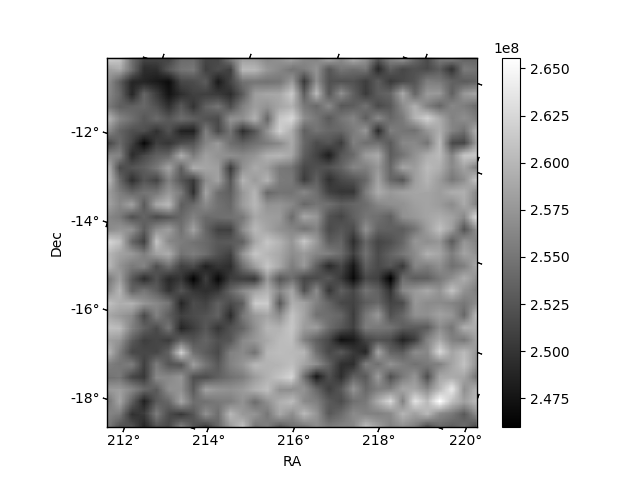
Histogram calculated using DETX and DETY for each event in the final _common_clean file
| Quadrant A | 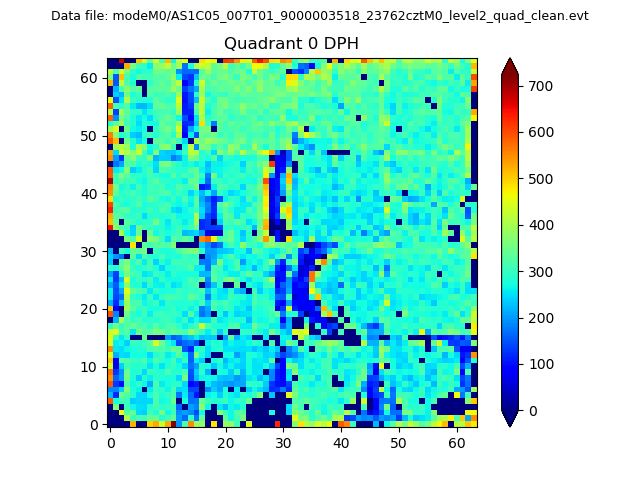 |
 |
Quadrant B |
|---|---|---|---|
| Quadrant D | 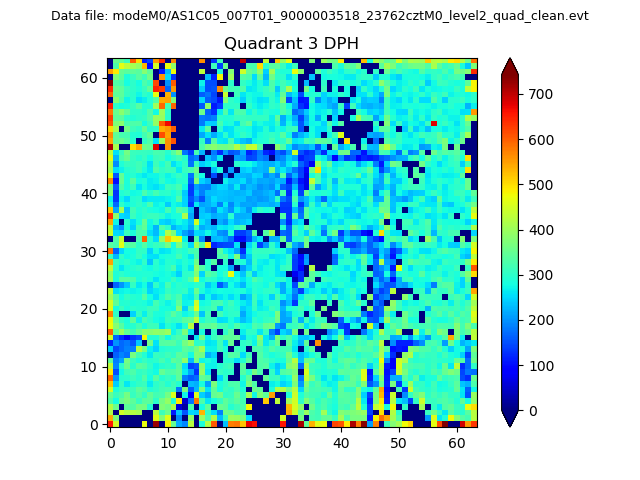 |
 |
Quadrant C |
| Plot type | Count rate plots | Images |
|---|---|---|
| Comparison with Poisson distribution Blue bars denote a histogram of data divided into 1 sec bins. Red curve is a Poisson curve with rate = median count rate of data. |
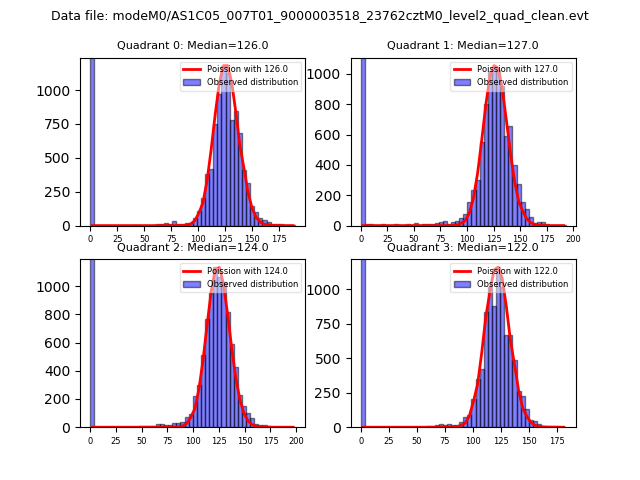 |
 |
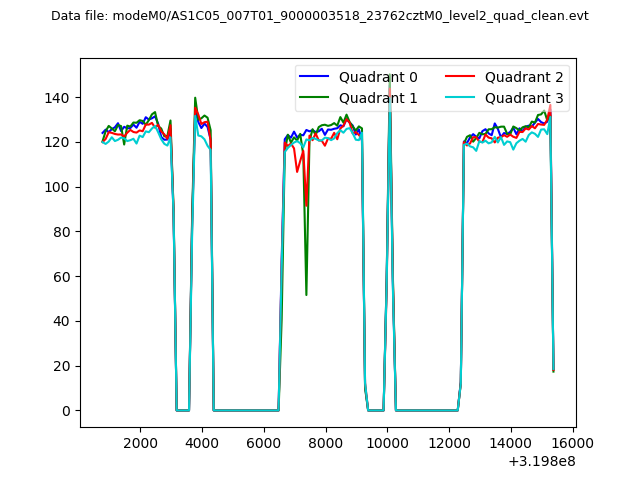
| Quadrant-wise count rates Data is divided into 100 sec bins |
 |
|
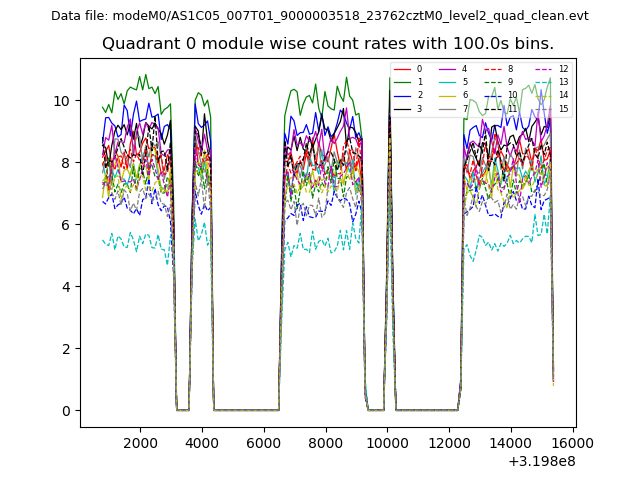
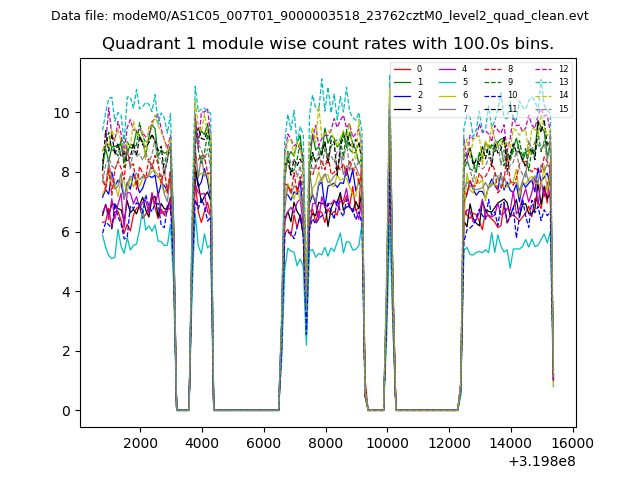
| Module-wise count rates for Quadrant A Data is divided into 100 sec bins |
 |
 |
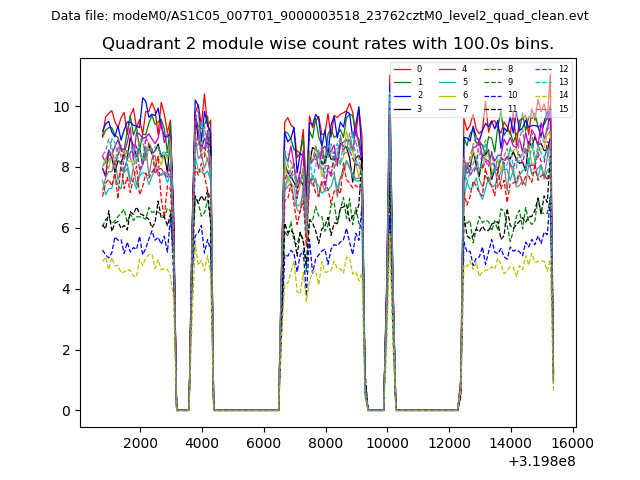
| Module-wise count rates for Quadrant B Data is divided into 100 sec bins |
 |
 |
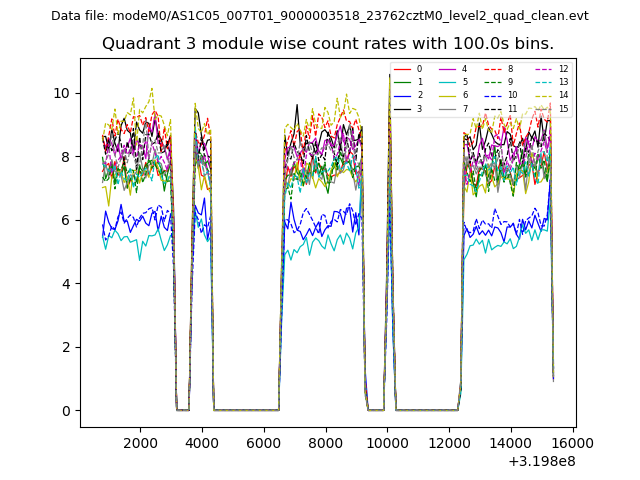
| Module-wise count rates for Quadrant C Data is divided into 100 sec bins |
 |
 |
| Module-wise count rates for Quadrant D Data is divided into 100 sec bins |
 |
 |
| Parameter | Plot |
|---|---|
| CZT HV Monitor | 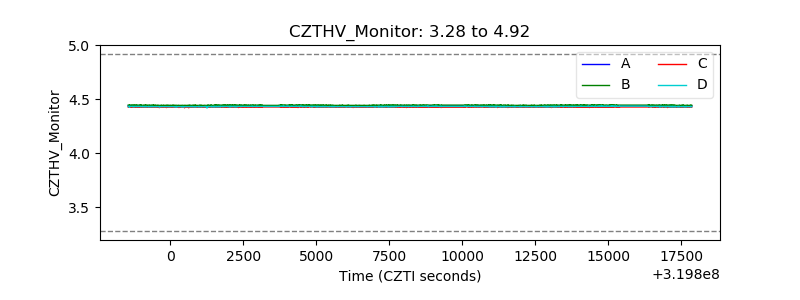 |
| D_VDD | 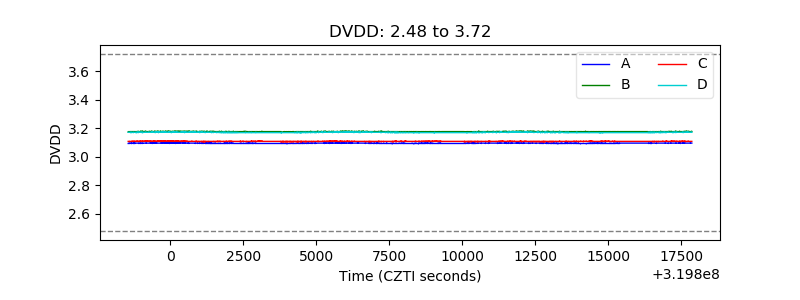 |
| Temperature 1 | 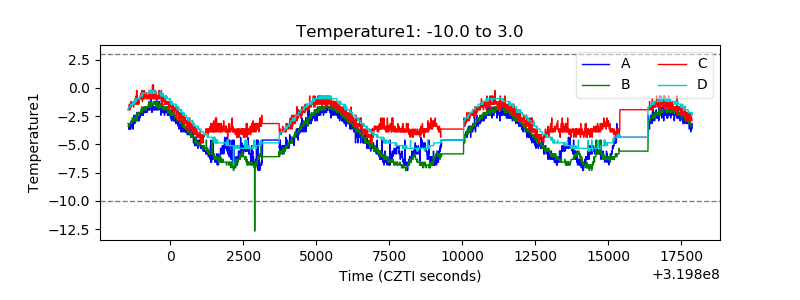 |
| Veto HV Monitor | 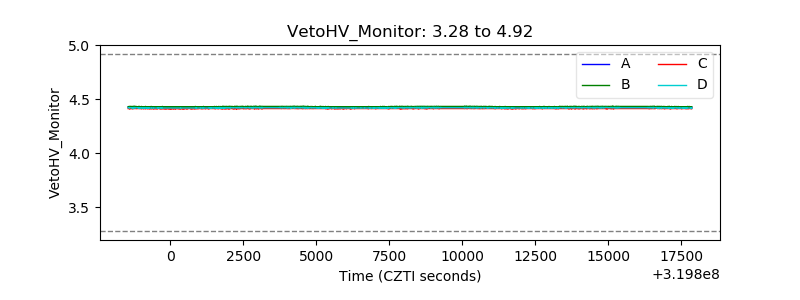 |
| Veto LLD | 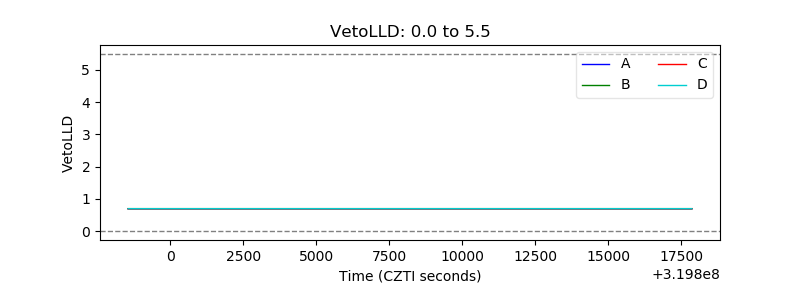 |
| Alpha Counter | 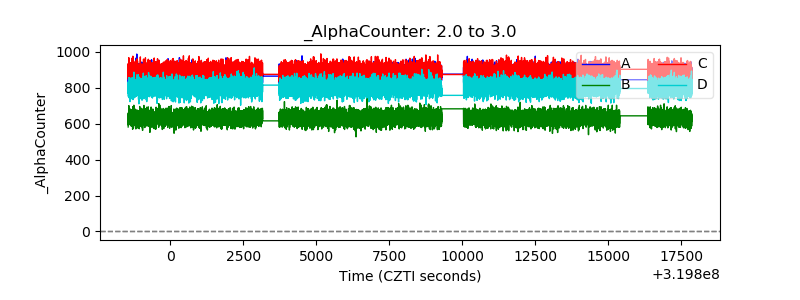 |
| _CPM_Rate |  |
| CZT Counter | 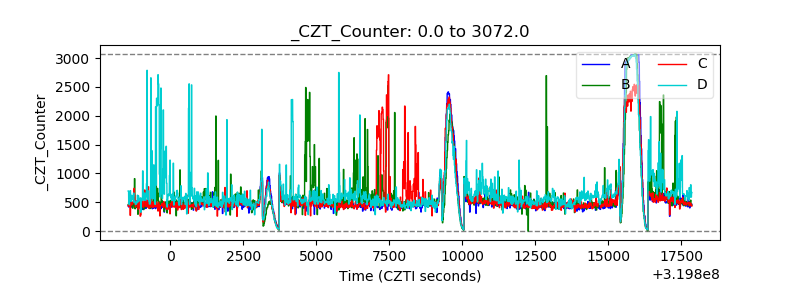 |
| +2.5 Volts monitor |  |
| +5 Volts monitor | 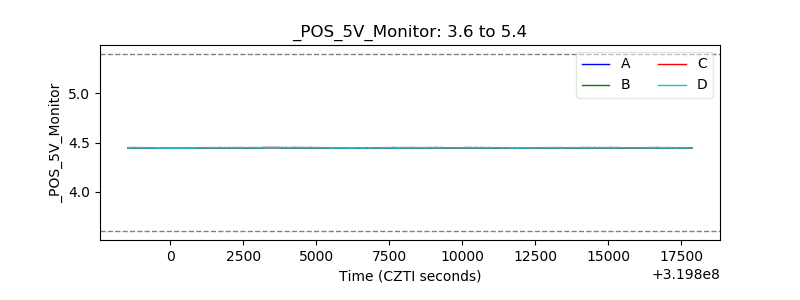 |
| _ROLL_ROT | 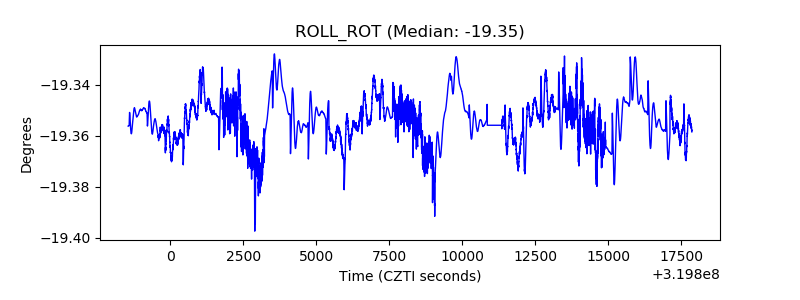 |
| _Roll_DEC |  |
| _Roll_RA | 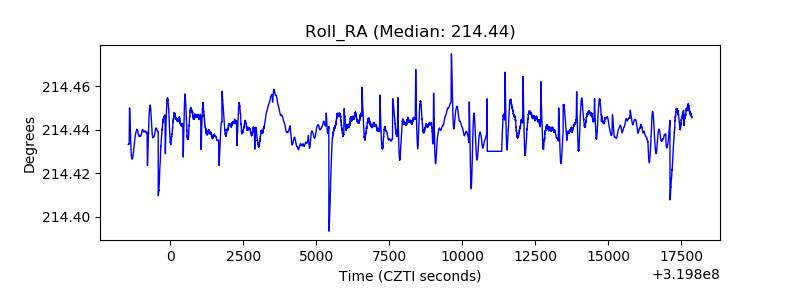 |
| Veto Counter | 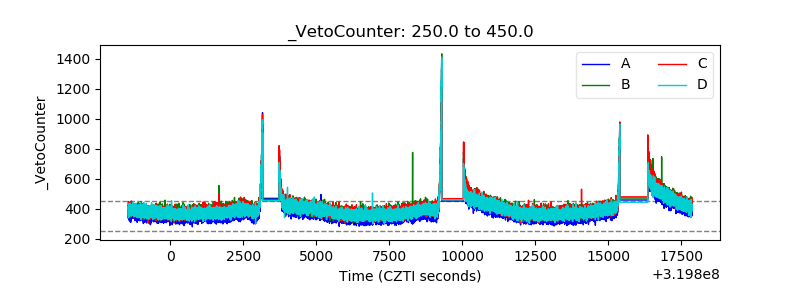 |