| Param | Original file | Final file |
|---|---|---|
| Filename | modeM0/AS1A07_091T10_9000003520cztM0_level2.fits | modeM0/AS1A07_091T10_9000003520cztM0_level2_quad_clean.evt |
| Size (bytes) | 143,084,160 | 125,752,320 |
| Size | 136.5 MB | 119.9 MB |
| Events in quadrant A | 902,202 | 749,104 |
| Events in quadrant B | 860,392 | 745,068 |
| Events in quadrant C | 897,004 | 732,810 |
| Events in quadrant D | 756,306 | 663,175 |
| Mode M9 | |||
|---|---|---|---|
| Quadrant | BADHDUFLAG | Total packets | Discarded packets |
| A | 0 | 36 | 0 |
| B | 0 | 36 | 0 |
| C | 0 | 36 | 0 |
| D | 0 | 36 | 0 |
| Mode M0 | |||
|---|---|---|---|
| Quadrant | BADHDUFLAG | Total packets | Discarded packets |
| A | 0 | 28713 | 0 |
| B | 0 | 32331 | 0 |
| C | 0 | 30166 | 0 |
| D | 0 | 44218 | 0 |
| Mode SS | |||
|---|---|---|---|
| Quadrant | BADHDUFLAG | Total packets | Discarded packets |
| A | 0 | 272 | 0 |
| B | 0 | 272 | 0 |
| C | 0 | 272 | 0 |
| D | 0 | 272 | 0 |
| Quadrant | Total seconds | Saturated seconds | Saturation percentage |
|---|---|---|---|
| A | 13278 | 135 | 1.016719% |
| B | 13278 | 423 | 3.185721% |
| C | 13278 | 299 | 2.251845% |
| D | 13278 | 689 | 5.189034% |
Noise dominated data is calculated using 1-second bins in cleaned event files. If a bin has >2000 counts, and if more than 50% of those come from <1% of pixels, then it is considered to be noise-dominated and hence unusable.
| Quadrant | # 1 sec bins | Bins with >0 counts | Bins with >2000 counts | High rate bins dominated by noise | Noise dominated (total time) | Noise dominated (detector-on time) | Marked lightcurve |
|---|---|---|---|---|---|---|---|
| A | 16908 | 13275 | 0 | 0 | 0.00% | 0.00% |  |
| B | 16908 | 13272 | 0 | 0 | 0.00% | 0.00% |  |
| C | 16908 | 13275 | 0 | 0 | 0.00% | 0.00% |  |
| D | 16908 | 13219 | 0 | 0 | 0.00% | 0.00% |  |
Top three noisy pixels from each quadrant. If the there are fewer than three noisy pixels in the level2.evt file, extra rows are filled as -1
| Pixel properties | Quadrant properties | ||||||
|---|---|---|---|---|---|---|---|
| Quadrant | DetID | PixID | Counts | Sigma | Mean | Median | Sigma |
| A | 0 | 29 | 845 | 10.42 | 235 | 222 | 59.8 |
| A | 7 | 110 | 707 | 8.11 | 235 | 222 | 59.8 |
| A | 9 | 19 | 684 | 7.72 | 235 | 222 | 59.8 |
| B | 2 | 9 | 670 | 9.53 | 227 | 217 | 47.5 |
| B | 5 | 225 | 588 | 7.81 | 227 | 217 | 47.5 |
| B | 2 | 8 | 579 | 7.62 | 227 | 217 | 47.5 |
| C | 1 | 81 | 675 | 7.4 | 236 | 223 | 61.1 |
| C | 1 | 80 | 666 | 7.25 | 236 | 223 | 61.1 |
| C | 9 | 233 | 599 | 6.15 | 236 | 223 | 61.1 |
| D | 10 | 189 | 564 | 6.37 | 216 | 198 | 57.5 |
| D | 6 | 231 | 563 | 6.35 | 216 | 198 | 57.5 |
| D | 15 | 46 | 516 | 5.53 | 216 | 198 | 57.5 |
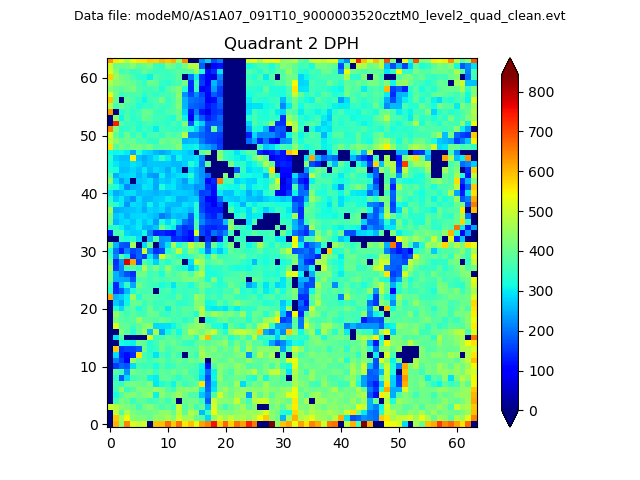
Histogram calculated using DETX and DETY for each event in the final _common_clean file
| Quadrant A |  |
 |
Quadrant B |
|---|---|---|---|
| Quadrant D |  |
 |
Quadrant C |
| Plot type | Count rate plots | Images |
|---|---|---|
| Comparison with Poisson distribution Blue bars denote a histogram of data divided into 1 sec bins. Red curve is a Poisson curve with rate = median count rate of data. |
 |
 |
| Quadrant-wise count rates Data is divided into 100 sec bins |
 |
|
| Module-wise count rates for Quadrant A Data is divided into 100 sec bins |
 |
 |
| Module-wise count rates for Quadrant B Data is divided into 100 sec bins |
 |
 |
| Module-wise count rates for Quadrant C Data is divided into 100 sec bins |
 |
 |
| Module-wise count rates for Quadrant D Data is divided into 100 sec bins |
 |
 |
| Parameter | Plot |
|---|---|
| CZT HV Monitor |  |
| D_VDD |  |
| Temperature 1 |  |
| Veto HV Monitor |  |
| Veto LLD |  |
| Alpha Counter |  |
| _CPM_Rate |  |
| CZT Counter |  |
| +2.5 Volts monitor |  |
| +5 Volts monitor |  |
| _ROLL_ROT |  |
| _Roll_DEC |  |
| _Roll_RA |  |
| Veto Counter |  |