| Param | Original file | Final file |
|---|---|---|
| Filename | modeM0/AS1A07_091T10_9000003520_23763cztM0_level2.evt | modeM0/AS1A07_091T10_9000003520_23763cztM0_level2_quad_clean.evt |
| Size (bytes) | 295,966,080 | 39,061,440 |
| Size | 282.3 MB | 37.3 MB |
| Events in quadrant A | 1,630,925 | 244,819 |
| Events in quadrant B | 2,214,724 | 239,912 |
| Events in quadrant C | 1,787,693 | 241,096 |
| Events in quadrant D | 3,115,393 | 233,096 |
| Mode M9 | |||
|---|---|---|---|
| Quadrant | BADHDUFLAG | Total packets | Discarded packets |
| A | 0 | 11 | 0 |
| B | 0 | 11 | 0 |
| C | 0 | 11 | 0 |
| D | 0 | 11 | 0 |
| Mode M0 | |||
|---|---|---|---|
| Quadrant | BADHDUFLAG | Total packets | Discarded packets |
| A | 0 | 6929 | 1 |
| B | 0 | 8762 | 1 |
| C | 0 | 7490 | 2 |
| D | 0 | 11606 | 1 |
| Mode SS | |||
|---|---|---|---|
| Quadrant | BADHDUFLAG | Total packets | Discarded packets |
| A | 0 | 66 | 0 |
| B | 0 | 66 | 0 |
| C | 0 | 66 | 0 |
| D | 0 | 66 | 0 |
| Quadrant | Total seconds | Saturated seconds | Saturation percentage |
|---|---|---|---|
| A | 3139 | 44 | 1.401720% |
| B | 3139 | 182 | 5.798025% |
| C | 3138 | 101 | 3.218611% |
| D | 3138 | 411 | 13.097514% |
Noise dominated data is calculated using 1-second bins in cleaned event files. If a bin has >2000 counts, and if more than 50% of those come from <1% of pixels, then it is considered to be noise-dominated and hence unusable.
| Quadrant | # 1 sec bins | Bins with >0 counts | Bins with >2000 counts | High rate bins dominated by noise | Noise dominated (total time) | Noise dominated (detector-on time) | Marked lightcurve |
|---|---|---|---|---|---|---|---|
| A | 4249 | 3139 | 0 | 0 | 0.00% | 0.00% | 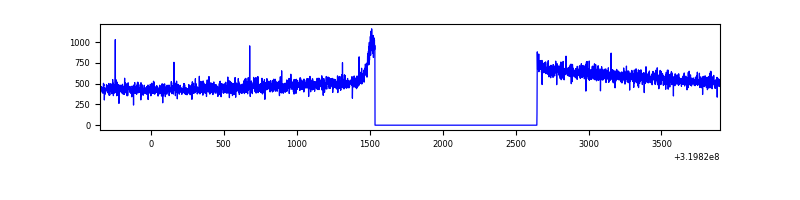 |
| B | 4249 | 3139 | 109 | 109 | 2.57% | 3.47% | 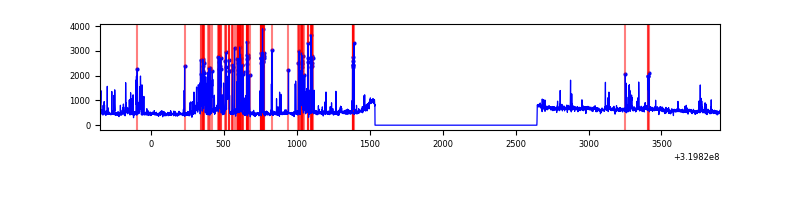 |
| C | 4248 | 3138 | 2 | 2 | 0.05% | 0.06% | 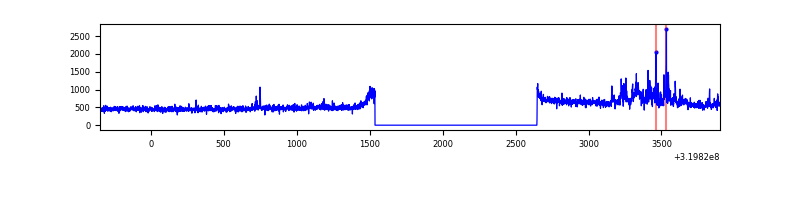 |
| D | 4248 | 3138 | 318 | 318 | 7.49% | 10.13% | 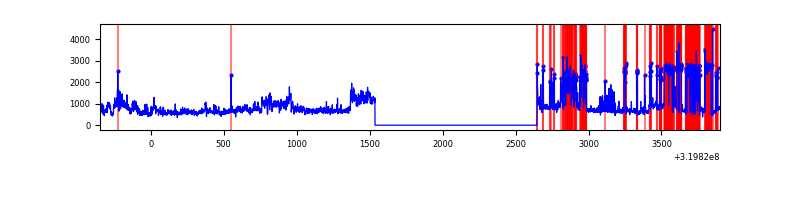 |
Top three noisy pixels from each quadrant. If the there are fewer than three noisy pixels in the level2.evt file, extra rows are filled as -1
| Pixel properties | Quadrant properties | ||||||
|---|---|---|---|---|---|---|---|
| Quadrant | DetID | PixID | Counts | Sigma | Mean | Median | Sigma |
| A | 13 | 254 | 5432 | 58.48 | 422 | 415 | 85.8 |
| A | 0 | 226 | 3654 | 37.76 | 422 | 415 | 85.8 |
| A | 3 | 137 | 3572 | 36.8 | 422 | 415 | 85.8 |
| B | 3 | 64 | 539627 | 6809.22 | 412 | 402 | 79.2 |
| B | 0 | 229 | 36448 | 455.18 | 412 | 402 | 79.2 |
| B | 0 | 189 | 15611 | 192.06 | 412 | 402 | 79.2 |
| C | 7 | 247 | 132134 | 1367.16 | 407 | 410 | 96.3 |
| C | 14 | 238 | 64858 | 668.91 | 407 | 410 | 96.3 |
| C | 0 | 10 | 4626 | 43.76 | 407 | 410 | 96.3 |
| D | 1 | 52 | 1081468 | 11718.48 | 381 | 371 | 92.3 |
| D | 7 | 238 | 300252 | 3250.54 | 381 | 371 | 92.3 |
| D | 8 | 195 | 221424 | 2396.09 | 381 | 371 | 92.3 |
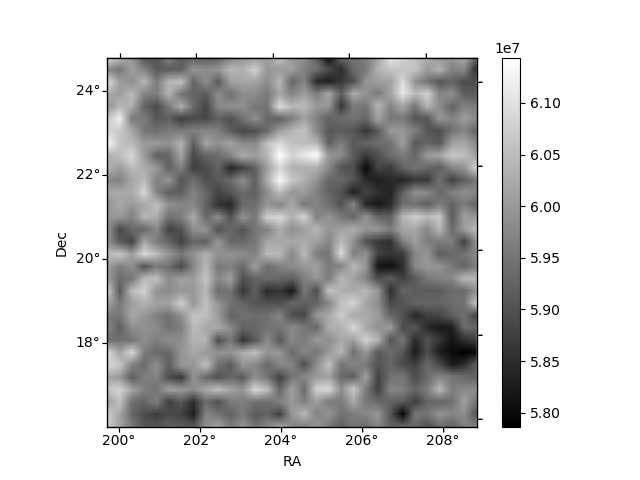
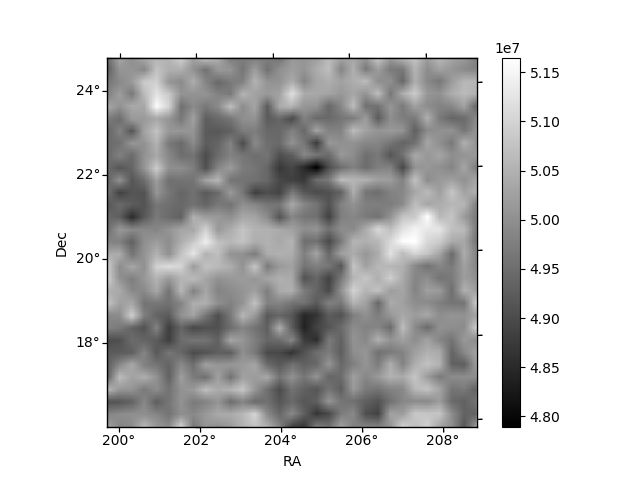
Histogram calculated using DETX and DETY for each event in the final _common_clean file
| Quadrant A | 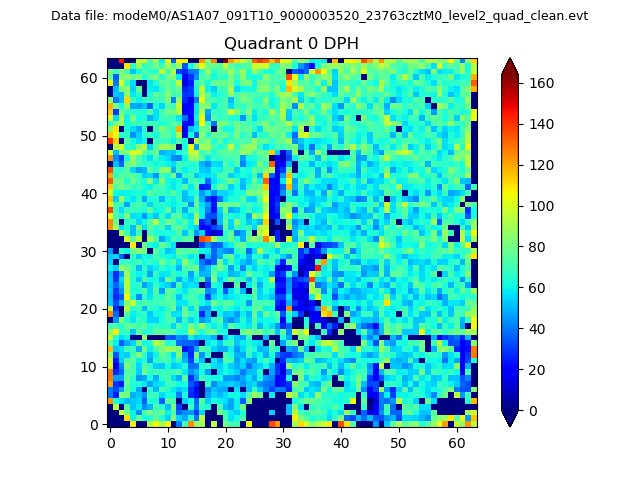 |
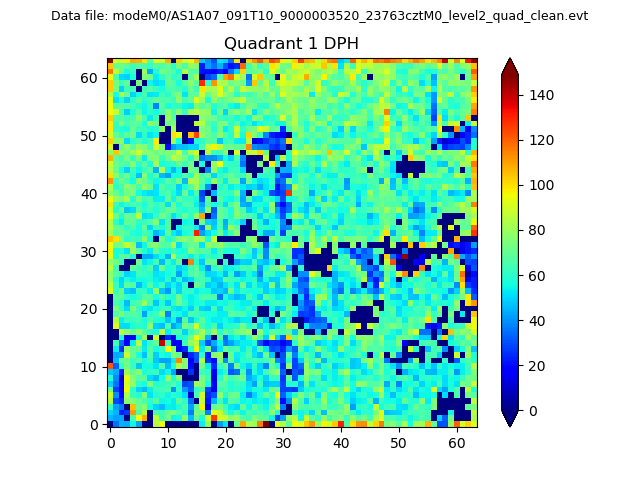 |
Quadrant B |
|---|---|---|---|
| Quadrant D | 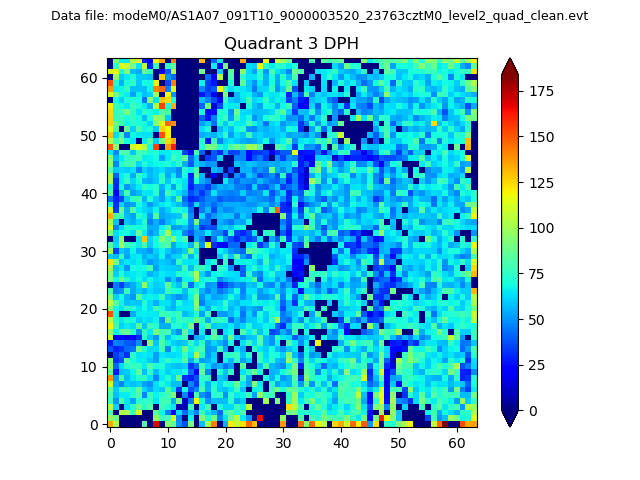 |
 |
Quadrant C |
| Plot type | Count rate plots | Images |
|---|---|---|
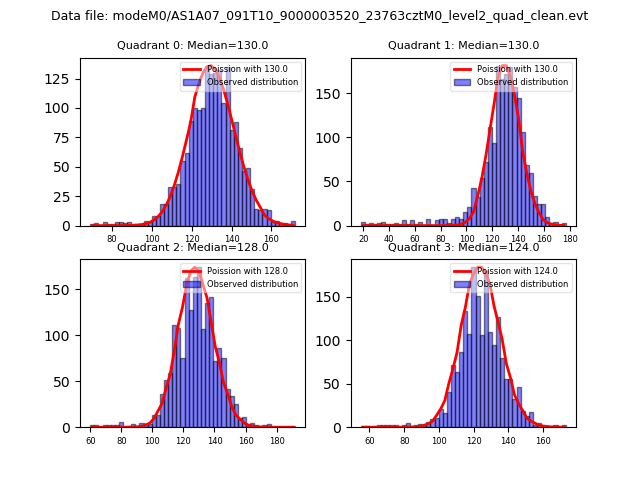
| Comparison with Poisson distribution Blue bars denote a histogram of data divided into 1 sec bins. Red curve is a Poisson curve with rate = median count rate of data. |
 |
 |
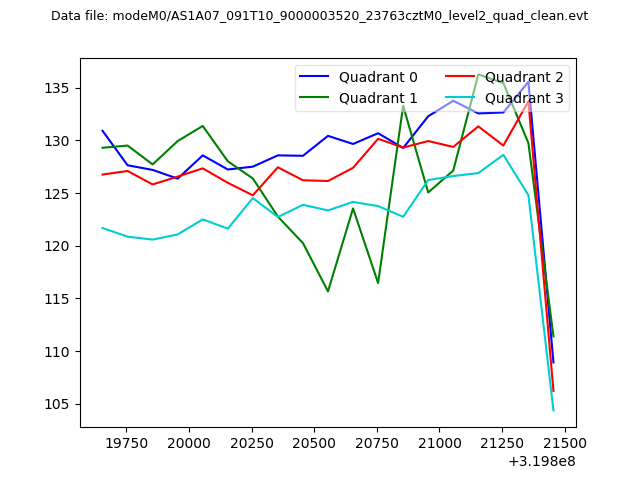
| Quadrant-wise count rates Data is divided into 100 sec bins |
 |
|
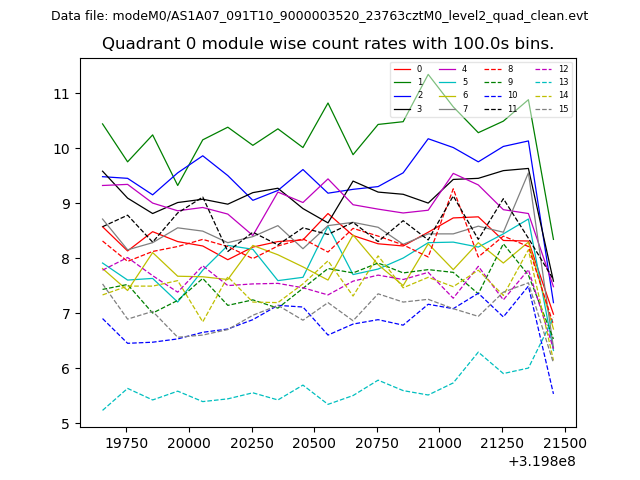
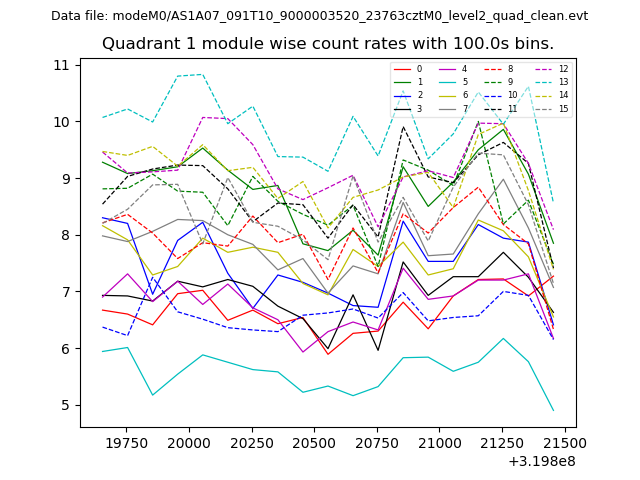
| Module-wise count rates for Quadrant A Data is divided into 100 sec bins |
 |
 |
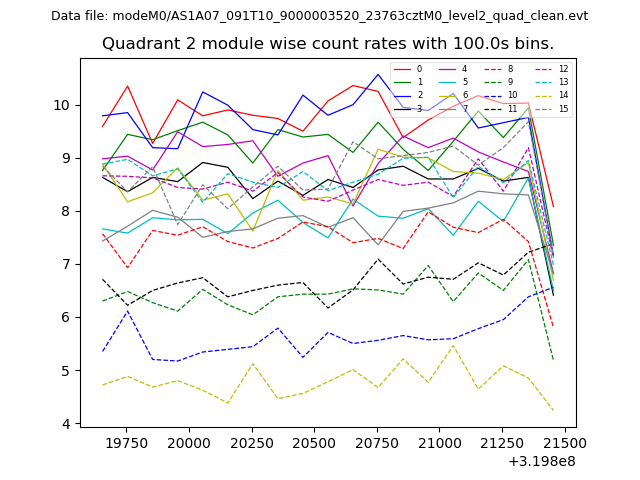
| Module-wise count rates for Quadrant B Data is divided into 100 sec bins |
 |
 |
| Module-wise count rates for Quadrant C Data is divided into 100 sec bins |
 |
 |
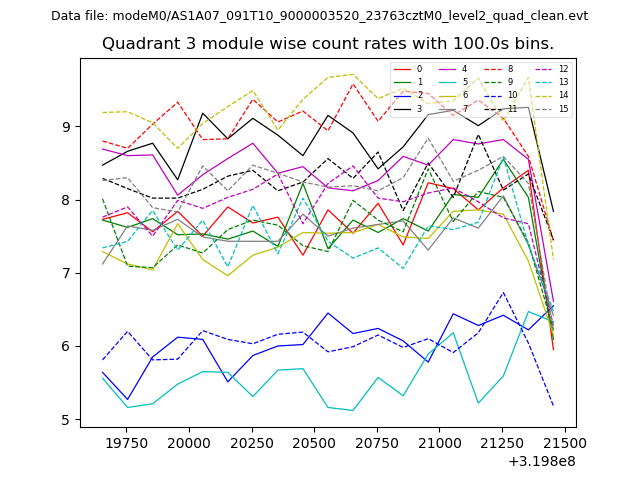
| Module-wise count rates for Quadrant D Data is divided into 100 sec bins |
 |
 |
| Parameter | Plot |
|---|---|
| CZT HV Monitor | 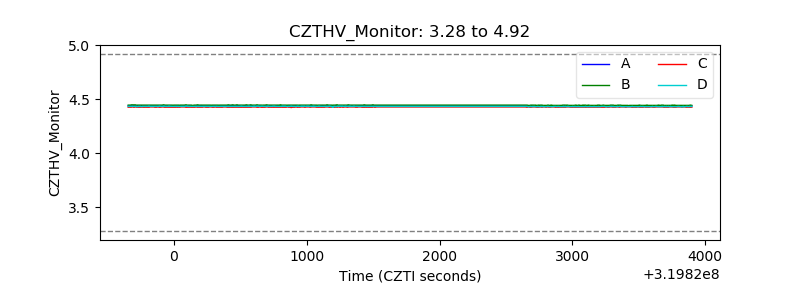 |
| D_VDD | 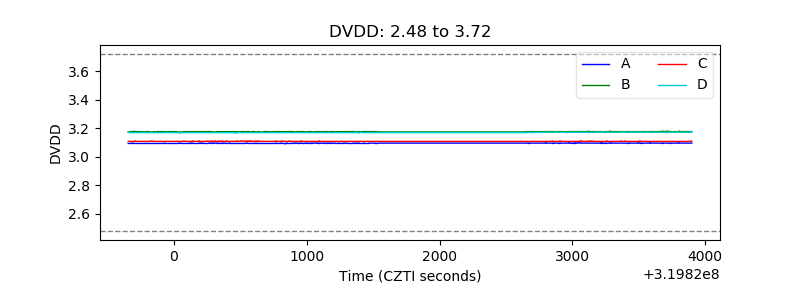 |
| Temperature 1 | 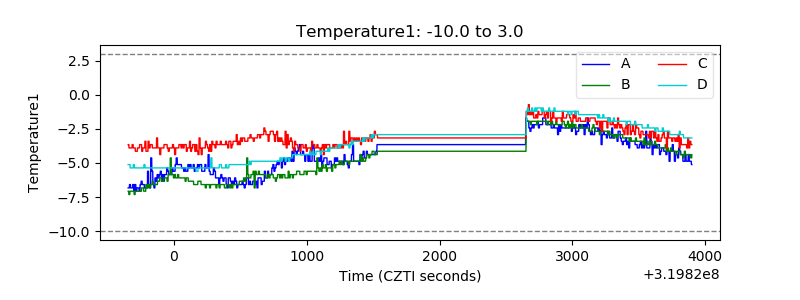 |
| Veto HV Monitor | 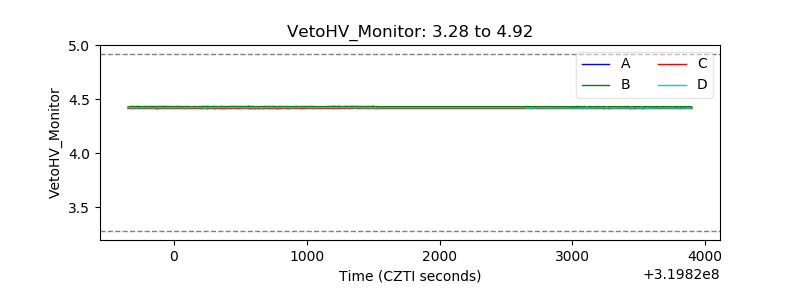 |
| Veto LLD | 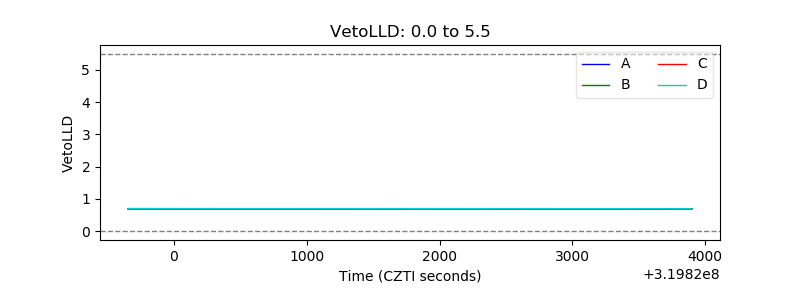 |
| Alpha Counter | 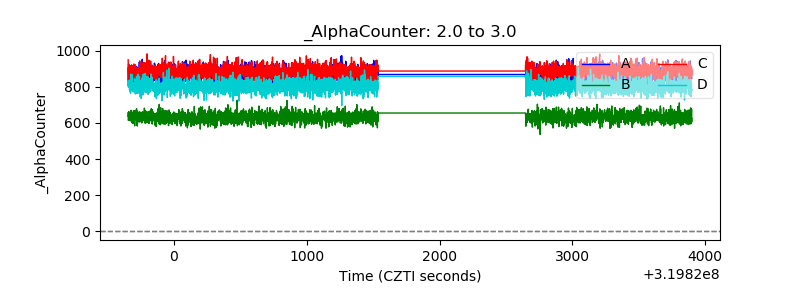 |
| _CPM_Rate | 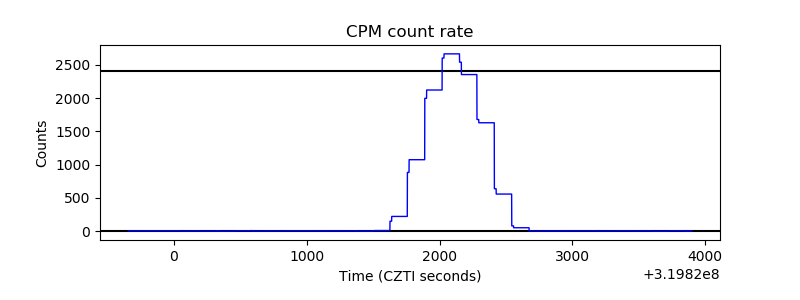 |
| CZT Counter | 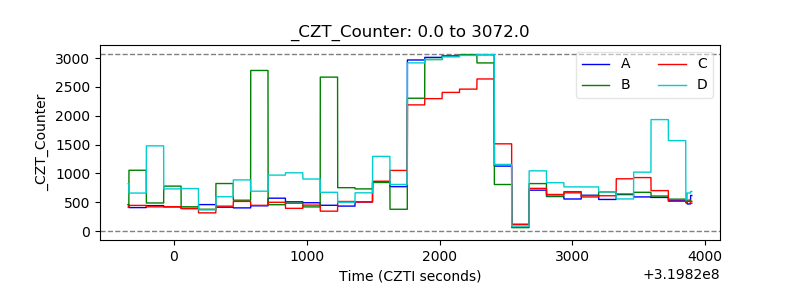 |
| +2.5 Volts monitor |  |
| +5 Volts monitor | 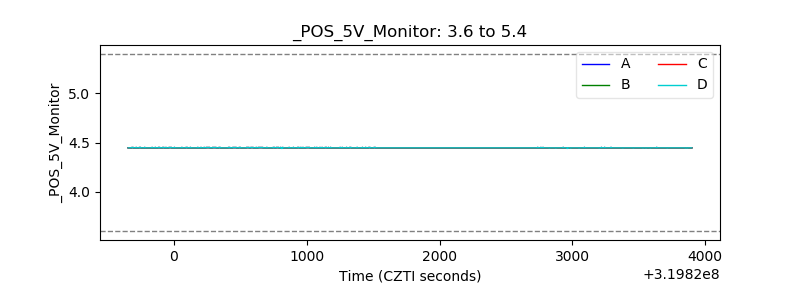 |
| _ROLL_ROT | 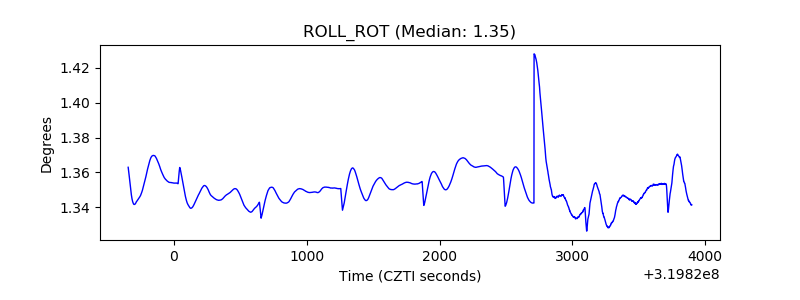 |
| _Roll_DEC |  |
| _Roll_RA | 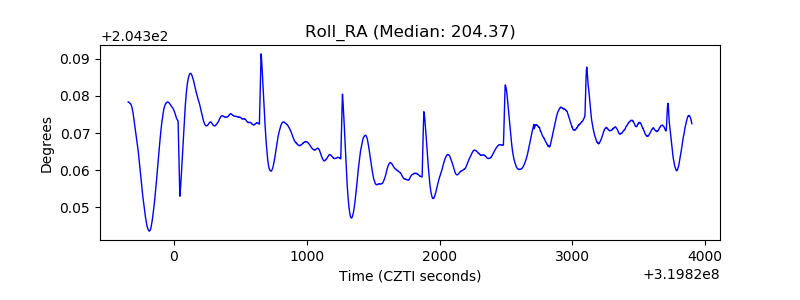 |
| Veto Counter | 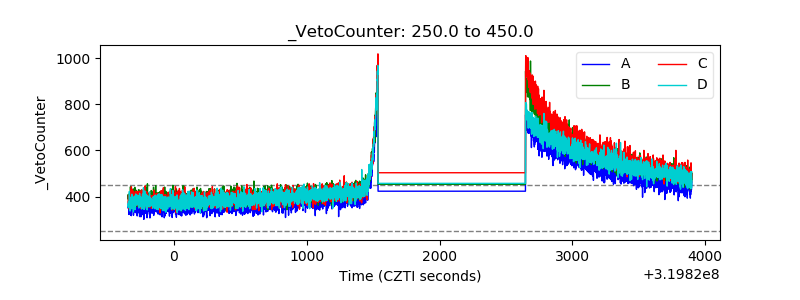 |