| Param | Original file | Final file |
|---|---|---|
| Filename | modeM0/AS1A07_091T10_9000003520_23765cztM0_level2.evt | modeM0/AS1A07_091T10_9000003520_23765cztM0_level2_quad_clean.evt |
| Size (bytes) | 547,525,440 | 84,997,440 |
| Size | 522.2 MB | 81.1 MB |
| Events in quadrant A | 3,284,011 | 535,578 |
| Events in quadrant B | 3,519,756 | 549,722 |
| Events in quadrant C | 3,644,225 | 532,954 |
| Events in quadrant D | 5,704,439 | 513,373 |
| Mode M9 | |||
|---|---|---|---|
| Quadrant | BADHDUFLAG | Total packets | Discarded packets |
| A | 0 | 18 | 0 |
| B | 0 | 19 | 0 |
| C | 0 | 19 | 0 |
| D | 0 | 19 | 0 |
| Mode M0 | |||
|---|---|---|---|
| Quadrant | BADHDUFLAG | Total packets | Discarded packets |
| A | 0 | 13964 | 2 |
| B | 0 | 14760 | 2 |
| C | 0 | 15077 | 2 |
| D | 0 | 21501 | 3 |
| Mode SS | |||
|---|---|---|---|
| Quadrant | BADHDUFLAG | Total packets | Discarded packets |
| A | 0 | 130 | 0 |
| B | 0 | 130 | 0 |
| C | 0 | 130 | 0 |
| D | 0 | 130 | 0 |
| Quadrant | Total seconds | Saturated seconds | Saturation percentage |
|---|---|---|---|
| A | 6335 | 57 | 0.899763% |
| B | 6335 | 96 | 1.515391% |
| C | 6335 | 154 | 2.430939% |
| D | 6334 | 473 | 7.467635% |
Noise dominated data is calculated using 1-second bins in cleaned event files. If a bin has >2000 counts, and if more than 50% of those come from <1% of pixels, then it is considered to be noise-dominated and hence unusable.
| Quadrant | # 1 sec bins | Bins with >0 counts | Bins with >2000 counts | High rate bins dominated by noise | Noise dominated (total time) | Noise dominated (detector-on time) | Marked lightcurve |
|---|---|---|---|---|---|---|---|
| A | 7555 | 6335 | 0 | 0 | 0.00% | 0.00% | 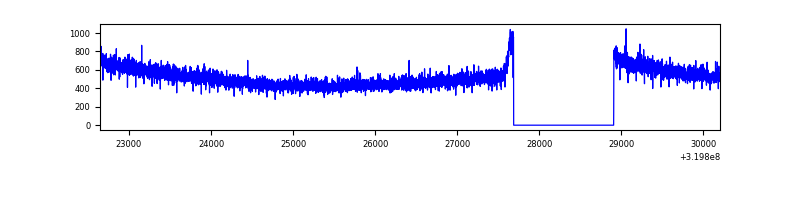 |
| B | 7555 | 6335 | 7 | 7 | 0.09% | 0.11% | 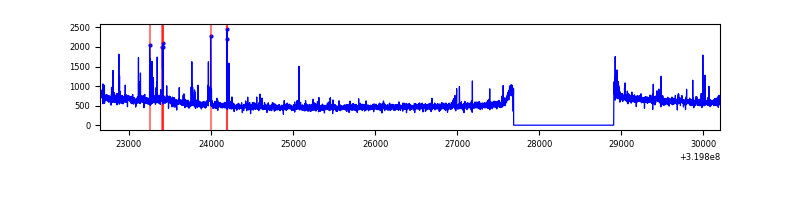 |
| C | 7555 | 6335 | 11 | 11 | 0.15% | 0.17% | 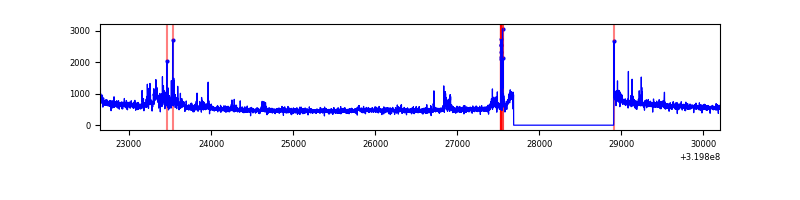 |
| D | 7554 | 6334 | 371 | 371 | 4.91% | 5.86% | 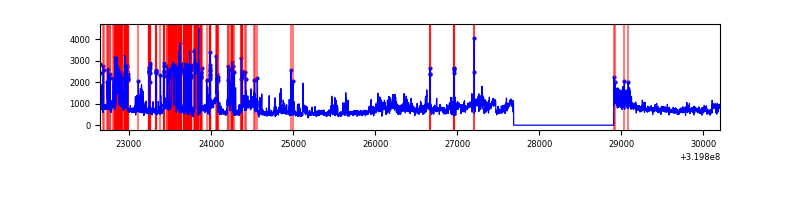 |
Top three noisy pixels from each quadrant. If the there are fewer than three noisy pixels in the level2.evt file, extra rows are filled as -1
| Pixel properties | Quadrant properties | ||||||
|---|---|---|---|---|---|---|---|
| Quadrant | DetID | PixID | Counts | Sigma | Mean | Median | Sigma |
| A | 13 | 254 | 10889 | 59.63 | 851 | 836 | 168.6 |
| A | 0 | 226 | 7516 | 39.62 | 851 | 836 | 168.6 |
| A | 3 | 137 | 7103 | 37.17 | 851 | 836 | 168.6 |
| B | 3 | 64 | 117568 | 731.05 | 851 | 833 | 159.7 |
| B | 0 | 229 | 57950 | 357.69 | 851 | 833 | 159.7 |
| B | 12 | 111 | 19021 | 113.9 | 851 | 833 | 159.7 |
| C | 7 | 247 | 251465 | 1287.83 | 832 | 838 | 194.6 |
| C | 14 | 238 | 134263 | 685.6 | 832 | 838 | 194.6 |
| C | 0 | 10 | 16697 | 81.49 | 832 | 838 | 194.6 |
| D | 1 | 52 | 1528928 | 7999.38 | 807 | 785 | 191.0 |
| D | 8 | 195 | 597007 | 3121.04 | 807 | 785 | 191.0 |
| D | 13 | 174 | 318362 | 1662.42 | 807 | 785 | 191.0 |
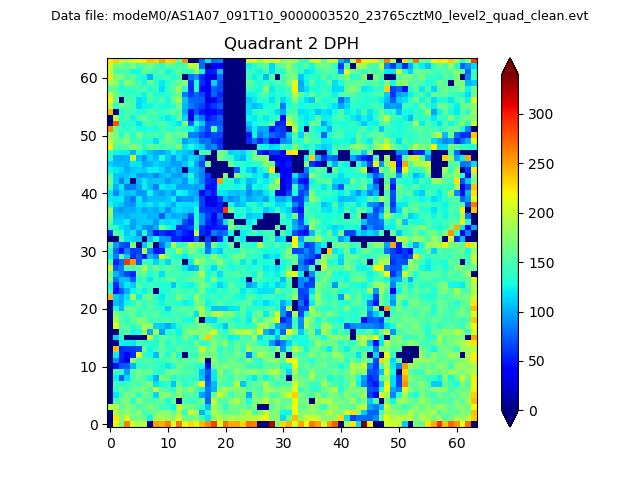
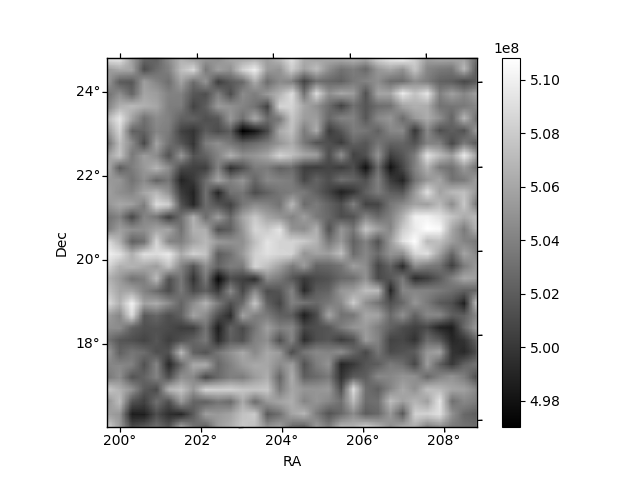
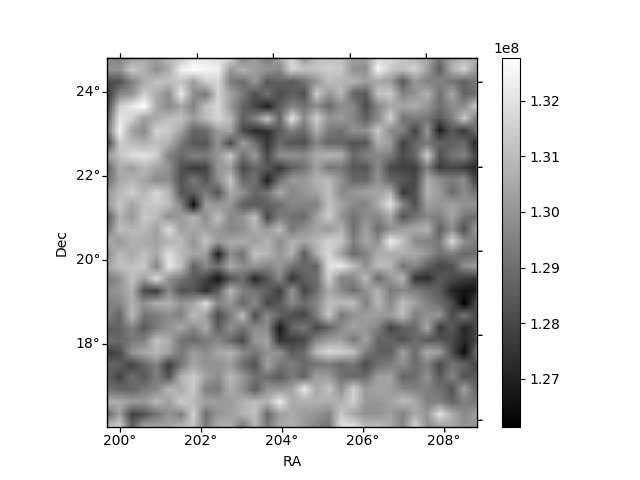
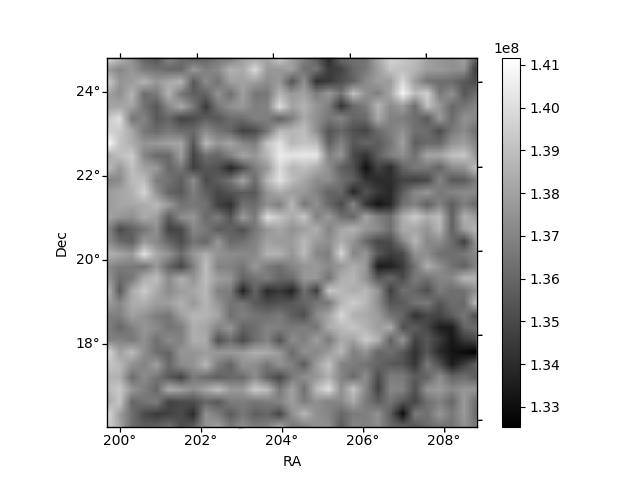
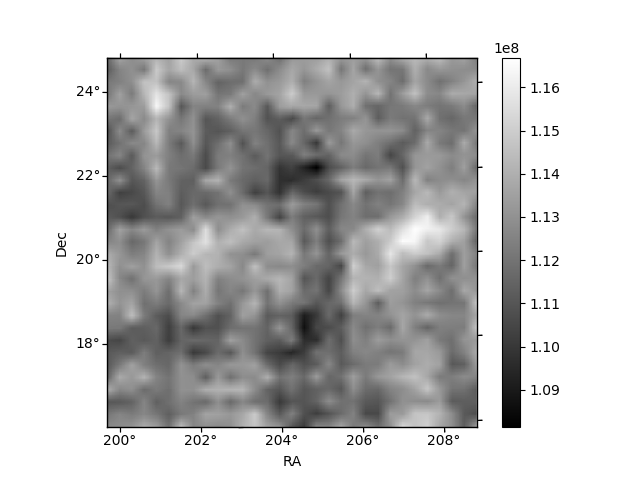
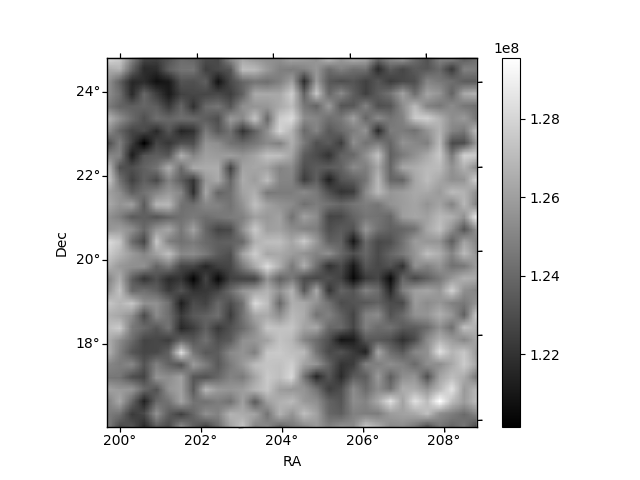
Histogram calculated using DETX and DETY for each event in the final _common_clean file
| Quadrant A | 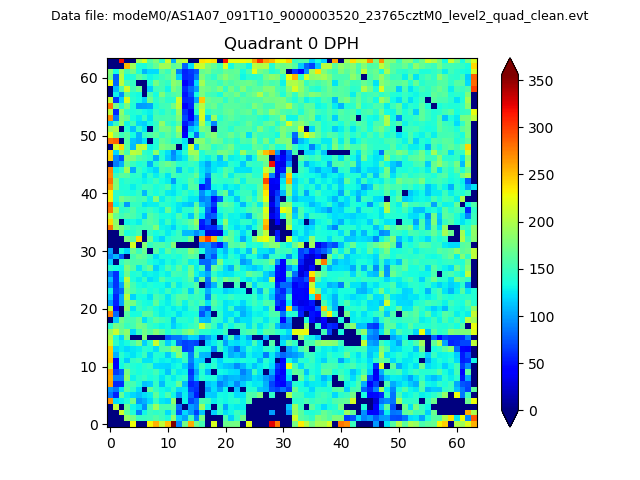 |
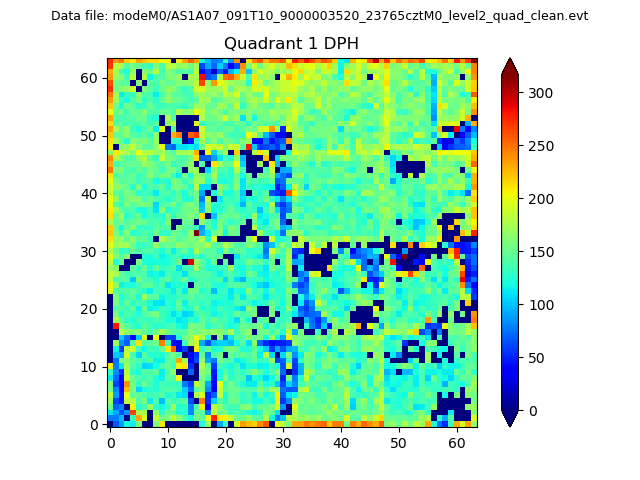 |
Quadrant B |
|---|---|---|---|
| Quadrant D | 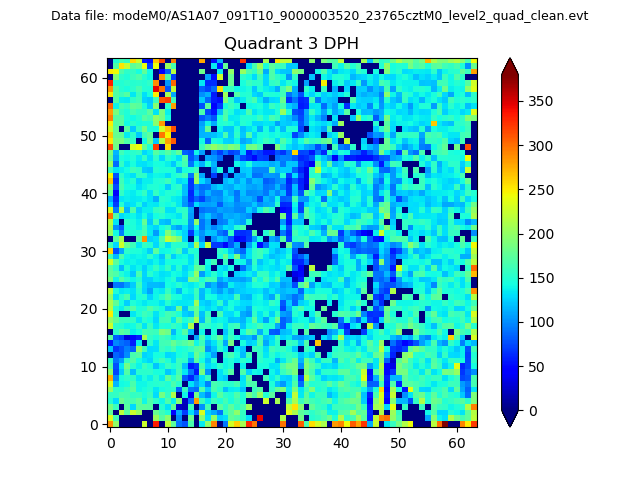 |
 |
Quadrant C |
| Plot type | Count rate plots | Images |
|---|---|---|
| Comparison with Poisson distribution Blue bars denote a histogram of data divided into 1 sec bins. Red curve is a Poisson curve with rate = median count rate of data. |
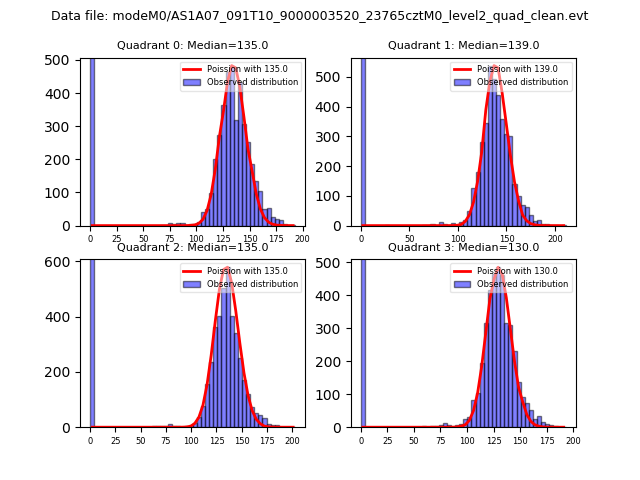 |
 |
| Quadrant-wise count rates Data is divided into 100 sec bins |
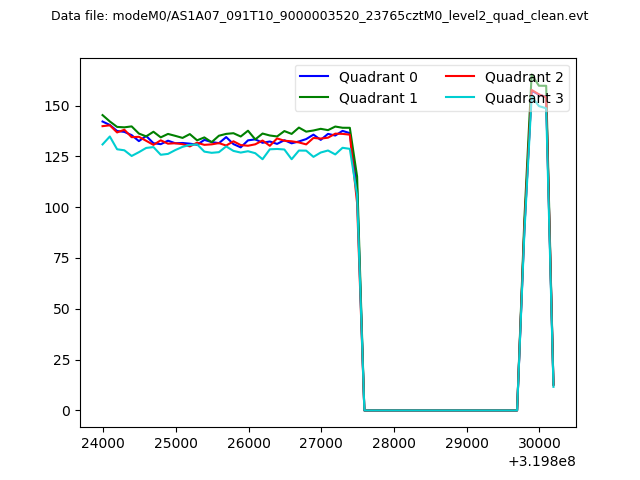 |
|
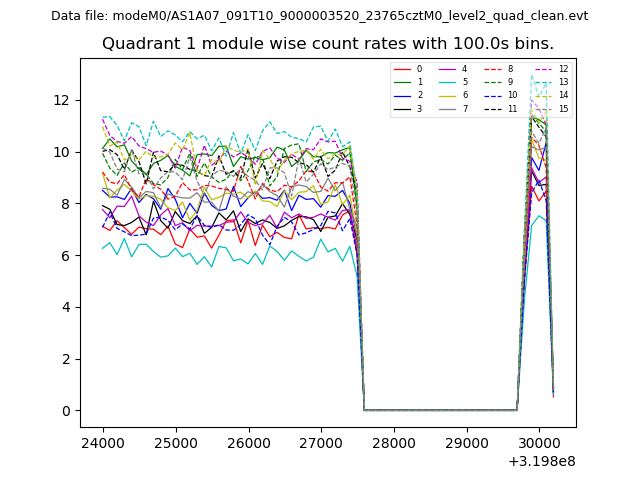
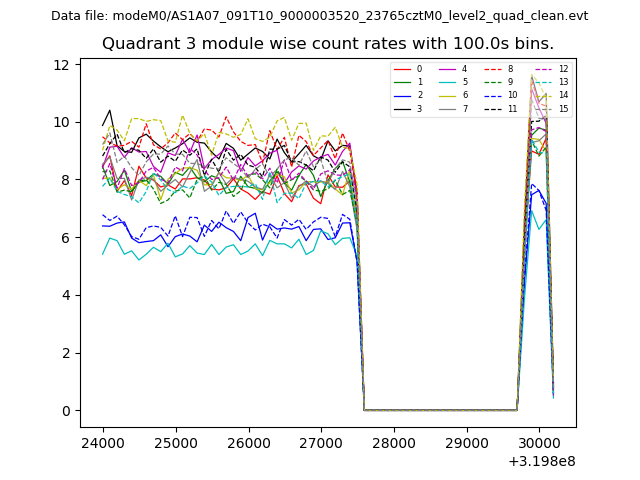
| Module-wise count rates for Quadrant A Data is divided into 100 sec bins |
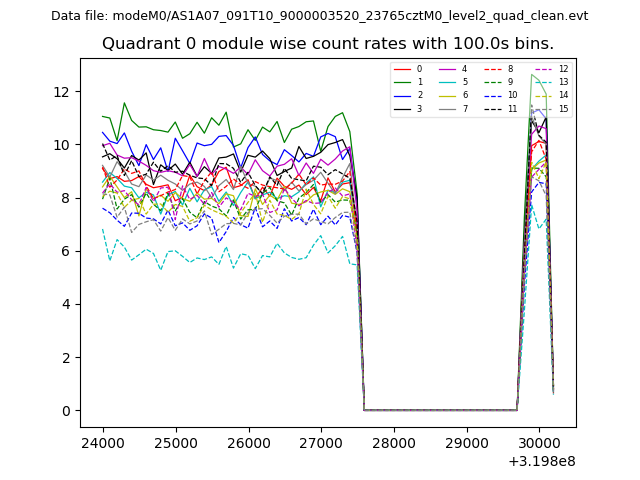 |
 |
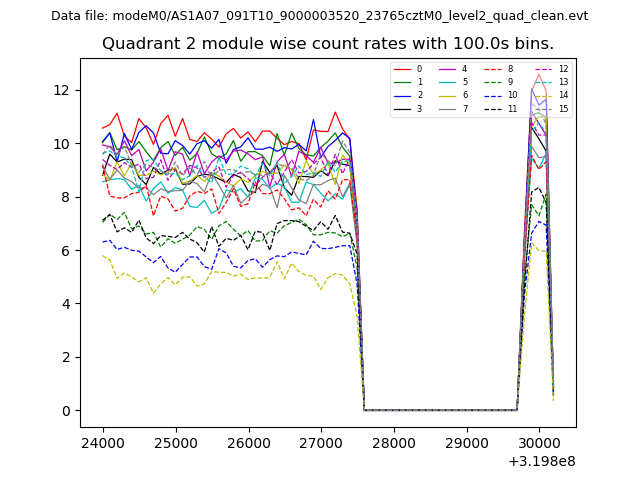
| Module-wise count rates for Quadrant B Data is divided into 100 sec bins |
 |
 |
| Module-wise count rates for Quadrant C Data is divided into 100 sec bins |
 |
 |
| Module-wise count rates for Quadrant D Data is divided into 100 sec bins |
 |
 |
| Parameter | Plot |
|---|---|
| CZT HV Monitor | 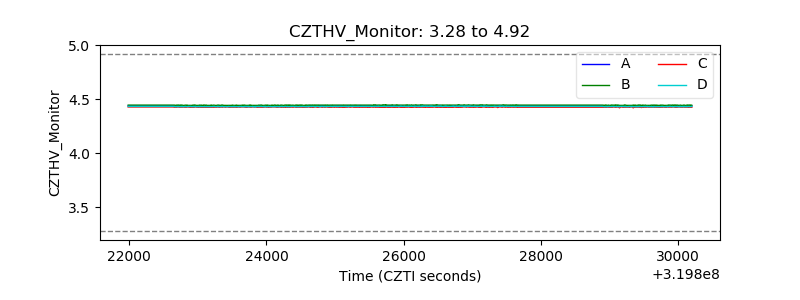 |
| D_VDD | 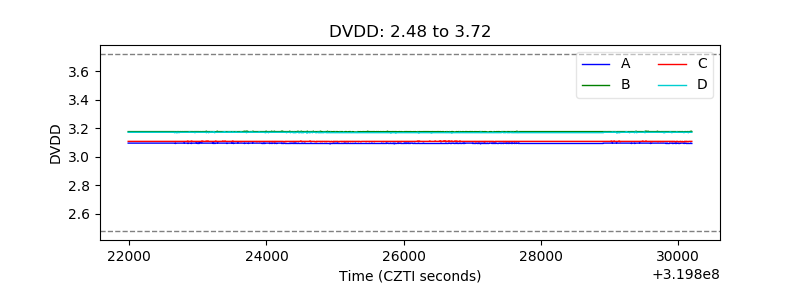 |
| Temperature 1 | 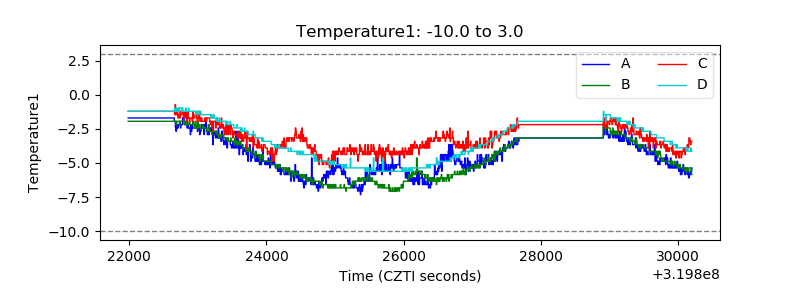 |
| Veto HV Monitor | 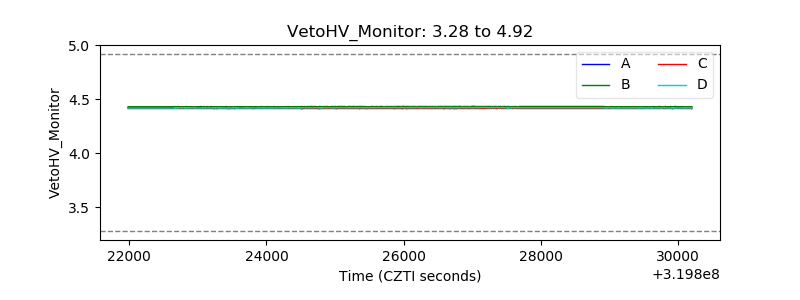 |
| Veto LLD | 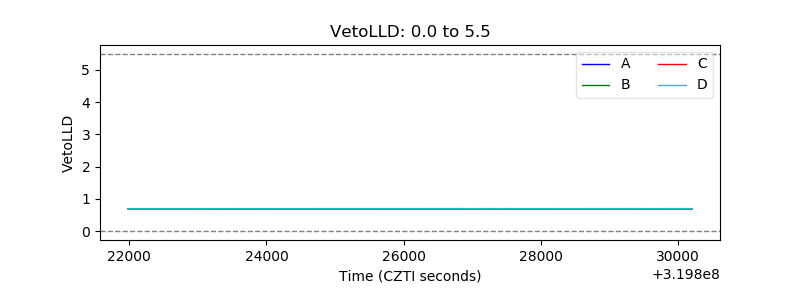 |
| Alpha Counter | 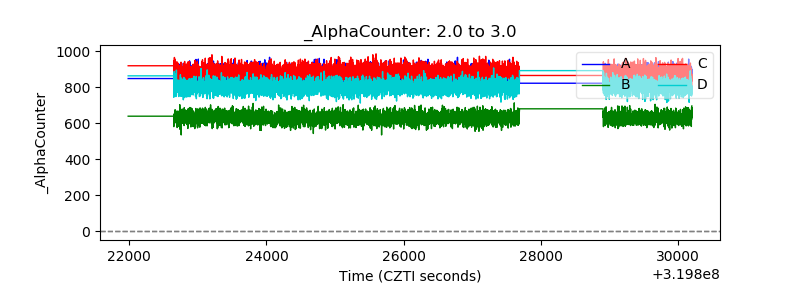 |
| _CPM_Rate | 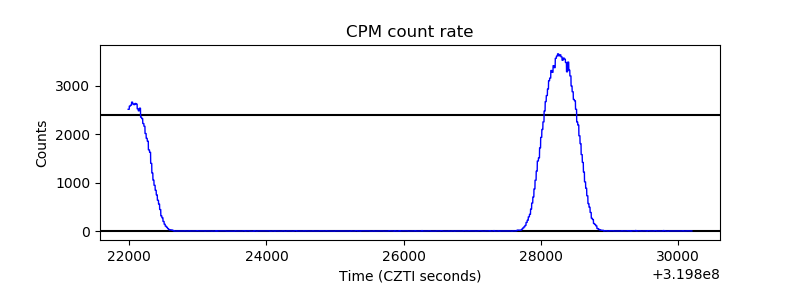 |
| CZT Counter | 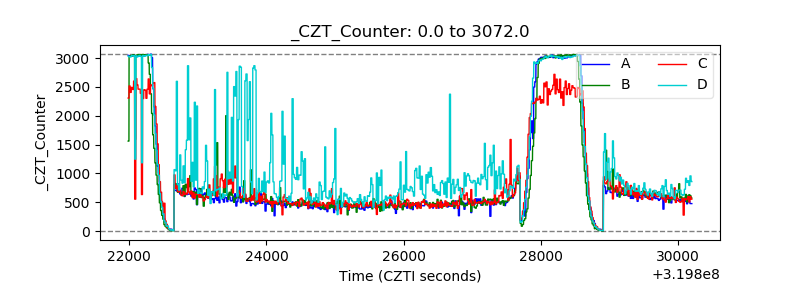 |
| +2.5 Volts monitor | 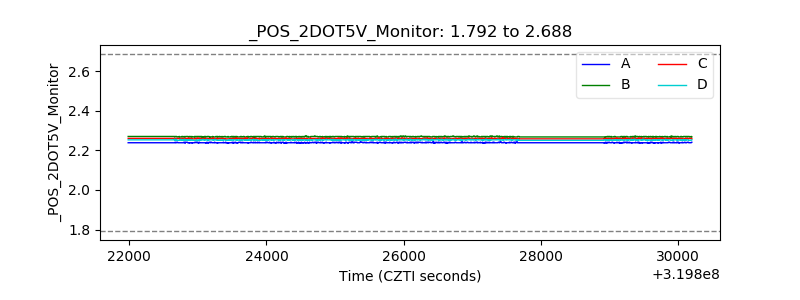 |
| +5 Volts monitor |  |
| _ROLL_ROT | 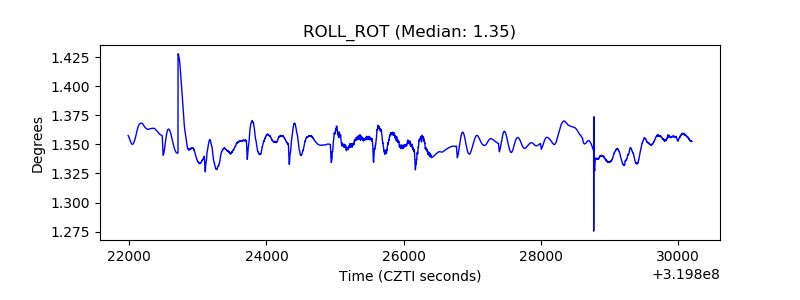 |
| _Roll_DEC | 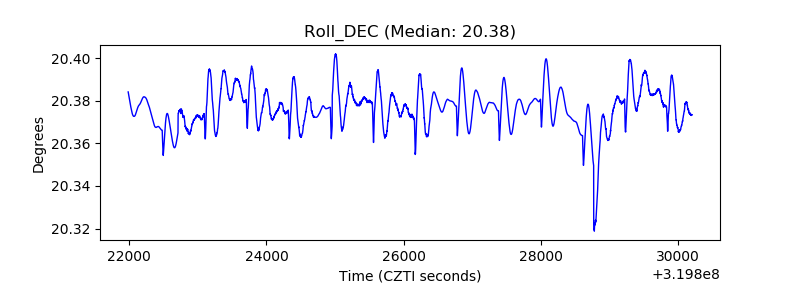 |
| _Roll_RA | 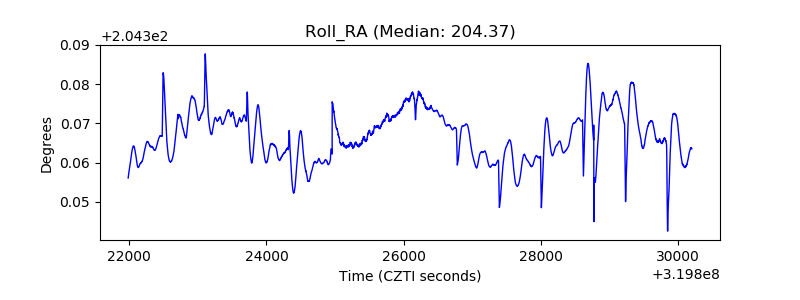 |
| Veto Counter | 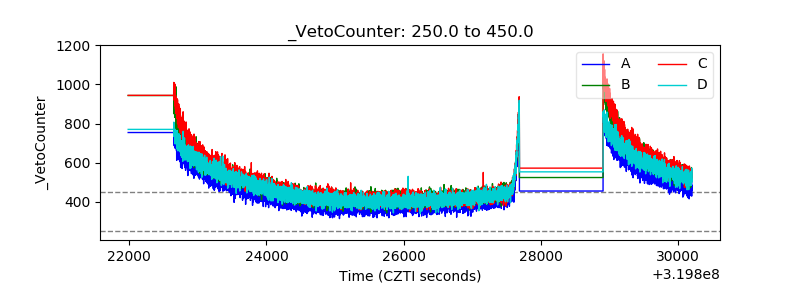 |