| Param | Original file | Final file |
|---|---|---|
| Filename | modeM0/AS1A07_091T10_9000003520_23766cztM0_level2.evt | modeM0/AS1A07_091T10_9000003520_23766cztM0_level2_quad_clean.evt |
| Size (bytes) | 579,257,280 | 103,484,160 |
| Size | 552.4 MB | 98.7 MB |
| Events in quadrant A | 3,536,798 | 672,617 |
| Events in quadrant B | 4,074,948 | 684,485 |
| Events in quadrant C | 3,790,111 | 671,009 |
| Events in quadrant D | 5,691,358 | 642,680 |
| Mode M9 | |||
|---|---|---|---|
| Quadrant | BADHDUFLAG | Total packets | Discarded packets |
| A | 0 | 25 | 0 |
| B | 0 | 25 | 0 |
| C | 0 | 25 | 0 |
| D | 0 | 25 | 0 |
| Mode M0 | |||
|---|---|---|---|
| Quadrant | BADHDUFLAG | Total packets | Discarded packets |
| A | 0 | 14778 | 2 |
| B | 0 | 16443 | 2 |
| C | 0 | 15512 | 3 |
| D | 0 | 21853 | 2 |
| Mode SS | |||
|---|---|---|---|
| Quadrant | BADHDUFLAG | Total packets | Discarded packets |
| A | 0 | 136 | 0 |
| B | 0 | 136 | 0 |
| C | 0 | 136 | 0 |
| D | 0 | 136 | 0 |
| Quadrant | Total seconds | Saturated seconds | Saturation percentage |
|---|---|---|---|
| A | 6647 | 89 | 1.338950% |
| B | 6648 | 236 | 3.549940% |
| C | 6647 | 191 | 2.873477% |
| D | 6647 | 228 | 3.430119% |
Noise dominated data is calculated using 1-second bins in cleaned event files. If a bin has >2000 counts, and if more than 50% of those come from <1% of pixels, then it is considered to be noise-dominated and hence unusable.
| Quadrant | # 1 sec bins | Bins with >0 counts | Bins with >2000 counts | High rate bins dominated by noise | Noise dominated (total time) | Noise dominated (detector-on time) | Marked lightcurve |
|---|---|---|---|---|---|---|---|
| A | 9167 | 6647 | 0 | 0 | 0.00% | 0.00% | 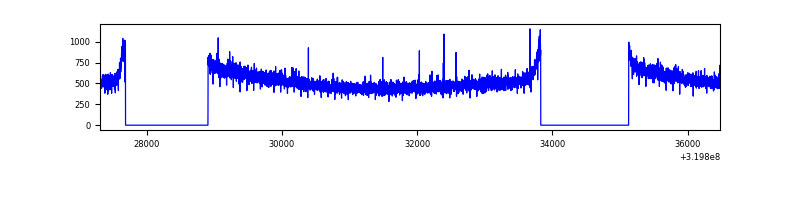 |
| B | 9168 | 6648 | 98 | 98 | 1.07% | 1.47% | 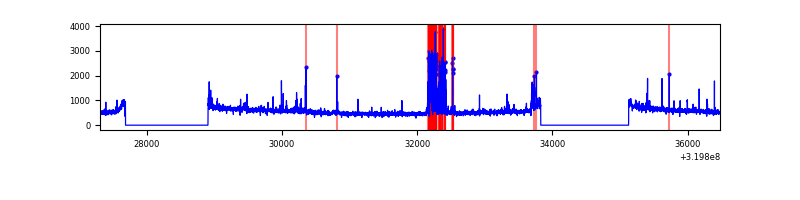 |
| C | 9167 | 6647 | 9 | 9 | 0.10% | 0.14% | 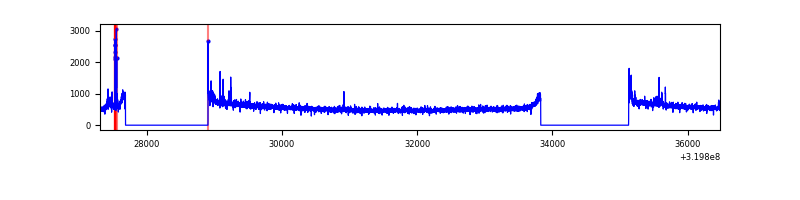 |
| D | 9167 | 6647 | 101 | 101 | 1.10% | 1.52% | 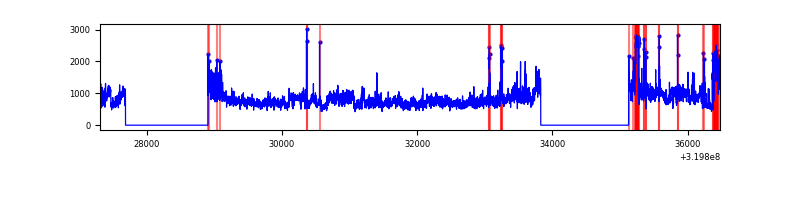 |
Top three noisy pixels from each quadrant. If the there are fewer than three noisy pixels in the level2.evt file, extra rows are filled as -1
| Pixel properties | Quadrant properties | ||||||
|---|---|---|---|---|---|---|---|
| Quadrant | DetID | PixID | Counts | Sigma | Mean | Median | Sigma |
| A | 13 | 254 | 10451 | 51.99 | 917 | 898 | 183.8 |
| A | 0 | 226 | 8003 | 38.66 | 917 | 898 | 183.8 |
| A | 3 | 137 | 7710 | 37.07 | 917 | 898 | 183.8 |
| B | 10 | 247 | 311043 | 1819.89 | 917 | 899 | 170.4 |
| B | 3 | 64 | 112433 | 654.47 | 917 | 899 | 170.4 |
| B | 0 | 229 | 32912 | 187.85 | 917 | 899 | 170.4 |
| C | 14 | 238 | 141848 | 673.11 | 899 | 908 | 209.4 |
| C | 7 | 247 | 112906 | 534.89 | 899 | 908 | 209.4 |
| C | 0 | 10 | 26013 | 119.9 | 899 | 908 | 209.4 |
| D | 1 | 52 | 1053532 | 4899.15 | 896 | 872 | 214.9 |
| D | 8 | 195 | 548117 | 2546.91 | 896 | 872 | 214.9 |
| D | 7 | 238 | 404940 | 1880.56 | 896 | 872 | 214.9 |
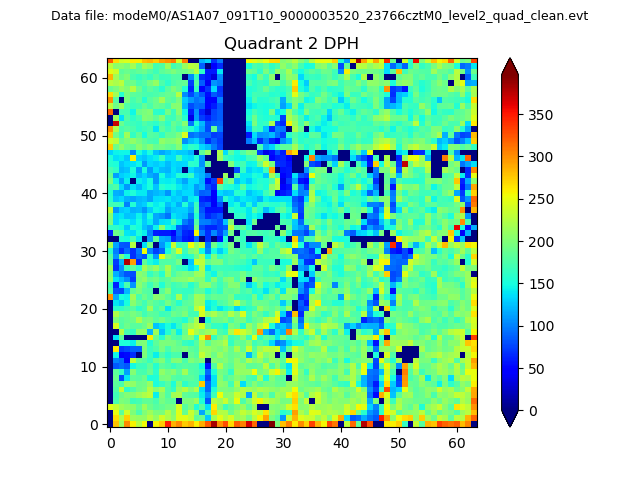
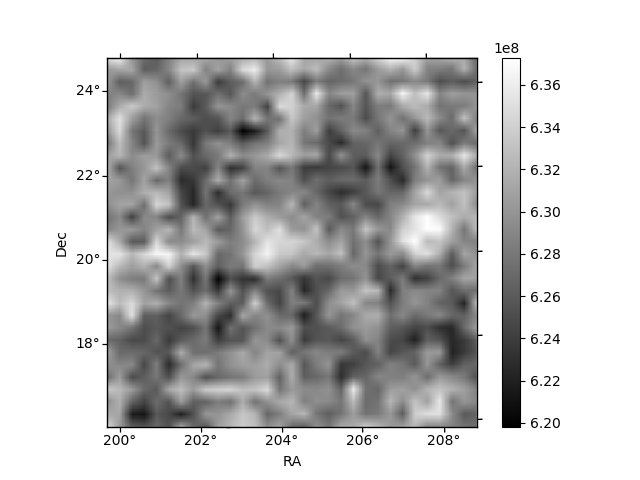
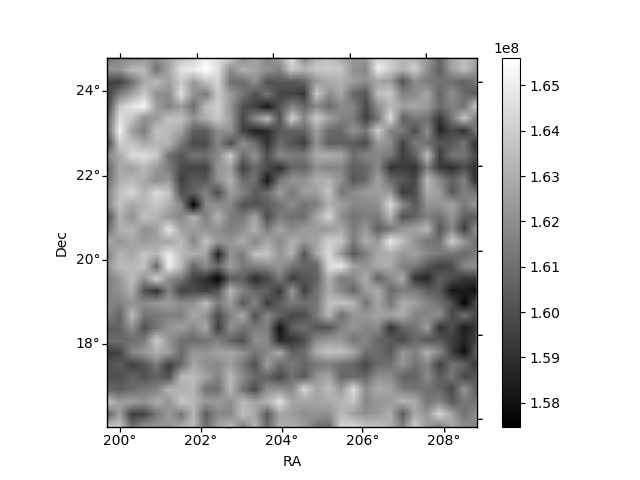
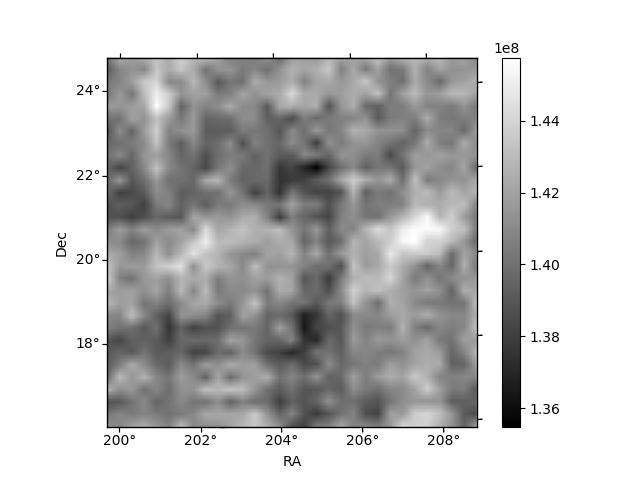
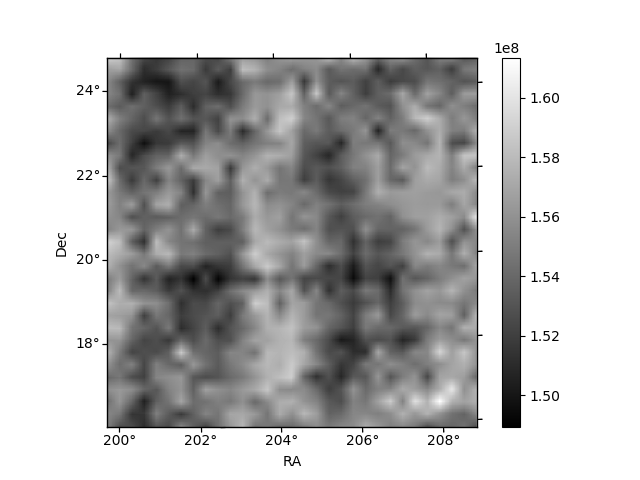
Histogram calculated using DETX and DETY for each event in the final _common_clean file
| Quadrant A | 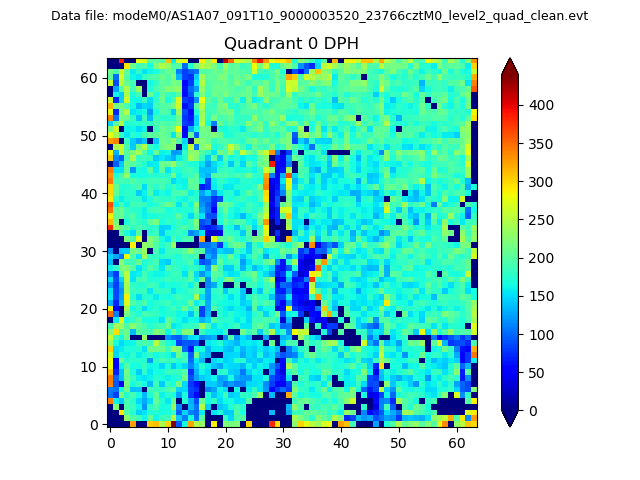 |
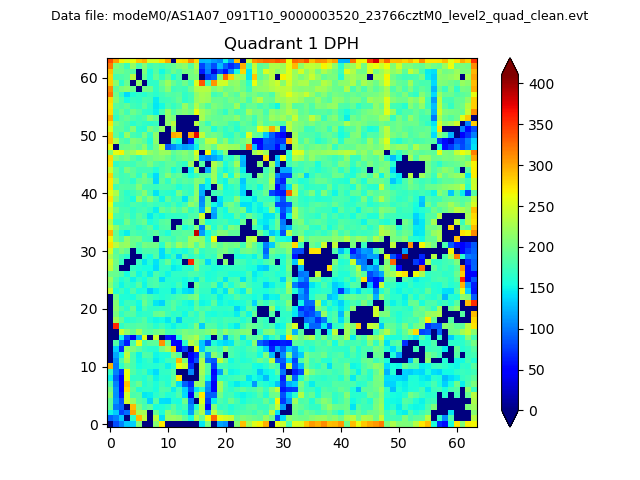 |
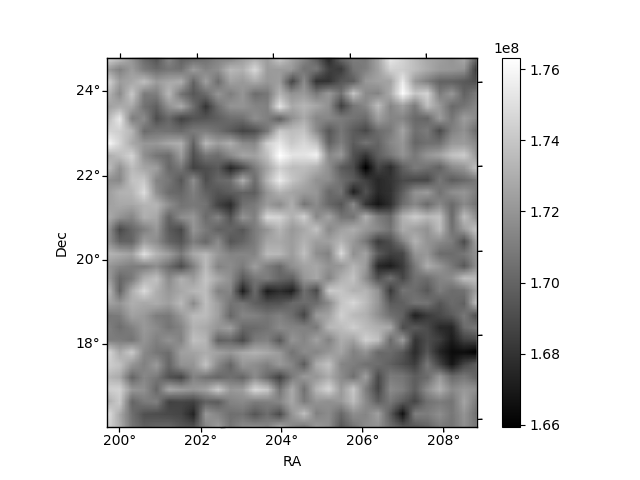
Quadrant B |
|---|---|---|---|
| Quadrant D | 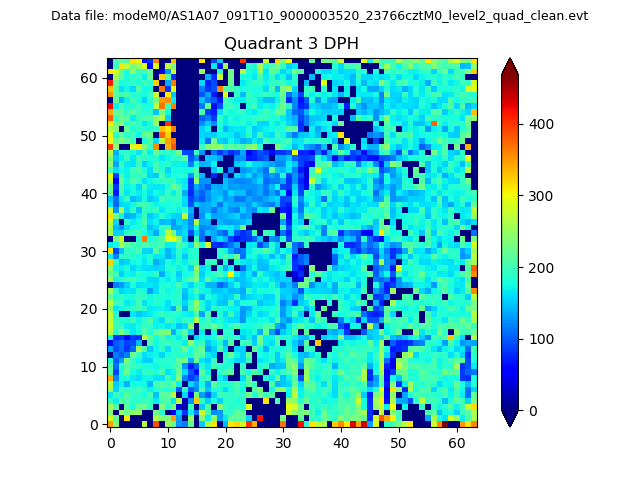 |
 |
Quadrant C |
| Plot type | Count rate plots | Images |
|---|---|---|
| Comparison with Poisson distribution Blue bars denote a histogram of data divided into 1 sec bins. Red curve is a Poisson curve with rate = median count rate of data. |
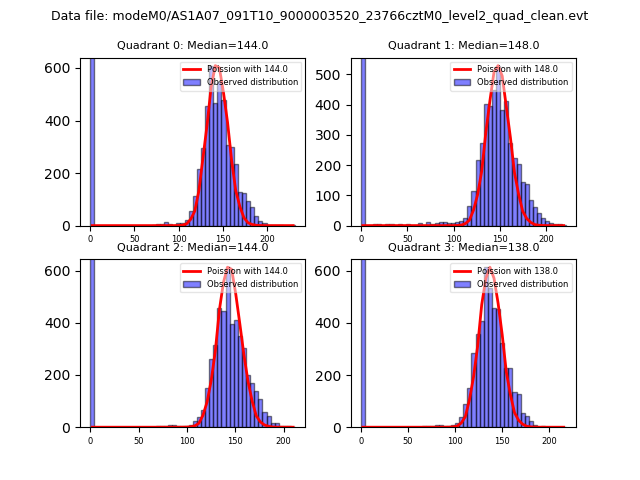 |
 |
| Quadrant-wise count rates Data is divided into 100 sec bins |
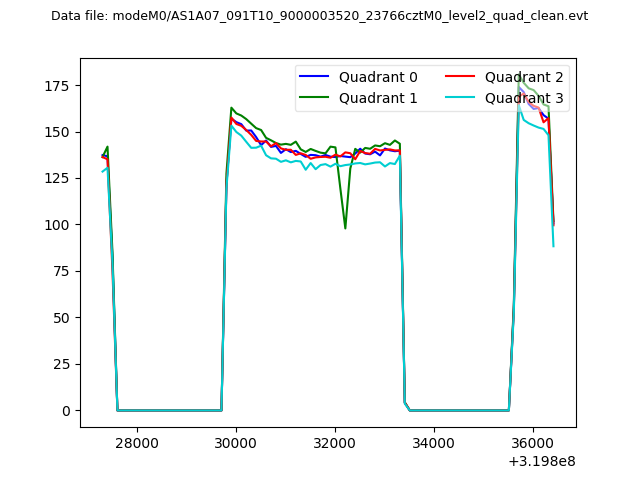 |
|
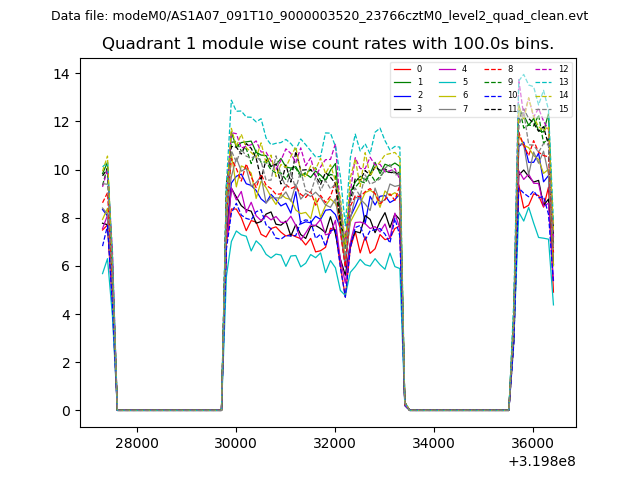
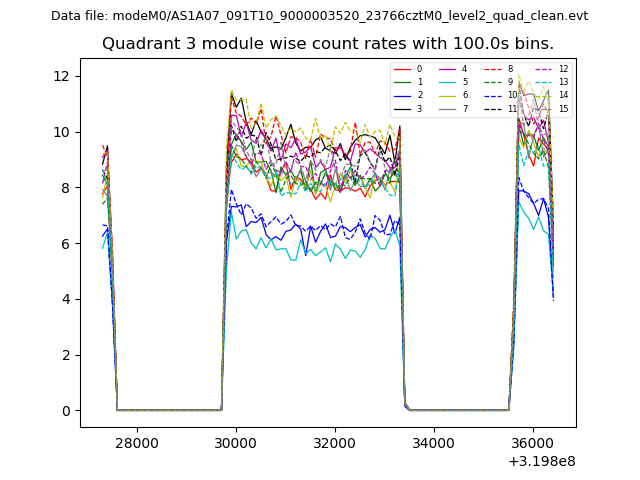
| Module-wise count rates for Quadrant A Data is divided into 100 sec bins |
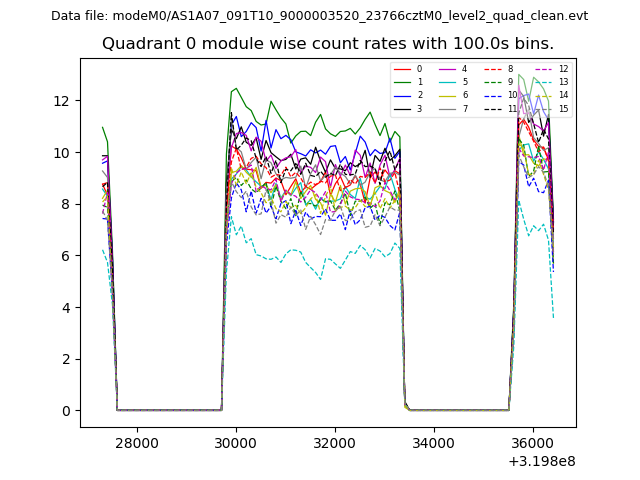 |
 |
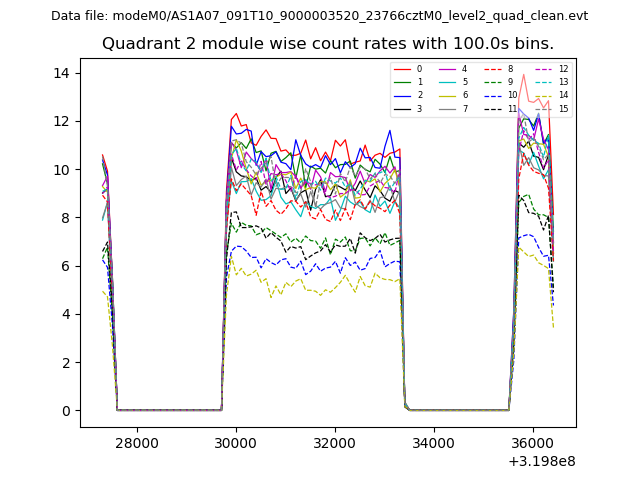
| Module-wise count rates for Quadrant B Data is divided into 100 sec bins |
 |
 |
| Module-wise count rates for Quadrant C Data is divided into 100 sec bins |
 |
 |
| Module-wise count rates for Quadrant D Data is divided into 100 sec bins |
 |
 |
| Parameter | Plot |
|---|---|
| CZT HV Monitor | 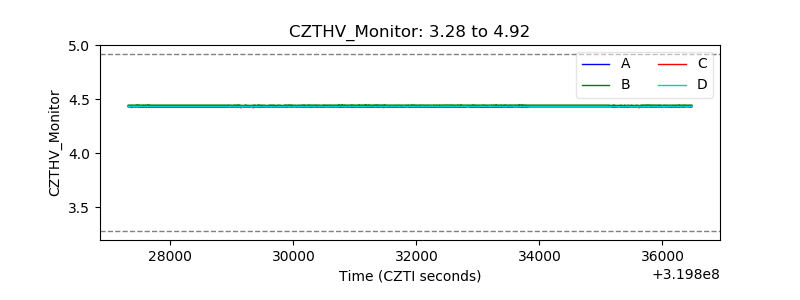 |
| D_VDD | 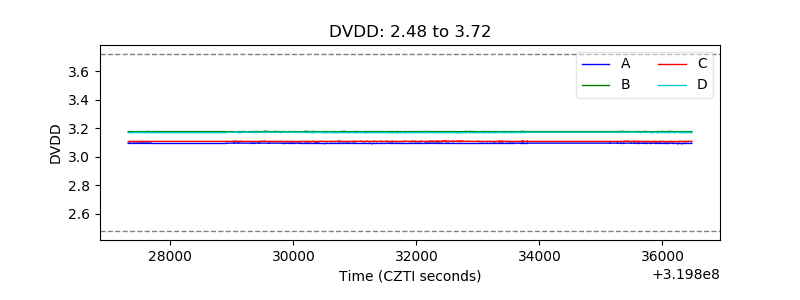 |
| Temperature 1 | 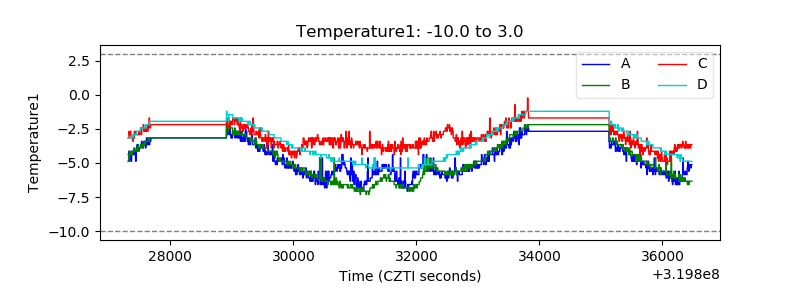 |
| Veto HV Monitor | 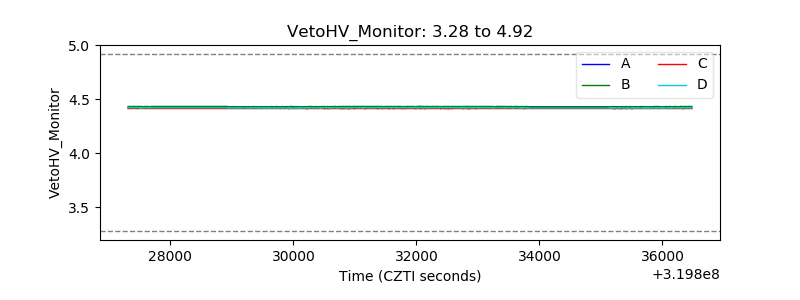 |
| Veto LLD | 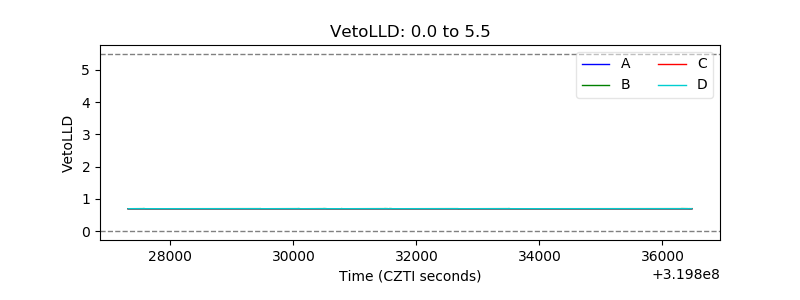 |
| Alpha Counter | 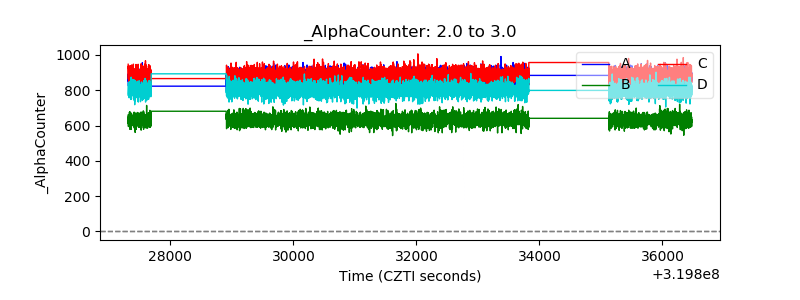 |
| _CPM_Rate | 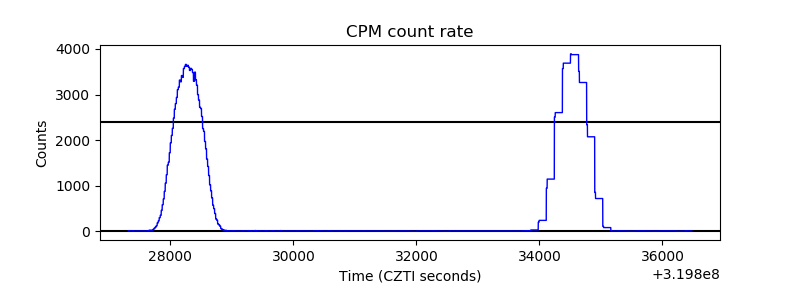 |
| CZT Counter | 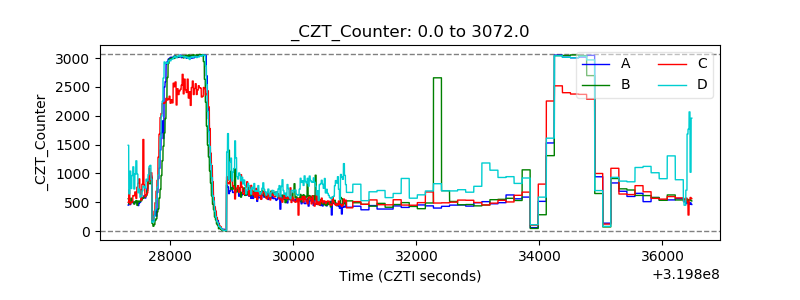 |
| +2.5 Volts monitor | 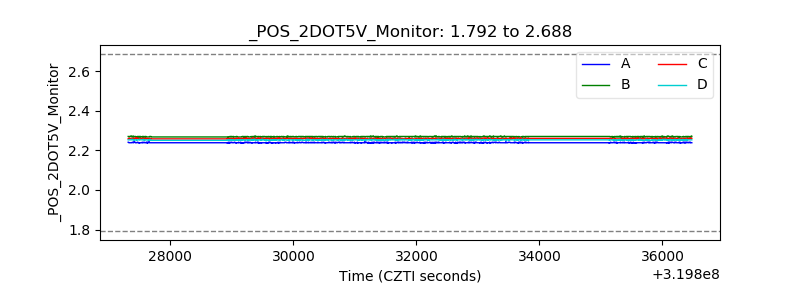 |
| +5 Volts monitor | 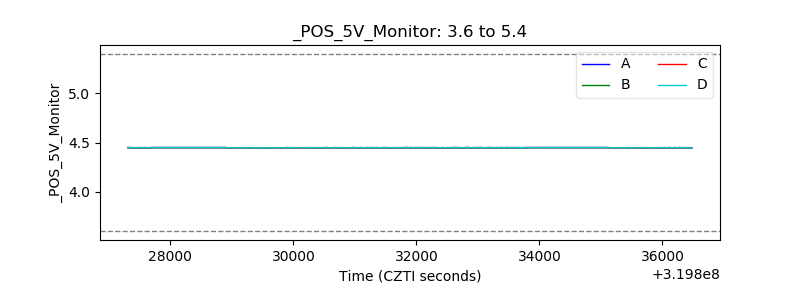 |
| _ROLL_ROT | 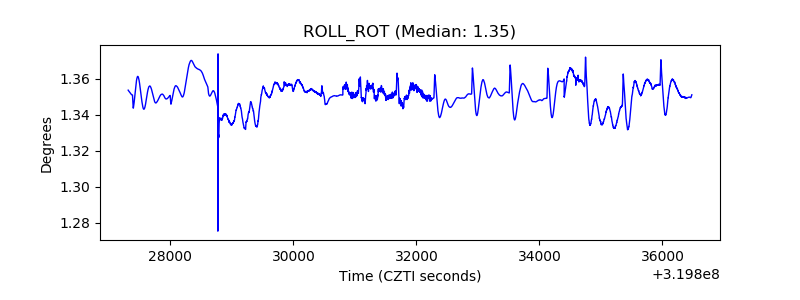 |
| _Roll_DEC | 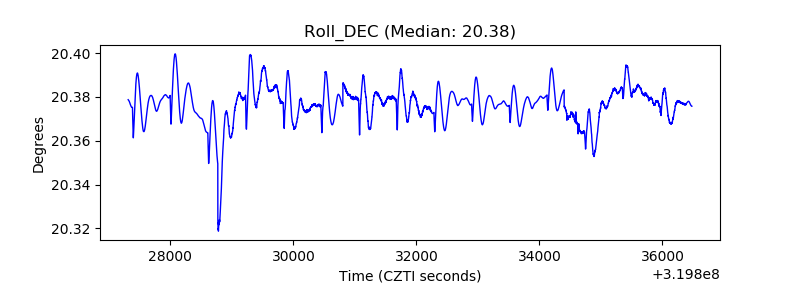 |
| _Roll_RA | 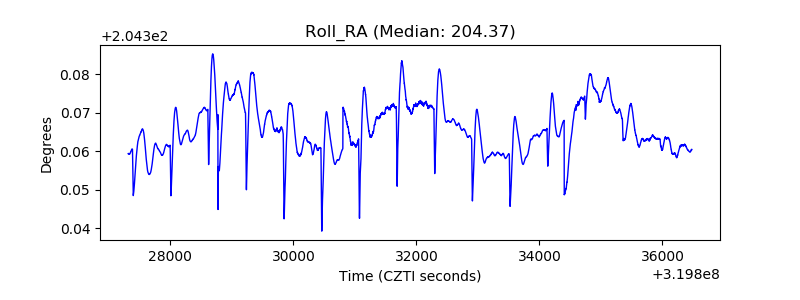 |
| Veto Counter | 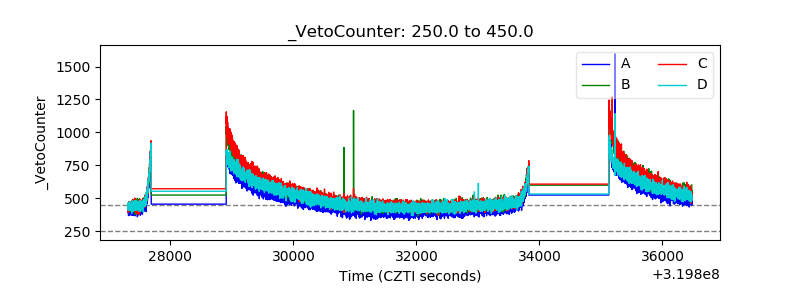 |