| Param | Original file | Final file |
|---|---|---|
| Filename | modeM0/AS1A07_091T10_9000003520_23767cztM0_level2.evt | modeM0/AS1A07_091T10_9000003520_23767cztM0_level2_quad_clean.evt |
| Size (bytes) | 144,221,760 | 22,296,960 |
| Size | 137.5 MB | 21.3 MB |
| Events in quadrant A | 839,600 | 142,892 |
| Events in quadrant B | 904,406 | 149,334 |
| Events in quadrant C | 913,925 | 142,282 |
| Events in quadrant D | 1,610,428 | 133,680 |
| Mode M9 | |||
|---|---|---|---|
| Quadrant | BADHDUFLAG | Total packets | Discarded packets |
| A | 0 | 11 | 0 |
| B | 0 | 12 | 0 |
| C | 0 | 12 | 0 |
| D | 0 | 12 | 0 |
| Mode M0 | |||
|---|---|---|---|
| Quadrant | BADHDUFLAG | Total packets | Discarded packets |
| A | 0 | 3425 | 1 |
| B | 0 | 3669 | 1 |
| C | 0 | 3724 | 1 |
| D | 0 | 5815 | 1 |
| Mode SS | |||
|---|---|---|---|
| Quadrant | BADHDUFLAG | Total packets | Discarded packets |
| A | 0 | 28 | 0 |
| B | 0 | 28 | 0 |
| C | 0 | 28 | 0 |
| D | 0 | 28 | 0 |
| Quadrant | Total seconds | Saturated seconds | Saturation percentage |
|---|---|---|---|
| A | 1433 | 9 | 0.628053% |
| B | 1433 | 20 | 1.395673% |
| C | 1433 | 49 | 3.419400% |
| D | 1433 | 97 | 6.769016% |
Noise dominated data is calculated using 1-second bins in cleaned event files. If a bin has >2000 counts, and if more than 50% of those come from <1% of pixels, then it is considered to be noise-dominated and hence unusable.
| Quadrant | # 1 sec bins | Bins with >0 counts | Bins with >2000 counts | High rate bins dominated by noise | Noise dominated (total time) | Noise dominated (detector-on time) | Marked lightcurve |
|---|---|---|---|---|---|---|---|
| A | 1433 | 1433 | 0 | 0 | 0.00% | 0.00% | 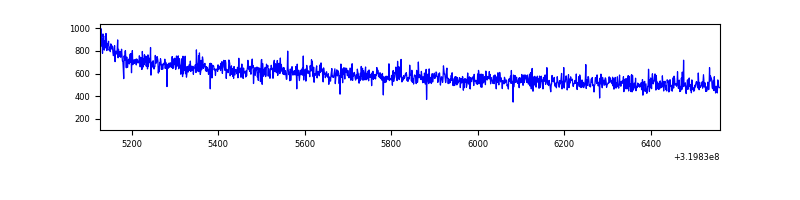 |
| B | 1433 | 1433 | 1 | 1 | 0.07% | 0.07% | 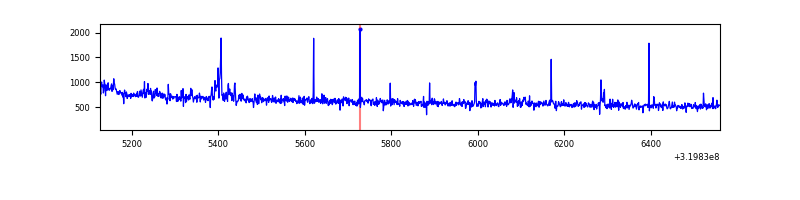 |
| C | 1433 | 1433 | 0 | 0 | 0.00% | 0.00% | 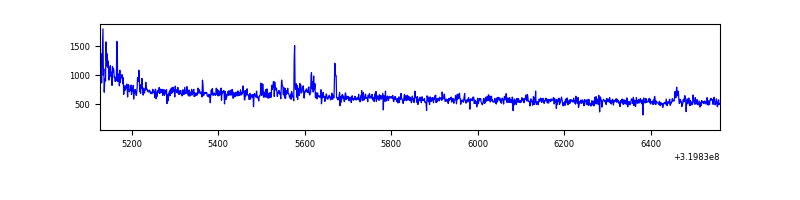 |
| D | 1433 | 1433 | 91 | 91 | 6.35% | 6.35% | 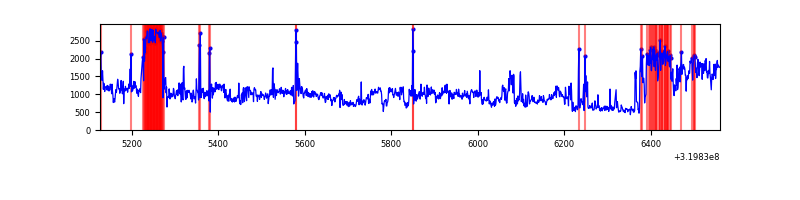 |
Top three noisy pixels from each quadrant. If the there are fewer than three noisy pixels in the level2.evt file, extra rows are filled as -1
| Pixel properties | Quadrant properties | ||||||
|---|---|---|---|---|---|---|---|
| Quadrant | DetID | PixID | Counts | Sigma | Mean | Median | Sigma |
| A | 13 | 254 | 2515 | 51.12 | 217 | 213 | 45.0 |
| A | 0 | 226 | 1916 | 37.82 | 217 | 213 | 45.0 |
| A | 3 | 137 | 1732 | 33.73 | 217 | 213 | 45.0 |
| B | 3 | 64 | 21611 | 506.06 | 222 | 217 | 42.3 |
| B | 0 | 189 | 6178 | 141.0 | 222 | 217 | 42.3 |
| B | 12 | 111 | 4724 | 106.61 | 222 | 217 | 42.3 |
| C | 14 | 238 | 34576 | 668.59 | 215 | 216 | 51.4 |
| C | 7 | 247 | 27511 | 531.11 | 215 | 216 | 51.4 |
| C | 0 | 10 | 13644 | 261.28 | 215 | 216 | 51.4 |
| D | 1 | 52 | 362248 | 6893.15 | 208 | 203 | 52.5 |
| D | 13 | 174 | 347921 | 6620.37 | 208 | 203 | 52.5 |
| D | 8 | 195 | 106857 | 2030.64 | 208 | 203 | 52.5 |
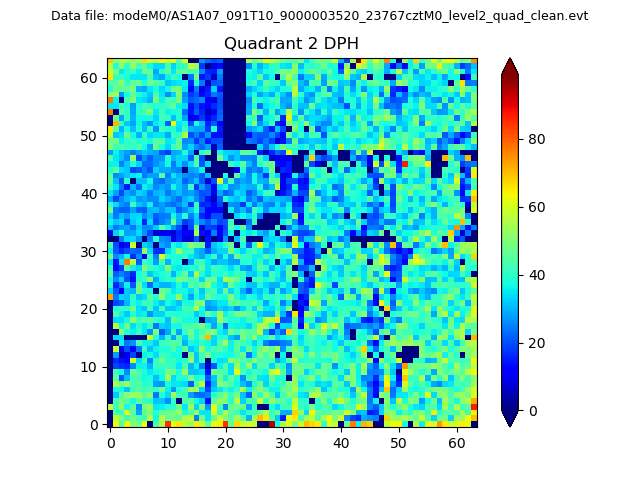
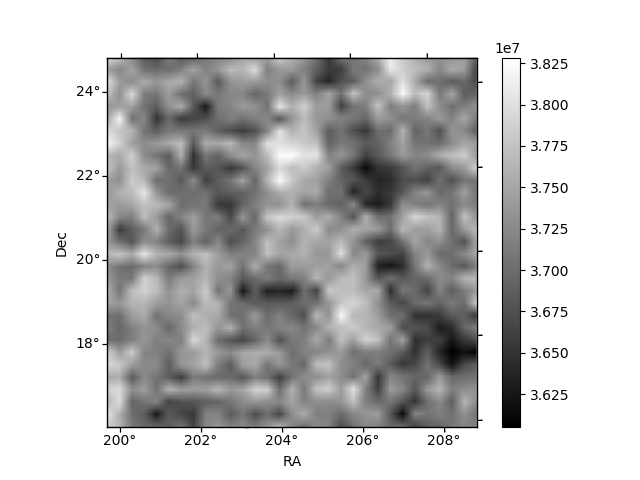
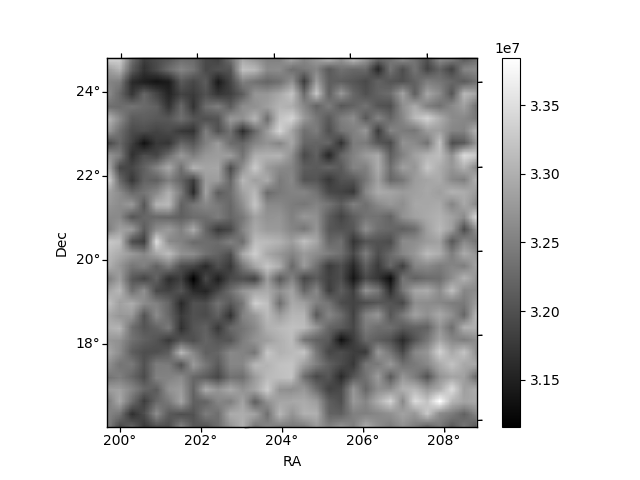
Histogram calculated using DETX and DETY for each event in the final _common_clean file
| Quadrant A | 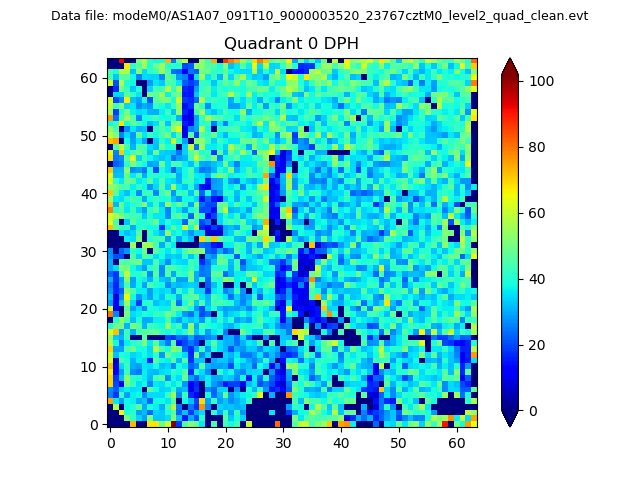 |
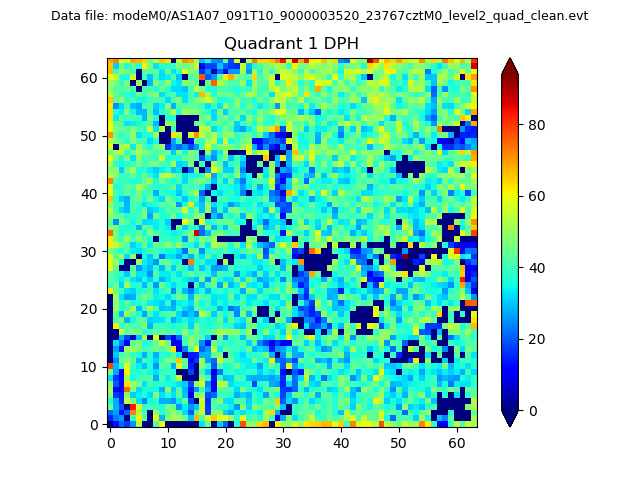 |
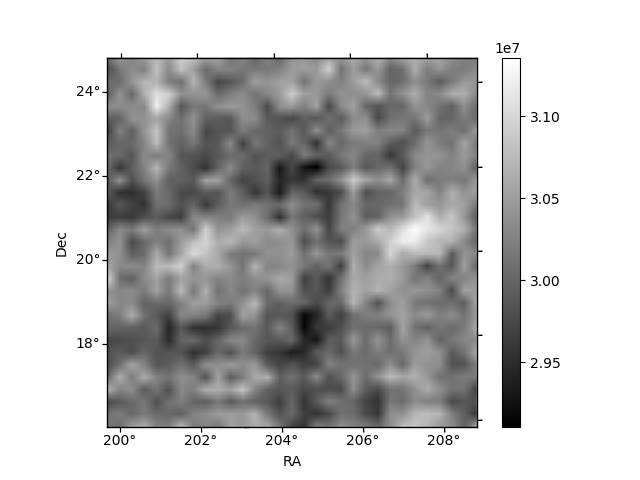
Quadrant B |
|---|---|---|---|
| Quadrant D | 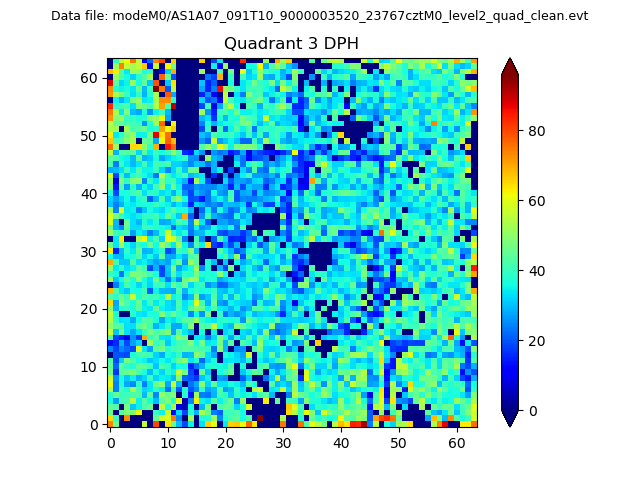 |
 |
Quadrant C |
| Plot type | Count rate plots | Images |
|---|---|---|
| Comparison with Poisson distribution Blue bars denote a histogram of data divided into 1 sec bins. Red curve is a Poisson curve with rate = median count rate of data. |
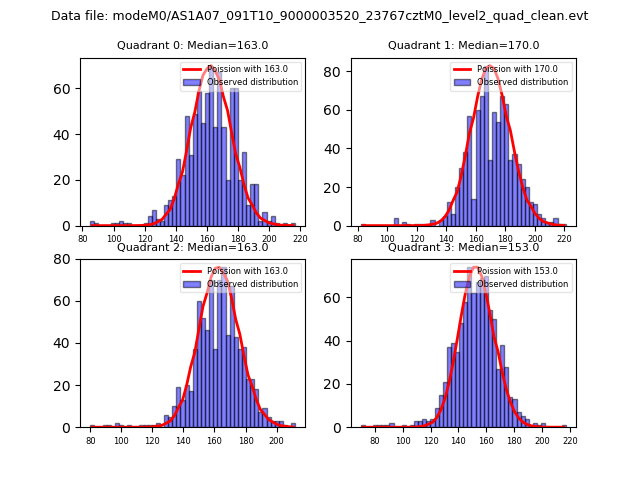 |
 |
| Quadrant-wise count rates Data is divided into 100 sec bins |
 |
|
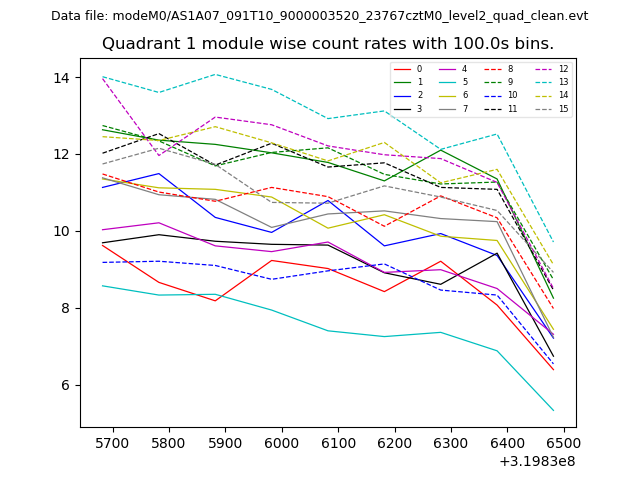
| Module-wise count rates for Quadrant A Data is divided into 100 sec bins |
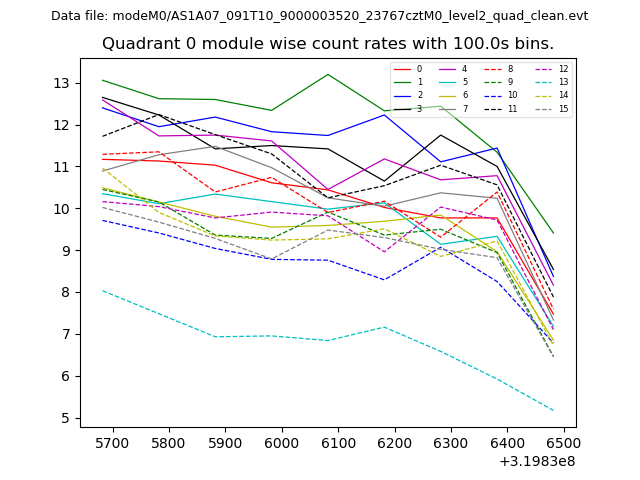 |
 |
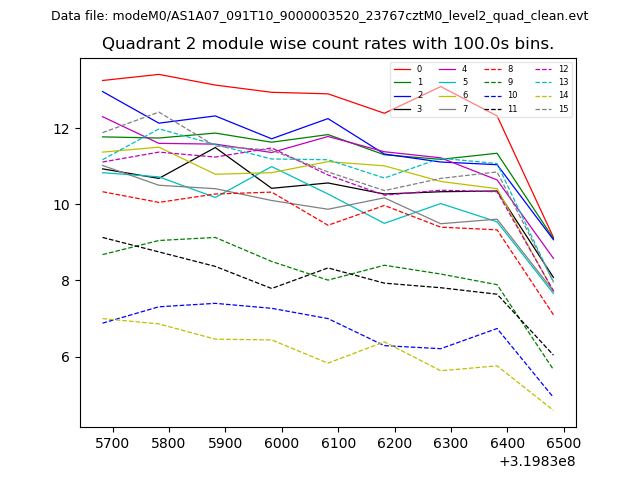
| Module-wise count rates for Quadrant B Data is divided into 100 sec bins |
 |
 |
| Module-wise count rates for Quadrant C Data is divided into 100 sec bins |
 |
 |
| Module-wise count rates for Quadrant D Data is divided into 100 sec bins |
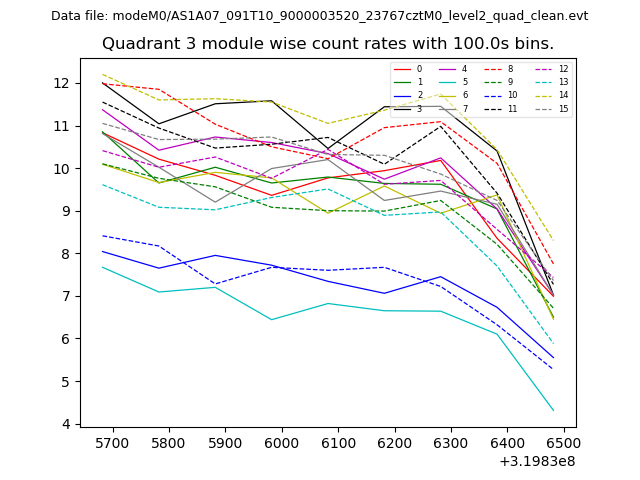 |
 |
| Parameter | Plot |
|---|---|
| CZT HV Monitor | 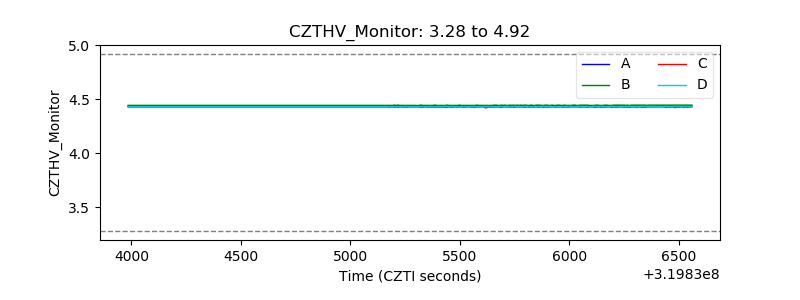 |
| D_VDD | 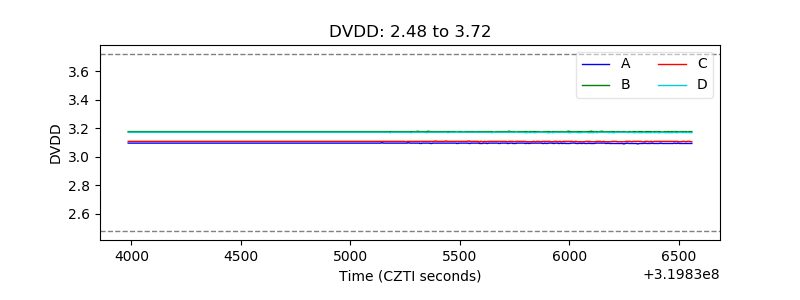 |
| Temperature 1 | 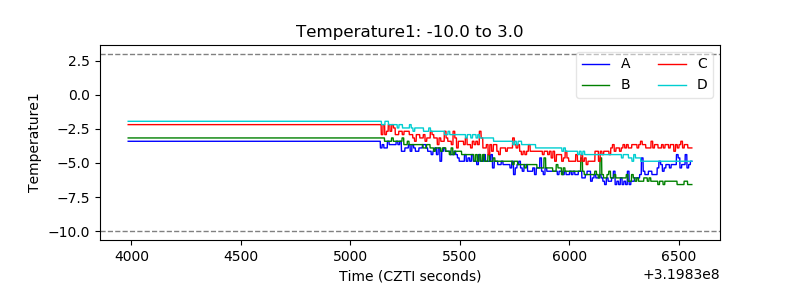 |
| Veto HV Monitor | 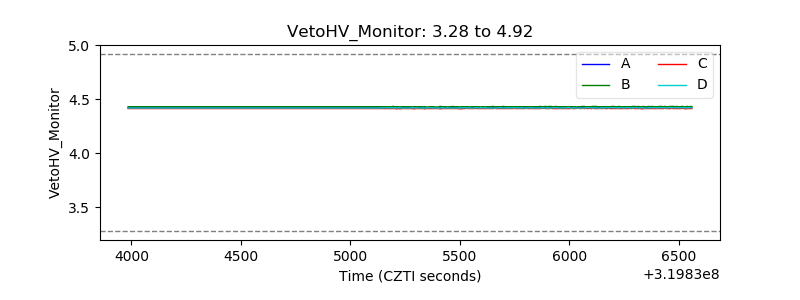 |
| Veto LLD |  |
| Alpha Counter |  |
| _CPM_Rate | 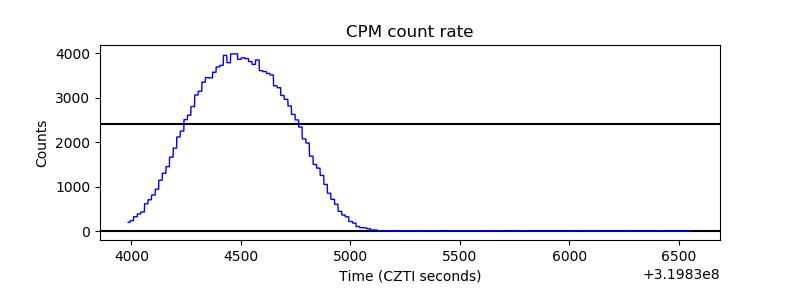 |
| CZT Counter | 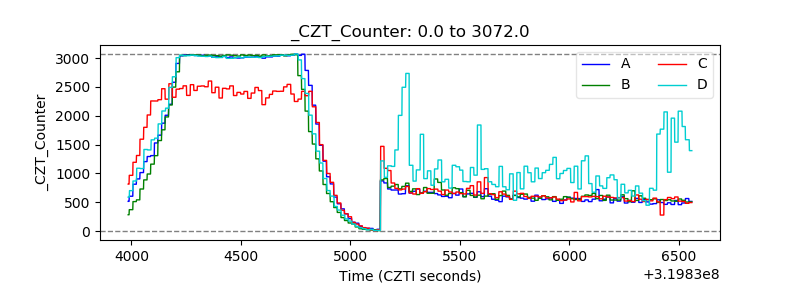 |
| +2.5 Volts monitor |  |
| +5 Volts monitor |  |
| _ROLL_ROT | 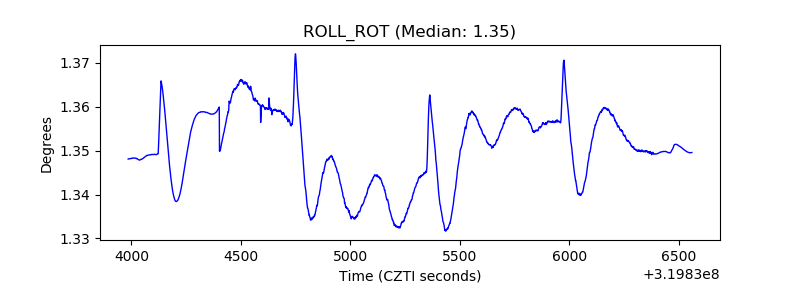 |
| _Roll_DEC | 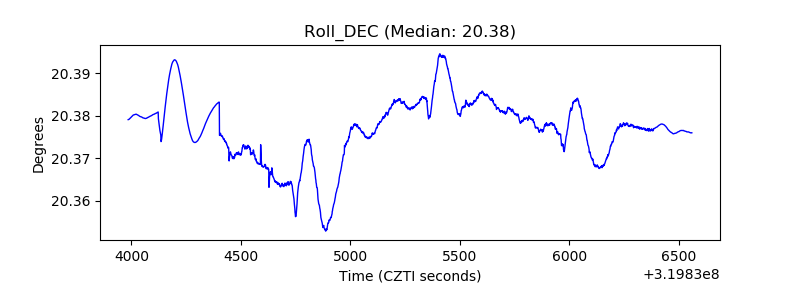 |
| _Roll_RA | 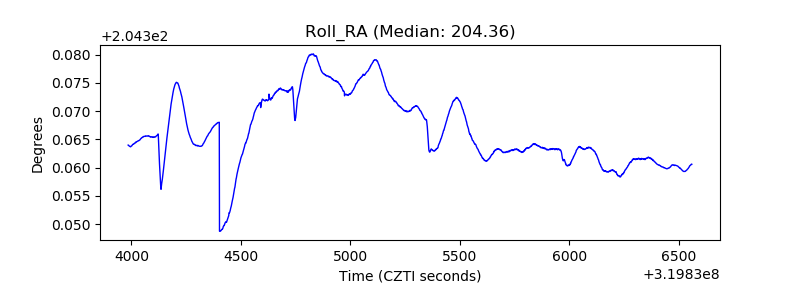 |
| Veto Counter | 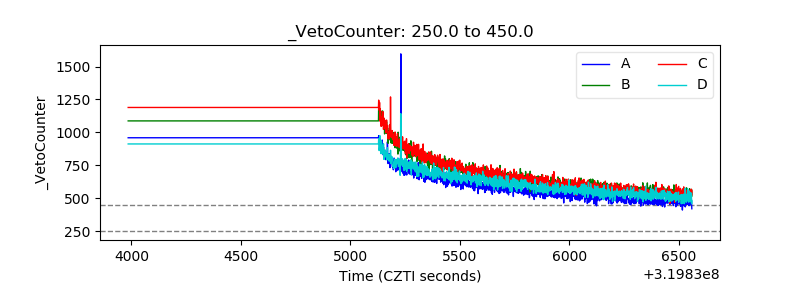 |