| Param | Original file | Final file |
|---|---|---|
| Filename | modeM0/AS1C05_002T06_9000003522cztM0_level2.fits | modeM0/AS1C05_002T06_9000003522cztM0_level2_quad_clean.evt |
| Size (bytes) | 78,215,040 | 46,022,400 |
| Size | 74.6 MB | 43.9 MB |
| Events in quadrant A | 489,726 | 226,322 |
| Events in quadrant B | 476,880 | 233,662 |
| Events in quadrant C | 484,994 | 225,870 |
| Events in quadrant D | 405,156 | 194,562 |
| Mode M9 | |||
|---|---|---|---|
| Quadrant | BADHDUFLAG | Total packets | Discarded packets |
| A | 0 | 13 | 0 |
| B | 0 | 13 | 0 |
| C | 0 | 13 | 0 |
| D | 0 | 13 | 0 |
| Mode M0 | |||
|---|---|---|---|
| Quadrant | BADHDUFLAG | Total packets | Discarded packets |
| A | 0 | 15339 | 0 |
| B | 0 | 15696 | 0 |
| C | 0 | 15956 | 0 |
| D | 0 | 28139 | 0 |
| Mode SS | |||
|---|---|---|---|
| Quadrant | BADHDUFLAG | Total packets | Discarded packets |
| A | 0 | 150 | 0 |
| B | 0 | 150 | 0 |
| C | 0 | 150 | 0 |
| D | 0 | 150 | 0 |
| Quadrant | Total seconds | Saturated seconds | Saturation percentage |
|---|---|---|---|
| A | 7355 | 54 | 0.734194% |
| B | 7355 | 69 | 0.938137% |
| C | 7355 | 106 | 1.441196% |
| D | 7355 | 696 | 9.462950% |
Noise dominated data is calculated using 1-second bins in cleaned event files. If a bin has >2000 counts, and if more than 50% of those come from <1% of pixels, then it is considered to be noise-dominated and hence unusable.
| Quadrant | # 1 sec bins | Bins with >0 counts | Bins with >2000 counts | High rate bins dominated by noise | Noise dominated (total time) | Noise dominated (detector-on time) | Marked lightcurve |
|---|---|---|---|---|---|---|---|
| A | 8705 | 7354 | 0 | 0 | 0.00% | 0.00% |  |
| B | 8705 | 7354 | 0 | 0 | 0.00% | 0.00% |  |
| C | 8705 | 7354 | 0 | 0 | 0.00% | 0.00% |  |
| D | 8705 | 7354 | 0 | 0 | 0.00% | 0.00% |  |
Top three noisy pixels from each quadrant. If the there are fewer than three noisy pixels in the level2.evt file, extra rows are filled as -1
| Pixel properties | Quadrant properties | ||||||
|---|---|---|---|---|---|---|---|
| Quadrant | DetID | PixID | Counts | Sigma | Mean | Median | Sigma |
| A | 0 | 29 | 439 | 9.69 | 127 | 120 | 32.9 |
| A | 7 | 110 | 405 | 8.66 | 127 | 120 | 32.9 |
| A | 9 | 19 | 355 | 7.14 | 127 | 120 | 32.9 |
| B | 2 | 9 | 370 | 9.28 | 126 | 121 | 26.8 |
| B | 5 | 128 | 326 | 7.64 | 126 | 121 | 26.8 |
| B | 5 | 225 | 314 | 7.19 | 126 | 121 | 26.8 |
| C | 1 | 80 | 356 | 6.85 | 128 | 121 | 34.3 |
| C | 1 | 81 | 354 | 6.79 | 128 | 121 | 34.3 |
| C | 9 | 209 | 346 | 6.56 | 128 | 121 | 34.3 |
| D | 4 | 246 | 299 | 5.94 | 115 | 106 | 32.5 |
| D | 10 | 189 | 292 | 5.72 | 115 | 106 | 32.5 |
| D | 6 | 231 | 291 | 5.69 | 115 | 106 | 32.5 |
Histogram calculated using DETX and DETY for each event in the final _common_clean file
| Quadrant A | 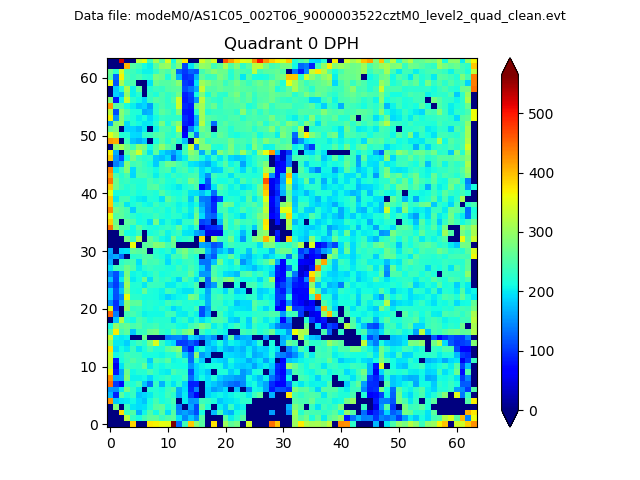 |
 |
Quadrant B |
|---|---|---|---|
| Quadrant D | 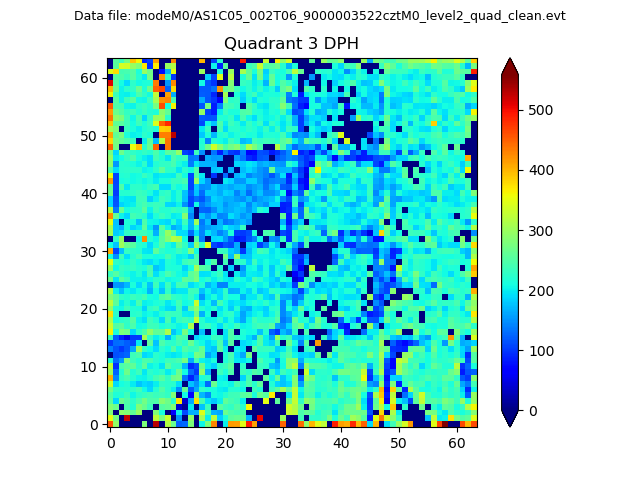 |
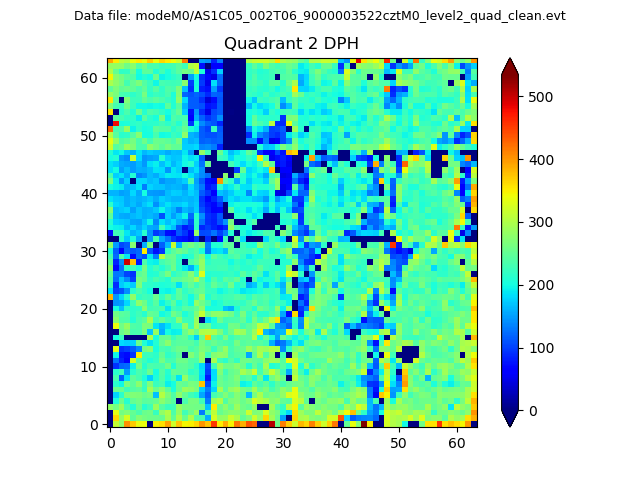 |
Quadrant C |
| Plot type | Count rate plots | Images |
|---|---|---|
| Comparison with Poisson distribution Blue bars denote a histogram of data divided into 1 sec bins. Red curve is a Poisson curve with rate = median count rate of data. |
 |
 |
| Quadrant-wise count rates Data is divided into 100 sec bins |
 |
|
| Module-wise count rates for Quadrant A Data is divided into 100 sec bins |
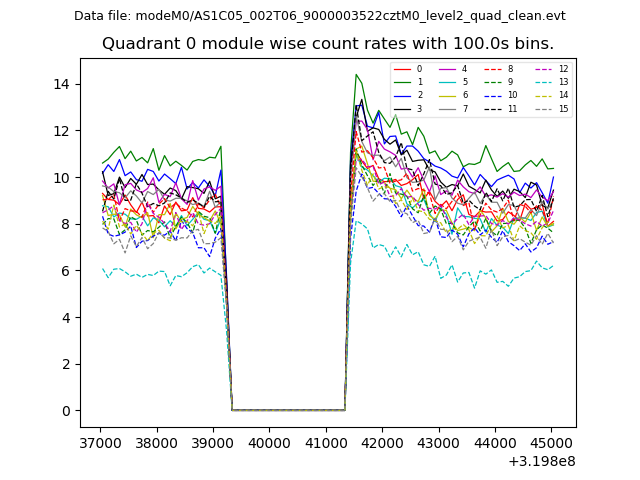 |
 |
| Module-wise count rates for Quadrant B Data is divided into 100 sec bins |
 |
 |
| Module-wise count rates for Quadrant C Data is divided into 100 sec bins |
 |
 |
| Module-wise count rates for Quadrant D Data is divided into 100 sec bins |
 |
 |
| Parameter | Plot |
|---|---|
| CZT HV Monitor |  |
| D_VDD |  |
| Temperature 1 |  |
| Veto HV Monitor |  |
| Veto LLD |  |
| Alpha Counter |  |
| _CPM_Rate |  |
| CZT Counter |  |
| +2.5 Volts monitor |  |
| +5 Volts monitor |  |
| _ROLL_ROT |  |
| _Roll_DEC |  |
| _Roll_RA |  |
| Veto Counter |  |