| Param | Original file | Final file |
|---|---|---|
| Filename | modeM0/AS1C05_002T06_9000003522_23767cztM0_level2.evt | modeM0/AS1C05_002T06_9000003522_23767cztM0_level2_quad_clean.evt |
| Size (bytes) | 379,071,360 | 78,289,920 |
| Size | 361.5 MB | 74.7 MB |
| Events in quadrant A | 2,192,337 | 517,905 |
| Events in quadrant B | 2,285,766 | 541,169 |
| Events in quadrant C | 2,422,771 | 518,854 |
| Events in quadrant D | 4,284,153 | 487,210 |
| Mode M9 | |||
|---|---|---|---|
| Quadrant | BADHDUFLAG | Total packets | Discarded packets |
| A | 0 | 13 | 0 |
| B | 0 | 13 | 0 |
| C | 0 | 13 | 0 |
| D | 0 | 13 | 0 |
| Mode M0 | |||
|---|---|---|---|
| Quadrant | BADHDUFLAG | Total packets | Discarded packets |
| A | 0 | 9283 | 1 |
| B | 0 | 9562 | 1 |
| C | 0 | 9901 | 1 |
| D | 0 | 15984 | 1 |
| Mode SS | |||
|---|---|---|---|
| Quadrant | BADHDUFLAG | Total packets | Discarded packets |
| A | 0 | 90 | 0 |
| B | 0 | 90 | 0 |
| C | 0 | 90 | 0 |
| D | 0 | 90 | 0 |
| Quadrant | Total seconds | Saturated seconds | Saturation percentage |
|---|---|---|---|
| A | 4340 | 53 | 1.221198% |
| B | 4340 | 67 | 1.543779% |
| C | 4340 | 102 | 2.350230% |
| D | 4340 | 246 | 5.668203% |
Noise dominated data is calculated using 1-second bins in cleaned event files. If a bin has >2000 counts, and if more than 50% of those come from <1% of pixels, then it is considered to be noise-dominated and hence unusable.
| Quadrant | # 1 sec bins | Bins with >0 counts | Bins with >2000 counts | High rate bins dominated by noise | Noise dominated (total time) | Noise dominated (detector-on time) | Marked lightcurve |
|---|---|---|---|---|---|---|---|
| A | 5690 | 4340 | 0 | 0 | 0.00% | 0.00% | 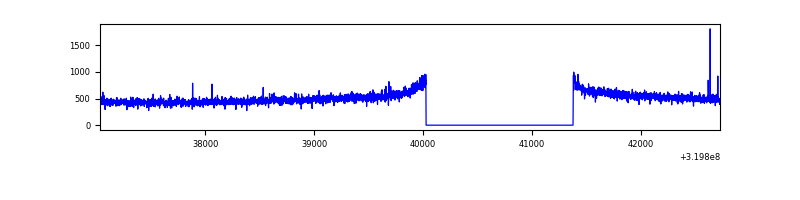 |
| B | 5690 | 4340 | 2 | 2 | 0.04% | 0.05% | 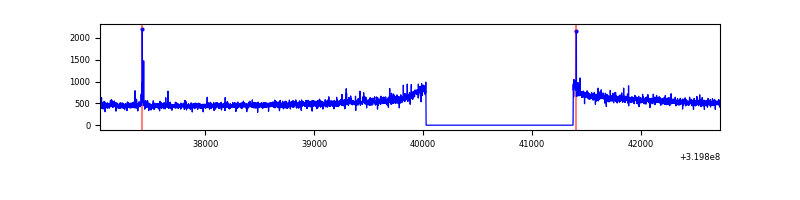 |
| C | 5690 | 4340 | 4 | 4 | 0.07% | 0.09% | 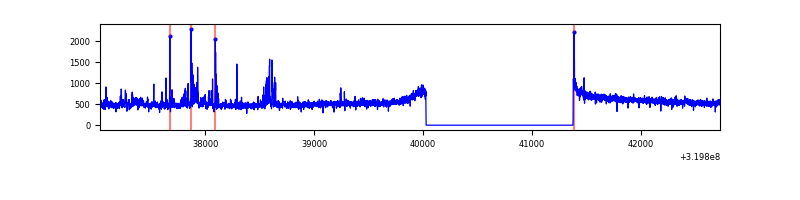 |
| D | 5689 | 4339 | 170 | 170 | 2.99% | 3.92% | 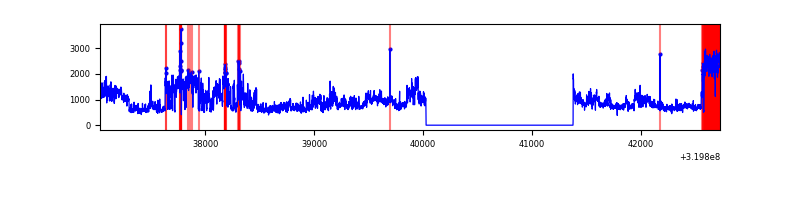 |
Top three noisy pixels from each quadrant. If the there are fewer than three noisy pixels in the level2.evt file, extra rows are filled as -1
| Pixel properties | Quadrant properties | ||||||
|---|---|---|---|---|---|---|---|
| Quadrant | DetID | PixID | Counts | Sigma | Mean | Median | Sigma |
| A | 13 | 254 | 5990 | 47.41 | 568 | 557 | 114.6 |
| A | 0 | 226 | 4854 | 37.5 | 568 | 557 | 114.6 |
| A | 3 | 137 | 4729 | 36.41 | 568 | 557 | 114.6 |
| B | 12 | 111 | 12693 | 111.58 | 573 | 559 | 108.7 |
| B | 10 | 247 | 12424 | 109.11 | 573 | 559 | 108.7 |
| B | 11 | 111 | 11279 | 98.58 | 573 | 559 | 108.7 |
| C | 7 | 247 | 149226 | 1143.07 | 556 | 560 | 130.1 |
| C | 14 | 238 | 87952 | 671.94 | 556 | 560 | 130.1 |
| C | 1 | 16 | 11895 | 87.15 | 556 | 560 | 130.1 |
| D | 13 | 174 | 826295 | 6127.61 | 551 | 533 | 134.8 |
| D | 1 | 52 | 717711 | 5321.86 | 551 | 533 | 134.8 |
| D | 7 | 238 | 307042 | 2274.47 | 551 | 533 | 134.8 |
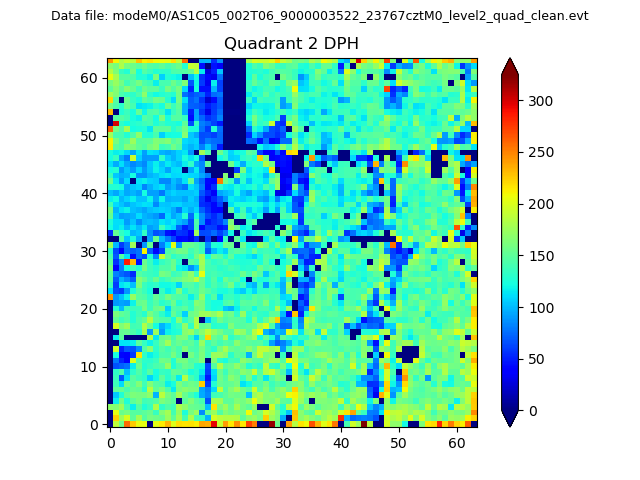
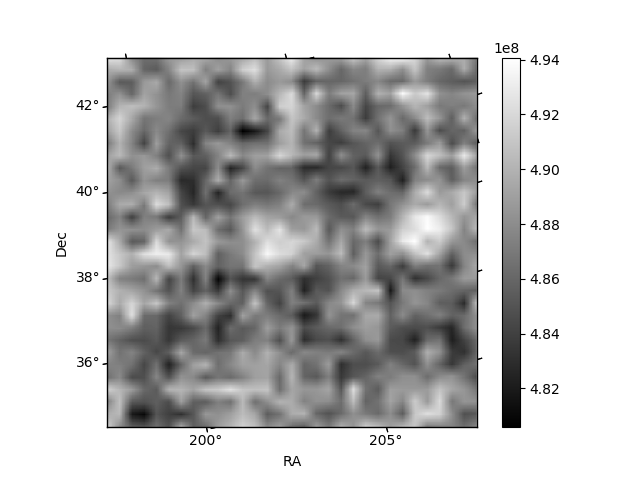
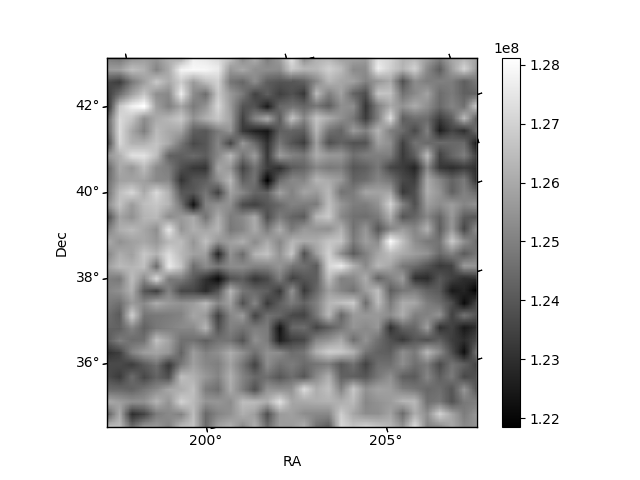
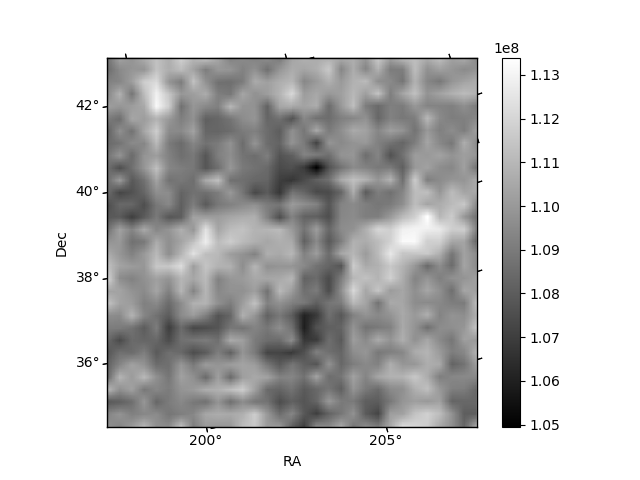
Histogram calculated using DETX and DETY for each event in the final _common_clean file
| Quadrant A | 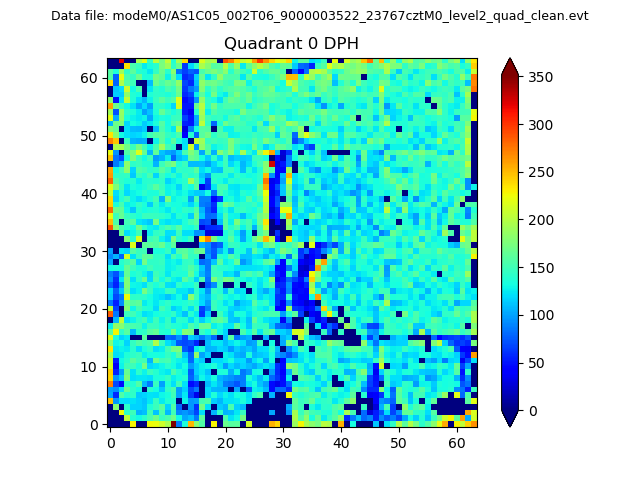 |
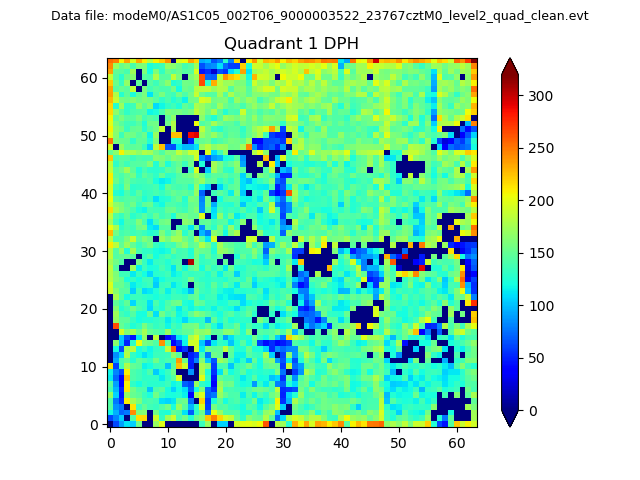 |
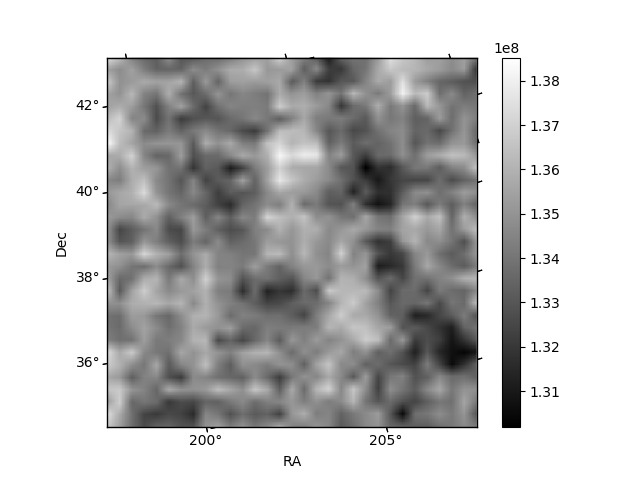
Quadrant B |
|---|---|---|---|
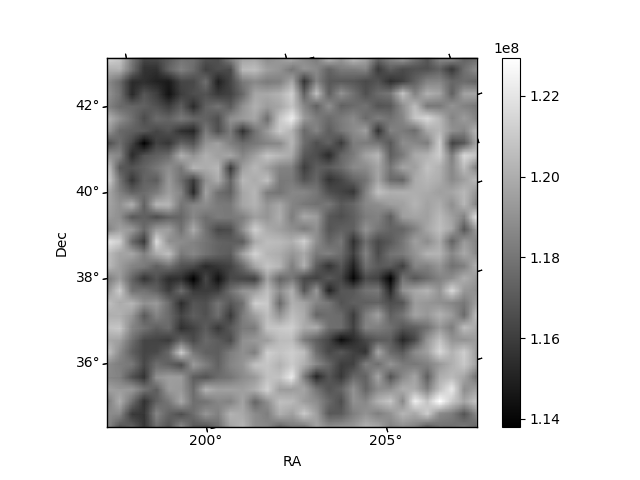
| Quadrant D | 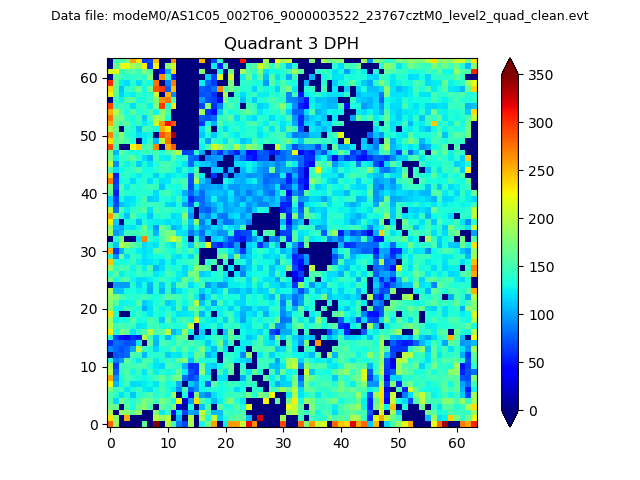 |
 |
Quadrant C |
| Plot type | Count rate plots | Images |
|---|---|---|
| Comparison with Poisson distribution Blue bars denote a histogram of data divided into 1 sec bins. Red curve is a Poisson curve with rate = median count rate of data. |
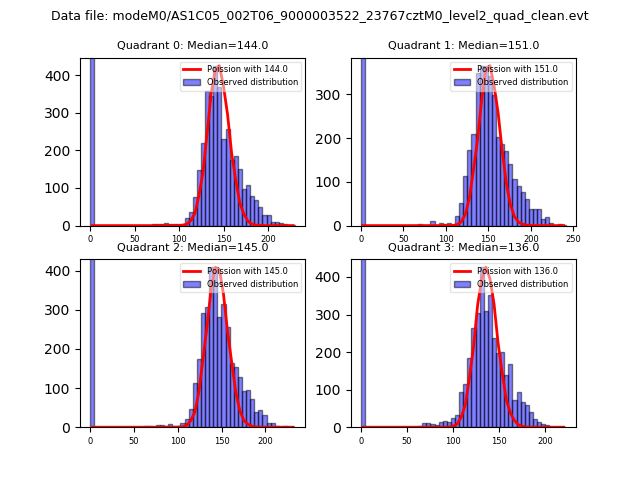 |
 |
| Quadrant-wise count rates Data is divided into 100 sec bins |
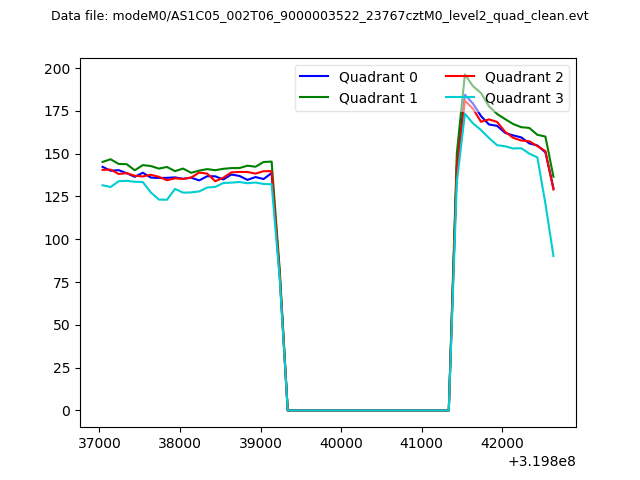 |
|
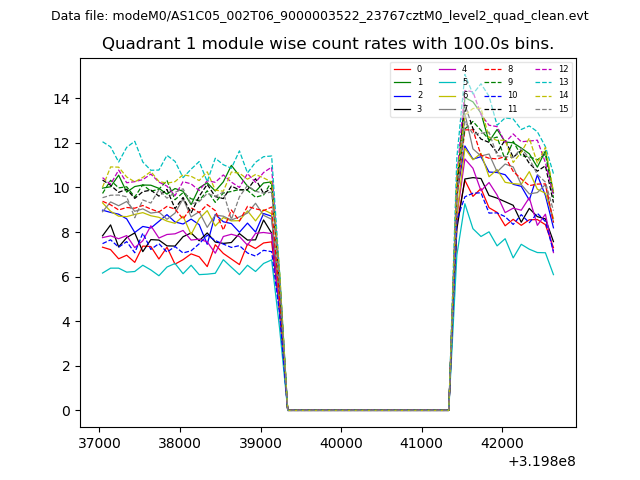
| Module-wise count rates for Quadrant A Data is divided into 100 sec bins |
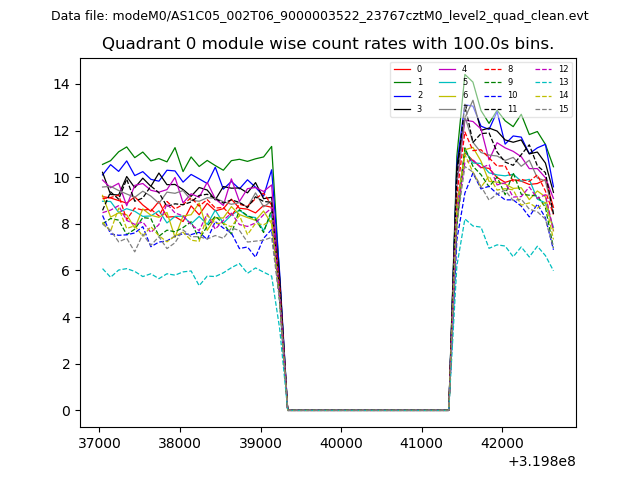 |
 |
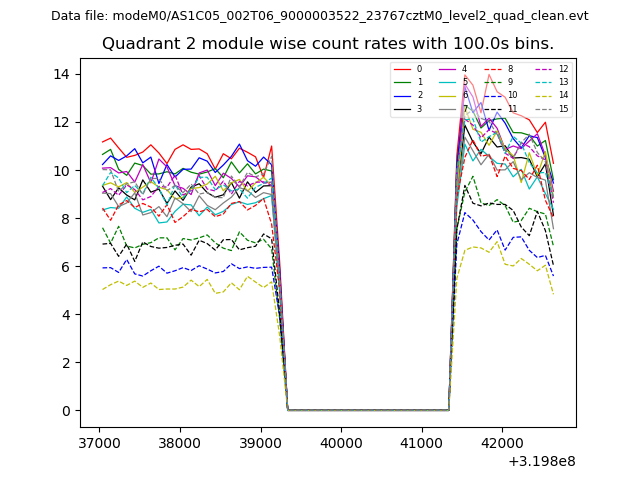
| Module-wise count rates for Quadrant B Data is divided into 100 sec bins |
 |
 |
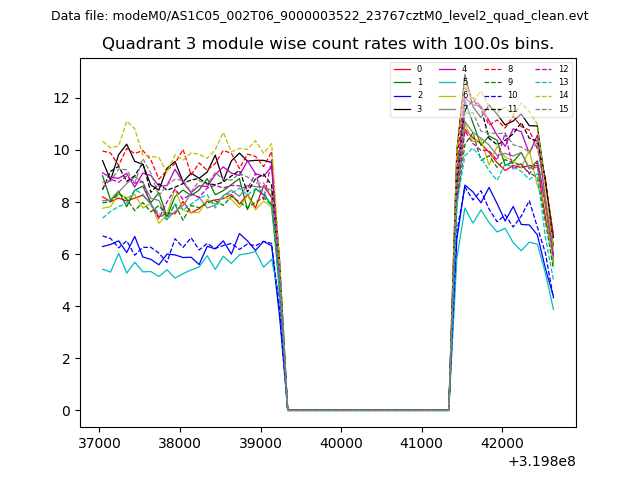
| Module-wise count rates for Quadrant C Data is divided into 100 sec bins |
 |
 |
| Module-wise count rates for Quadrant D Data is divided into 100 sec bins |
 |
 |
| Parameter | Plot |
|---|---|
| CZT HV Monitor | 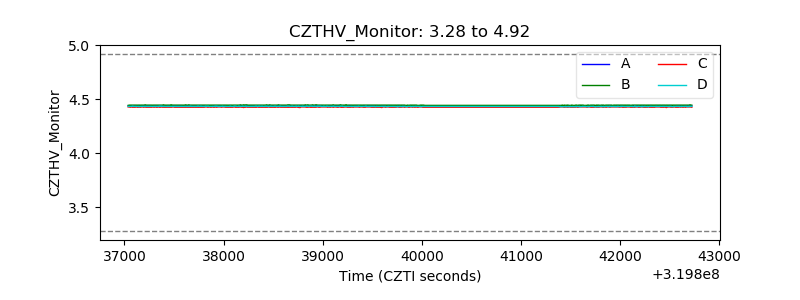 |
| D_VDD | 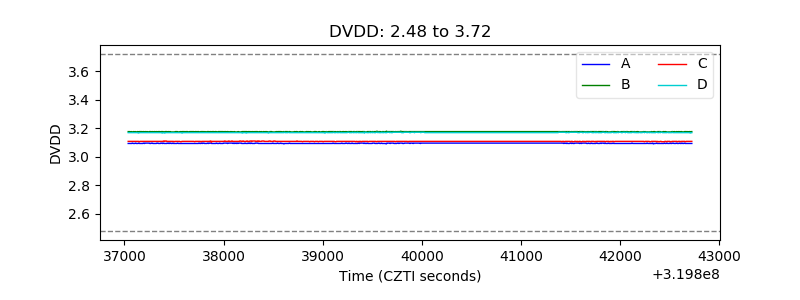 |
| Temperature 1 | 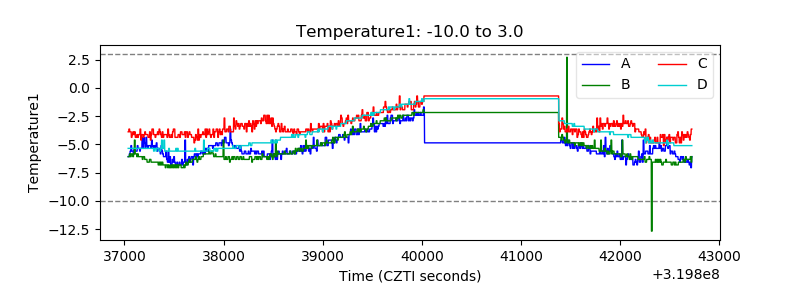 |
| Veto HV Monitor | 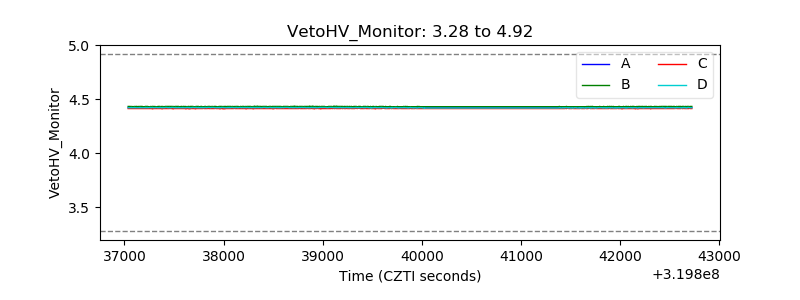 |
| Veto LLD | 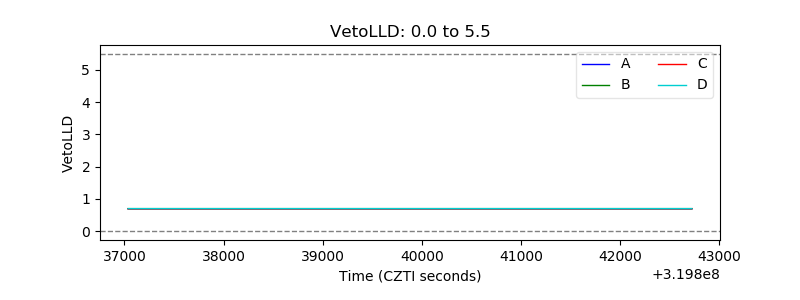 |
| Alpha Counter | 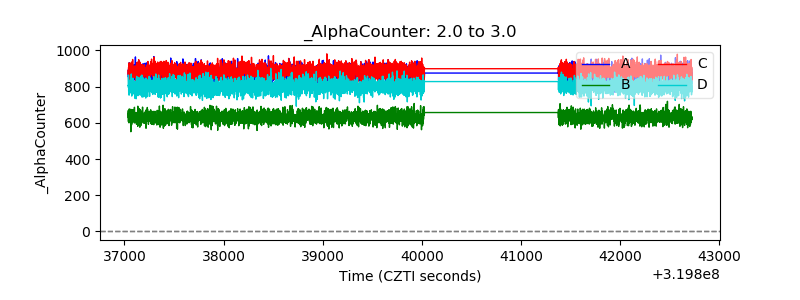 |
| _CPM_Rate | 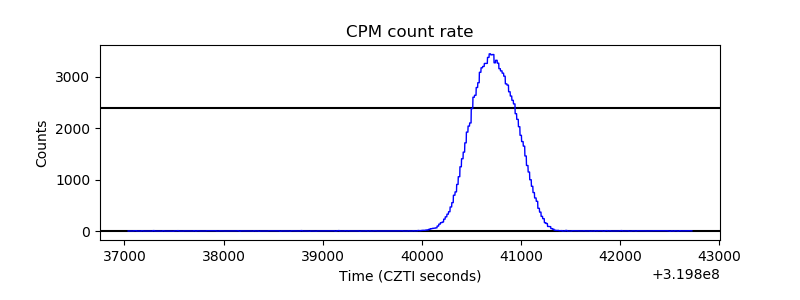 |
| CZT Counter | 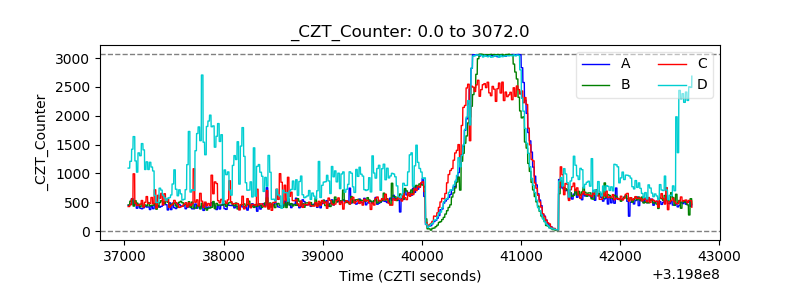 |
| +2.5 Volts monitor | 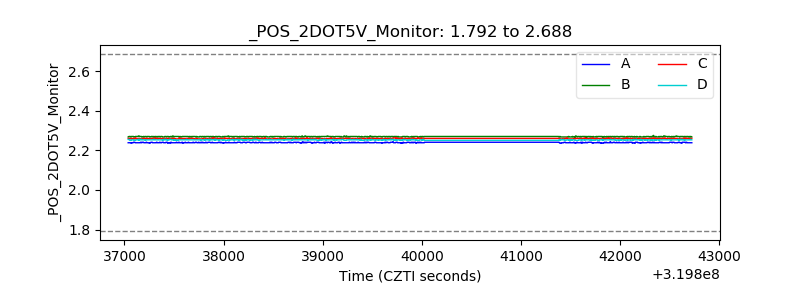 |
| +5 Volts monitor | 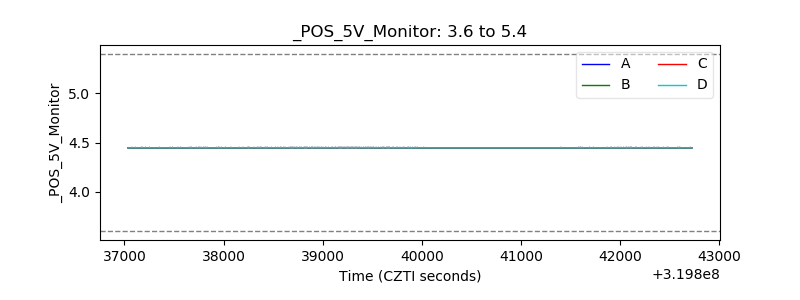 |
| _ROLL_ROT | 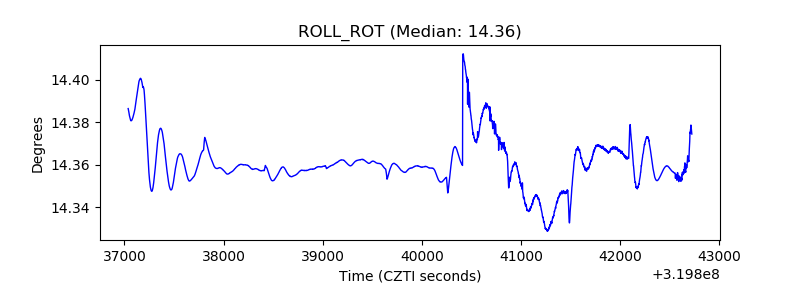 |
| _Roll_DEC | 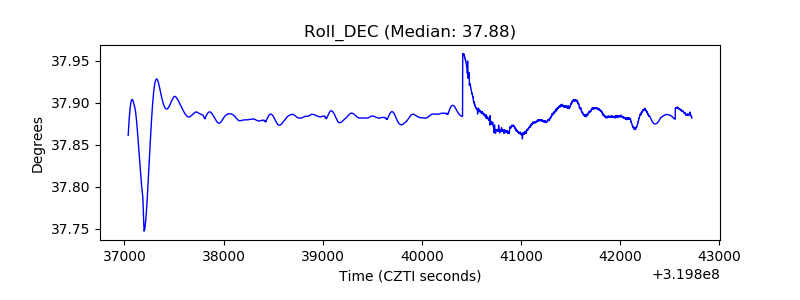 |
| _Roll_RA | 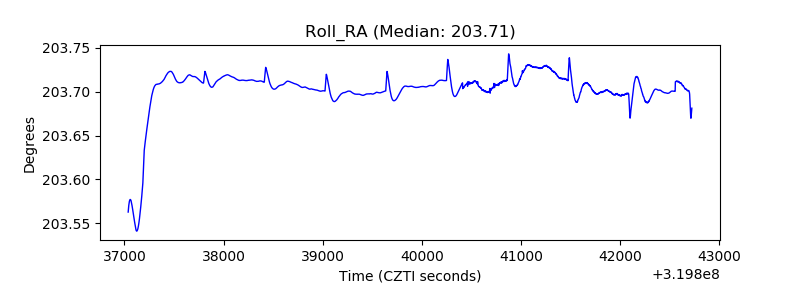 |
| Veto Counter | 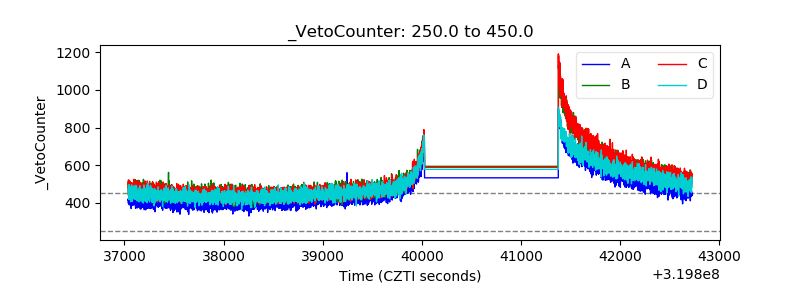 |