| Param | Original file | Final file |
|---|---|---|
| Filename | modeM0/AS1C05_002T06_9000003522_23768cztM0_level2.evt | modeM0/AS1C05_002T06_9000003522_23768cztM0_level2_quad_clean.evt |
| Size (bytes) | 381,142,080 | 80,421,120 |
| Size | 363.5 MB | 76.7 MB |
| Events in quadrant A | 2,127,374 | 537,226 |
| Events in quadrant B | 2,207,413 | 562,501 |
| Events in quadrant C | 2,226,191 | 541,784 |
| Events in quadrant D | 4,684,932 | 486,569 |
| Mode M9 | |||
|---|---|---|---|
| Quadrant | BADHDUFLAG | Total packets | Discarded packets |
| A | 0 | 2 | 0 |
| B | 0 | 3 | 0 |
| C | 0 | 3 | 0 |
| D | 0 | 3 | 0 |
| Mode M0 | |||
|---|---|---|---|
| Quadrant | BADHDUFLAG | Total packets | Discarded packets |
| A | 0 | 9115 | 1 |
| B | 0 | 9379 | 1 |
| C | 0 | 9372 | 1 |
| D | 0 | 17221 | 1 |
| Mode SS | |||
|---|---|---|---|
| Quadrant | BADHDUFLAG | Total packets | Discarded packets |
| A | 0 | 88 | 0 |
| B | 0 | 88 | 0 |
| C | 0 | 88 | 0 |
| D | 0 | 88 | 0 |
| Quadrant | Total seconds | Saturated seconds | Saturation percentage |
|---|---|---|---|
| A | 4363 | 5 | 0.114600% |
| B | 4363 | 15 | 0.343800% |
| C | 4363 | 32 | 0.733440% |
| D | 4363 | 598 | 13.706165% |
Noise dominated data is calculated using 1-second bins in cleaned event files. If a bin has >2000 counts, and if more than 50% of those come from <1% of pixels, then it is considered to be noise-dominated and hence unusable.
| Quadrant | # 1 sec bins | Bins with >0 counts | Bins with >2000 counts | High rate bins dominated by noise | Noise dominated (total time) | Noise dominated (detector-on time) | Marked lightcurve |
|---|---|---|---|---|---|---|---|
| A | 4363 | 4363 | 0 | 0 | 0.00% | 0.00% | 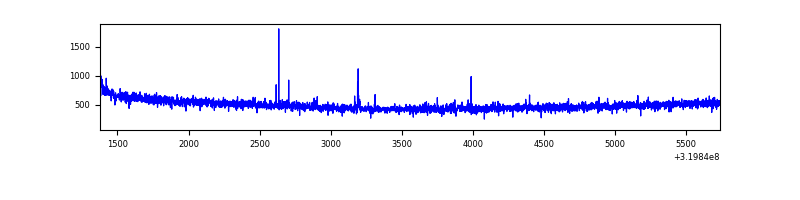 |
| B | 4363 | 4363 | 1 | 1 | 0.02% | 0.02% | 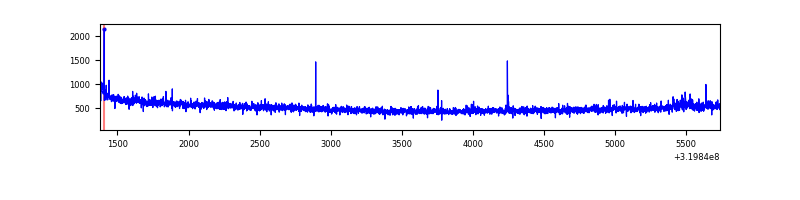 |
| C | 4363 | 4363 | 1 | 1 | 0.02% | 0.02% | 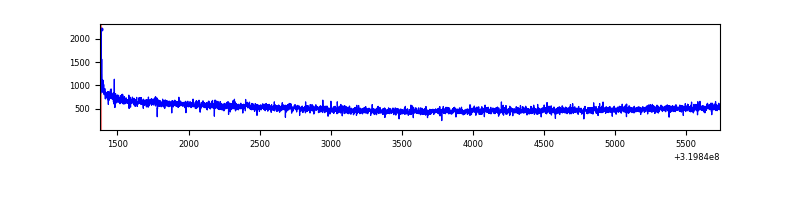 |
| D | 4363 | 4363 | 679 | 679 | 15.56% | 15.56% | 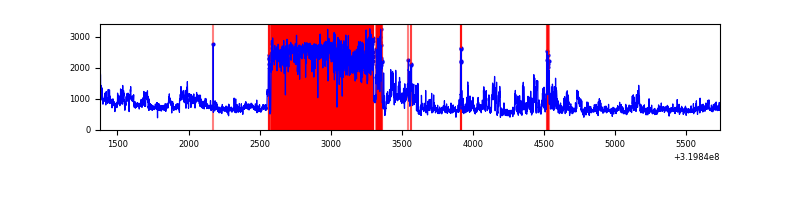 |
Top three noisy pixels from each quadrant. If the there are fewer than three noisy pixels in the level2.evt file, extra rows are filled as -1
| Pixel properties | Quadrant properties | ||||||
|---|---|---|---|---|---|---|---|
| Quadrant | DetID | PixID | Counts | Sigma | Mean | Median | Sigma |
| A | 8 | 255 | 9558 | 82.28 | 549 | 542 | 109.6 |
| A | 13 | 254 | 6132 | 51.01 | 549 | 542 | 109.6 |
| A | 0 | 226 | 4711 | 38.05 | 549 | 542 | 109.6 |
| B | 0 | 189 | 16977 | 159.37 | 555 | 544 | 103.1 |
| B | 12 | 111 | 12050 | 111.59 | 555 | 544 | 103.1 |
| B | 11 | 111 | 10835 | 99.8 | 555 | 544 | 103.1 |
| C | 14 | 238 | 87200 | 692.84 | 540 | 545 | 125.1 |
| C | 7 | 247 | 13717 | 105.31 | 540 | 545 | 125.1 |
| C | 1 | 16 | 12293 | 93.93 | 540 | 545 | 125.1 |
| D | 13 | 174 | 1889963 | 14937.45 | 521 | 507 | 126.5 |
| D | 1 | 52 | 333729 | 2634.35 | 521 | 507 | 126.5 |
| D | 8 | 195 | 287233 | 2266.77 | 521 | 507 | 126.5 |
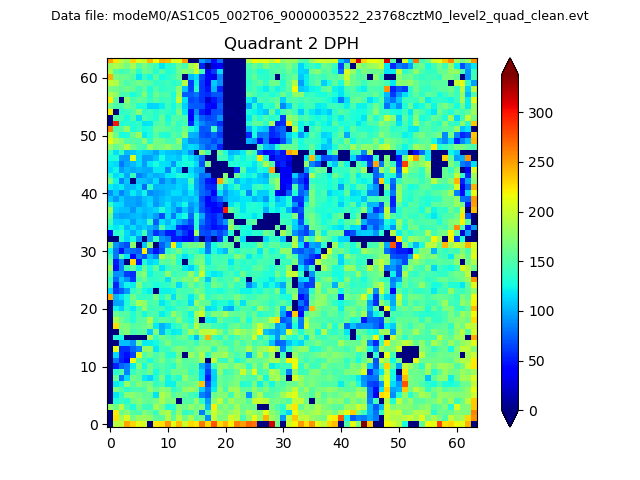
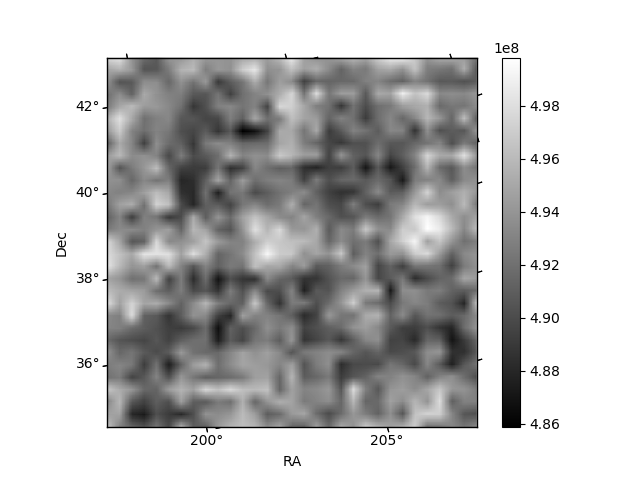
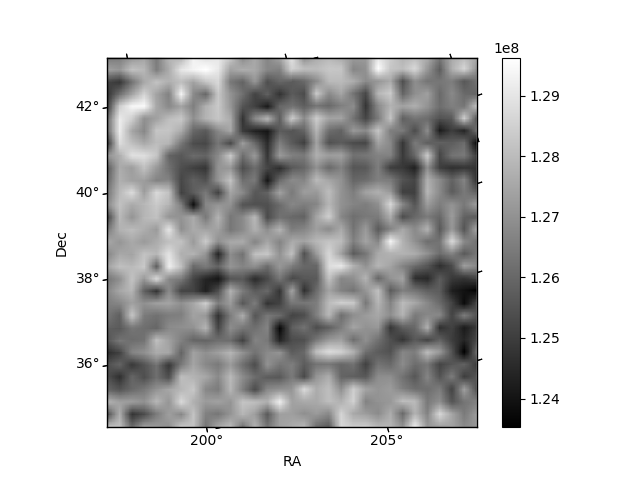
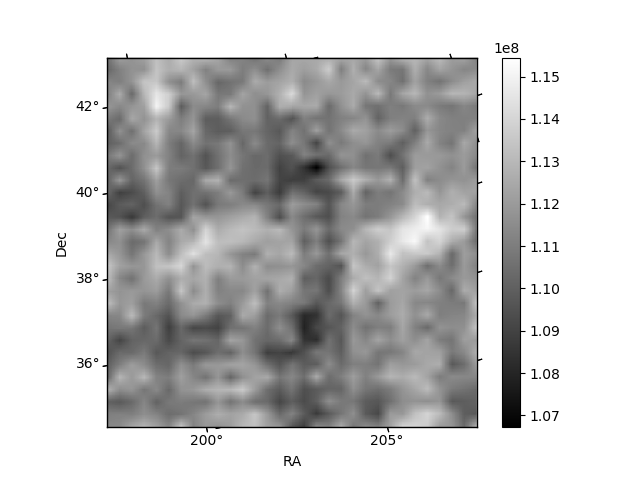
Histogram calculated using DETX and DETY for each event in the final _common_clean file
| Quadrant A | 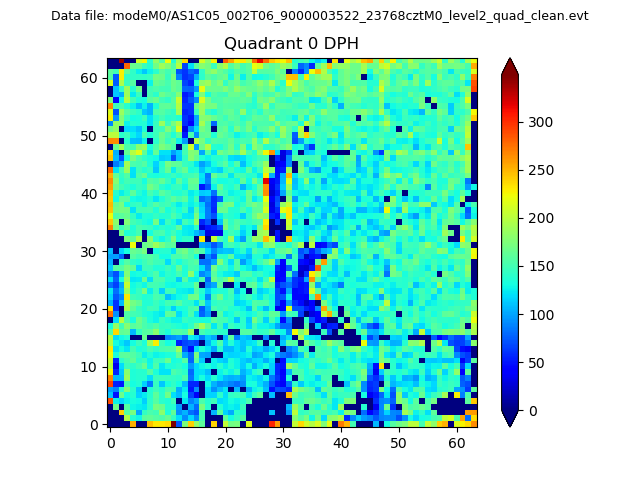 |
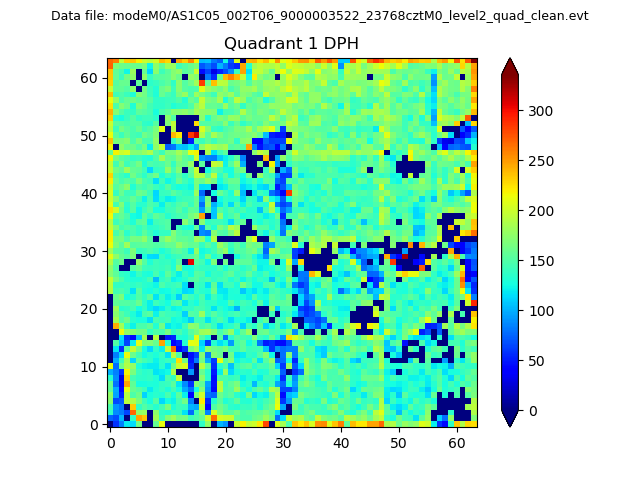 |
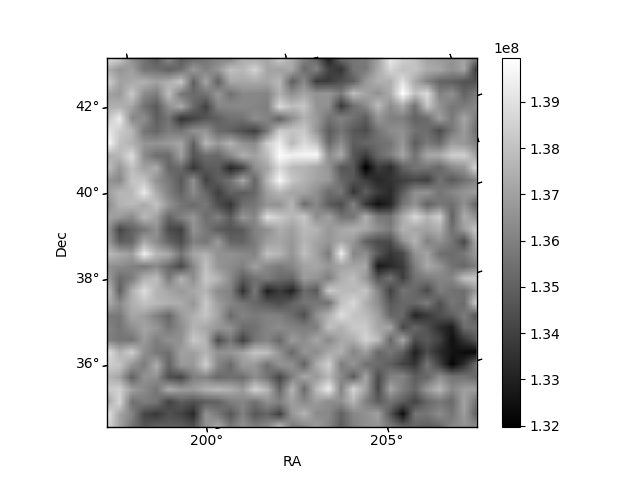
Quadrant B |
|---|---|---|---|
| Quadrant D | 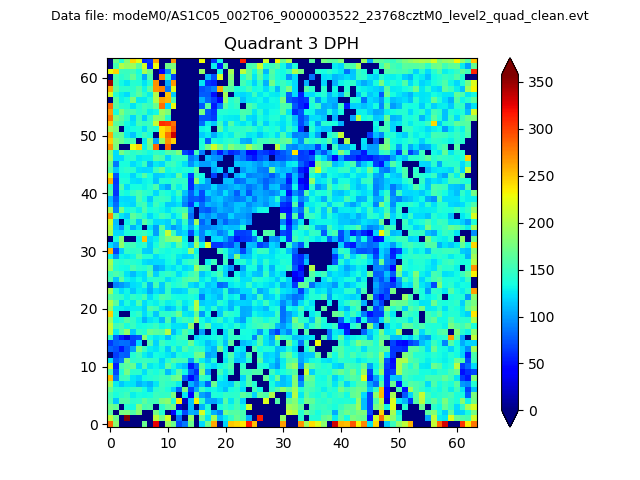 |
 |
Quadrant C |
| Plot type | Count rate plots | Images |
|---|---|---|
| Comparison with Poisson distribution Blue bars denote a histogram of data divided into 1 sec bins. Red curve is a Poisson curve with rate = median count rate of data. |
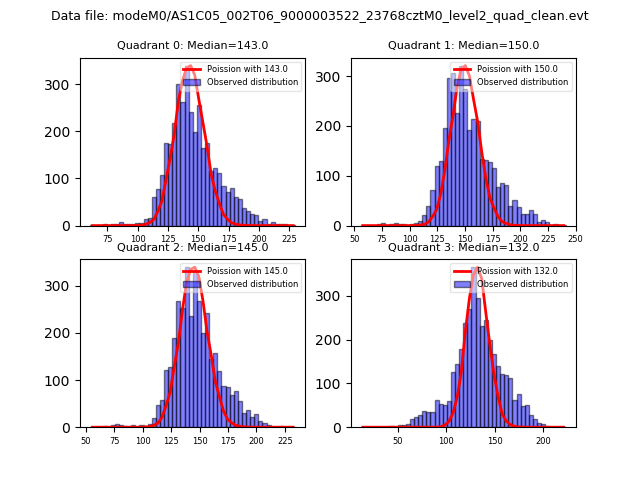 |
 |
| Quadrant-wise count rates Data is divided into 100 sec bins |
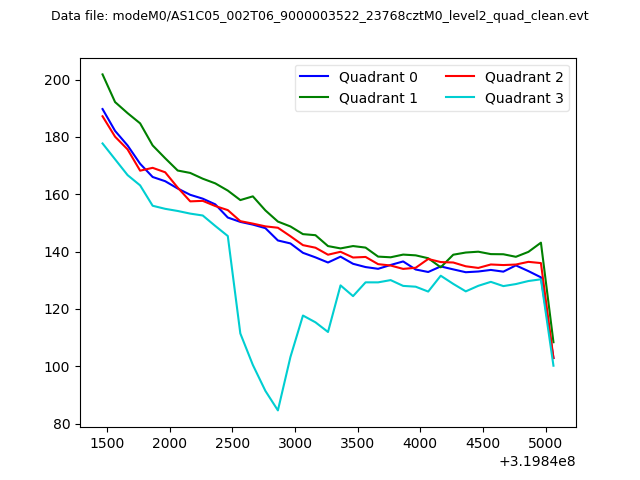 |
|
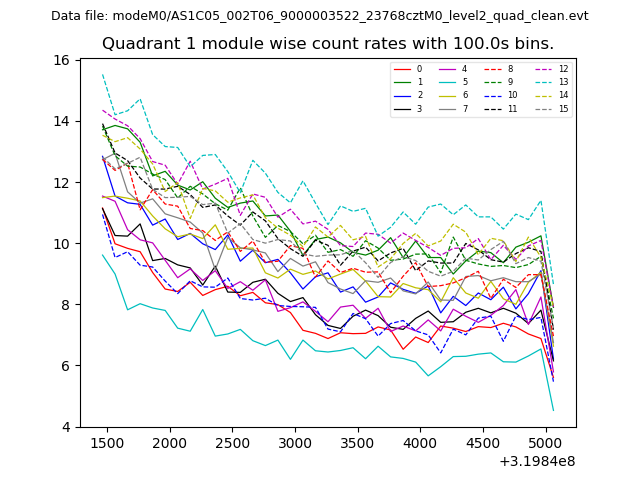
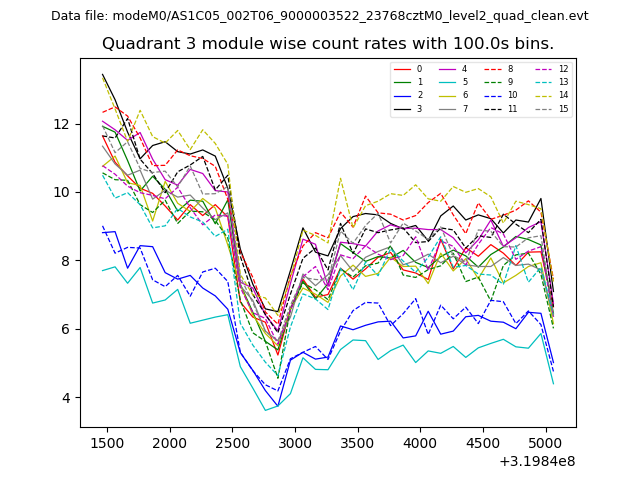
| Module-wise count rates for Quadrant A Data is divided into 100 sec bins |
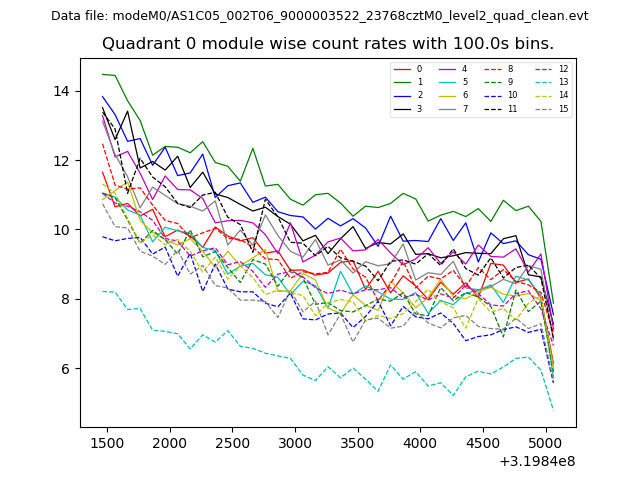 |
 |
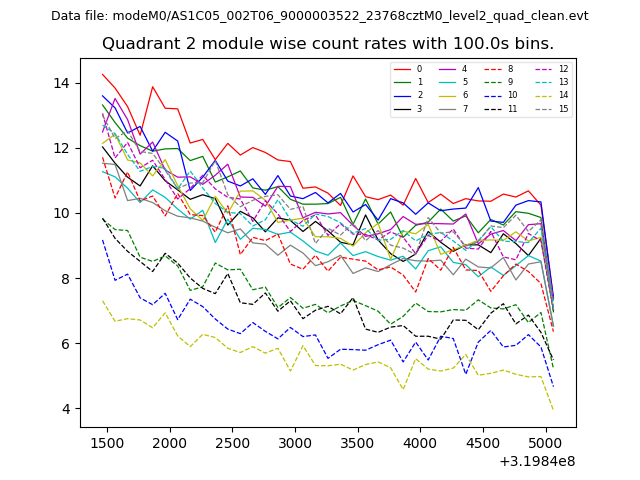
| Module-wise count rates for Quadrant B Data is divided into 100 sec bins |
 |
 |
| Module-wise count rates for Quadrant C Data is divided into 100 sec bins |
 |
 |
| Module-wise count rates for Quadrant D Data is divided into 100 sec bins |
 |
 |
| Parameter | Plot |
|---|---|
| CZT HV Monitor | 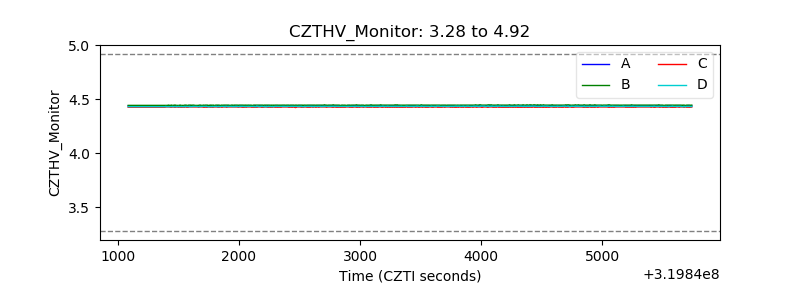 |
| D_VDD | 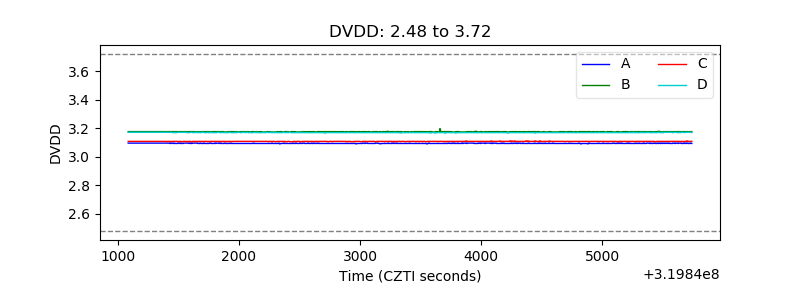 |
| Temperature 1 | 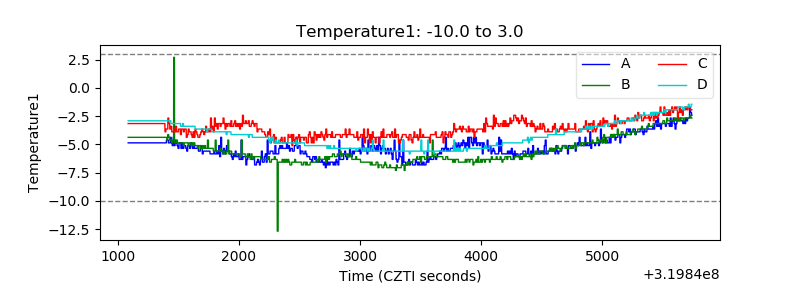 |
| Veto HV Monitor | 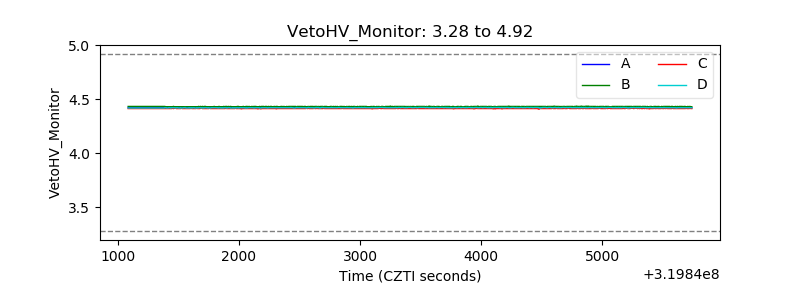 |
| Veto LLD | 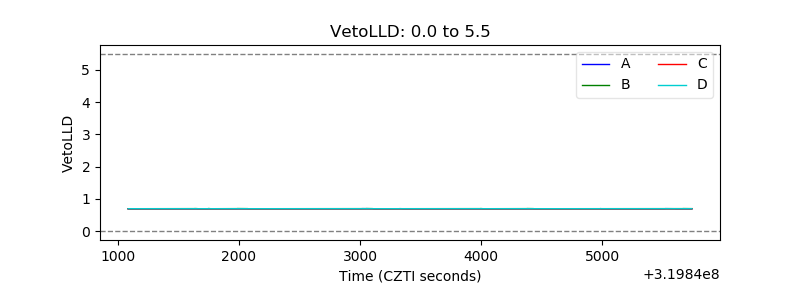 |
| Alpha Counter | 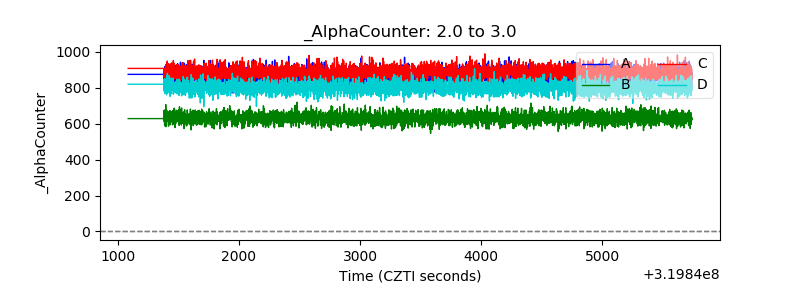 |
| _CPM_Rate | 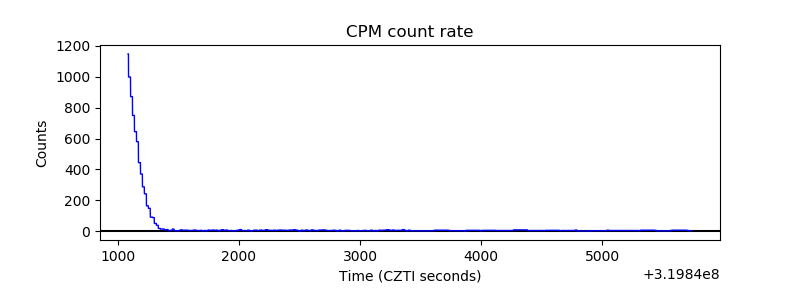 |
| CZT Counter | 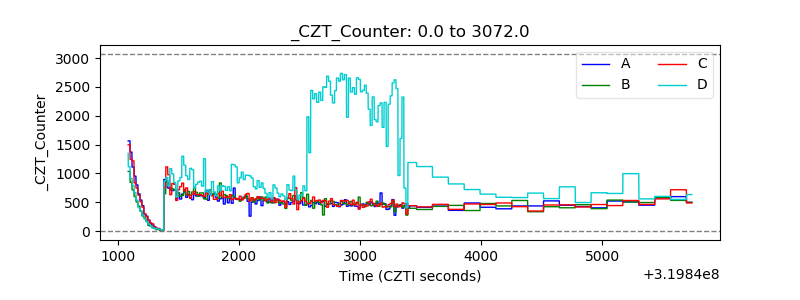 |
| +2.5 Volts monitor |  |
| +5 Volts monitor |  |
| _ROLL_ROT | 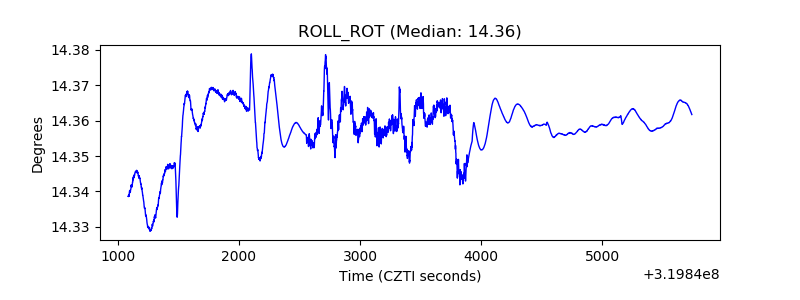 |
| _Roll_DEC | 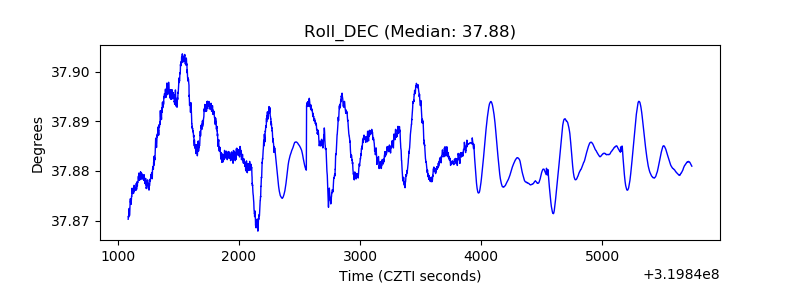 |
| _Roll_RA | 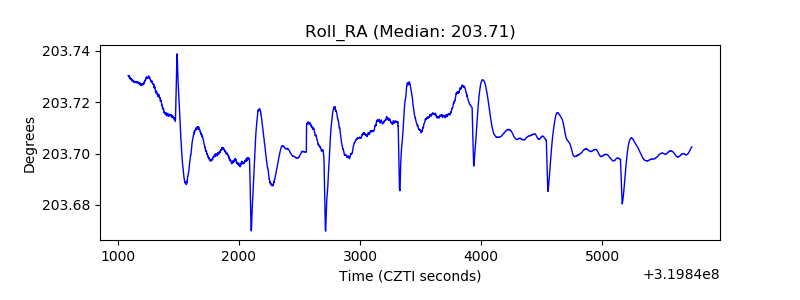 |
| Veto Counter | 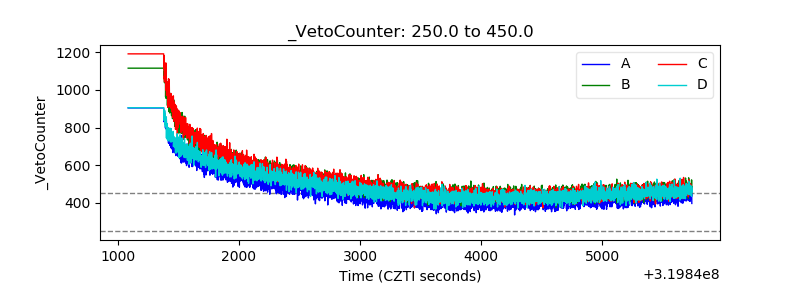 |