| Param | Original file | Final file |
|---|---|---|
| Filename | modeM0/AS1T03_180T01_9000003524cztM0_level2.fits | modeM0/AS1T03_180T01_9000003524cztM0_level2_quad_clean.evt |
| Size (bytes) | 779,820,480 | 699,266,880 |
| Size | 743.7 MB | 666.9 MB |
| Events in quadrant A | 4,853,554 | 4,137,363 |
| Events in quadrant B | 4,637,988 | 4,165,325 |
| Events in quadrant C | 4,735,650 | 3,981,687 |
| Events in quadrant D | 4,104,574 | 3,607,034 |
| Mode M0 | |||
|---|---|---|---|
| Quadrant | BADHDUFLAG | Total packets | Discarded packets |
| A | 0 | 161596 | 0 |
| B | 0 | 170068 | 0 |
| C | 0 | 162347 | 0 |
| D | 0 | 203352 | 0 |
| Mode SS | |||
|---|---|---|---|
| Quadrant | BADHDUFLAG | Total packets | Discarded packets |
| A | 0 | 1570 | 0 |
| B | 0 | 1570 | 0 |
| C | 0 | 1570 | 0 |
| D | 0 | 1570 | 0 |
| Mode M9 | |||
|---|---|---|---|
| Quadrant | BADHDUFLAG | Total packets | Discarded packets |
| A | 0 | 127 | 0 |
| B | 0 | 127 | 0 |
| C | 0 | 127 | 0 |
| D | 0 | 127 | 0 |
| Quadrant | Total seconds | Saturated seconds | Saturation percentage |
|---|---|---|---|
| A | 77066 | 950 | 1.232710% |
| B | 77066 | 1644 | 2.133236% |
| C | 77066 | 1431 | 1.856850% |
| D | 77066 | 1997 | 2.591285% |
Noise dominated data is calculated using 1-second bins in cleaned event files. If a bin has >2000 counts, and if more than 50% of those come from <1% of pixels, then it is considered to be noise-dominated and hence unusable.
| Quadrant | # 1 sec bins | Bins with >0 counts | Bins with >2000 counts | High rate bins dominated by noise | Noise dominated (total time) | Noise dominated (detector-on time) | Marked lightcurve |
|---|---|---|---|---|---|---|---|
| A | 89166 | 77058 | 0 | 0 | 0.00% | 0.00% |  |
| B | 89166 | 77049 | 0 | 0 | 0.00% | 0.00% | 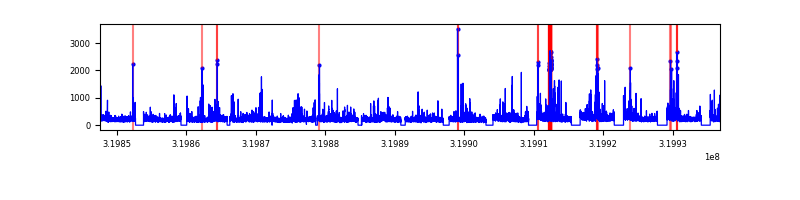 |
| C | 89166 | 77054 | 0 | 0 | 0.00% | 0.00% |  |
| D | 89166 | 77013 | 0 | 0 | 0.00% | 0.00% |  |
Top three noisy pixels from each quadrant. If the there are fewer than three noisy pixels in the level2.evt file, extra rows are filled as -1
| Pixel properties | Quadrant properties | ||||||
|---|---|---|---|---|---|---|---|
| Quadrant | DetID | PixID | Counts | Sigma | Mean | Median | Sigma |
| A | 0 | 29 | 4629 | 11.21 | 1263 | 1190 | 306.7 |
| A | 7 | 110 | 3820 | 8.57 | 1263 | 1190 | 306.7 |
| A | 9 | 19 | 3630 | 7.95 | 1263 | 1190 | 306.7 |
| B | 2 | 9 | 3632 | 10.25 | 1229 | 1176 | 239.7 |
| B | 2 | 8 | 3050 | 7.82 | 1229 | 1176 | 239.7 |
| B | 5 | 128 | 3040 | 7.78 | 1229 | 1176 | 239.7 |
| C | 1 | 80 | 3669 | 7.83 | 1250 | 1170 | 319.2 |
| C | 1 | 81 | 3648 | 7.76 | 1250 | 1170 | 319.2 |
| C | 9 | 209 | 3252 | 6.52 | 1250 | 1170 | 319.2 |
| D | 6 | 67 | 2899 | 5.88 | 1171 | 1069 | 311.2 |
| D | 7 | 3 | 2879 | 5.82 | 1171 | 1069 | 311.2 |
| D | 3 | 14 | 2875 | 5.8 | 1171 | 1069 | 311.2 |
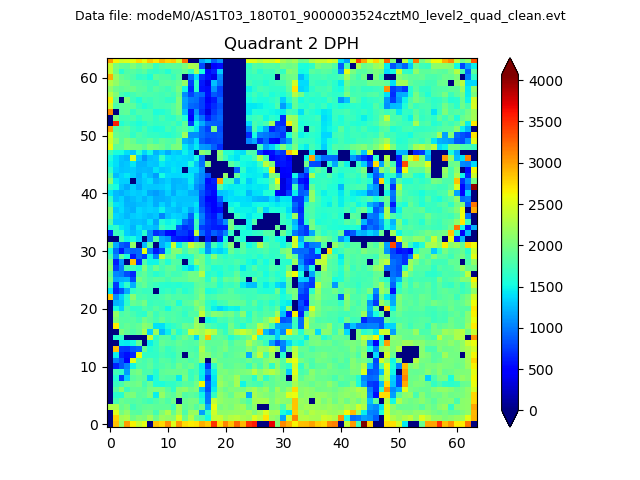
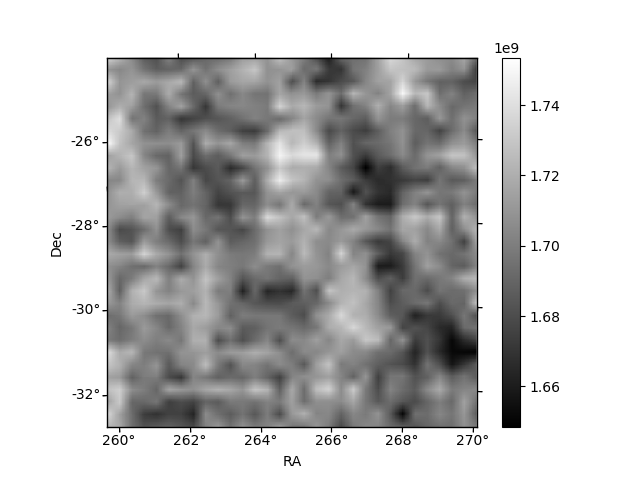
Histogram calculated using DETX and DETY for each event in the final _common_clean file
| Quadrant A | 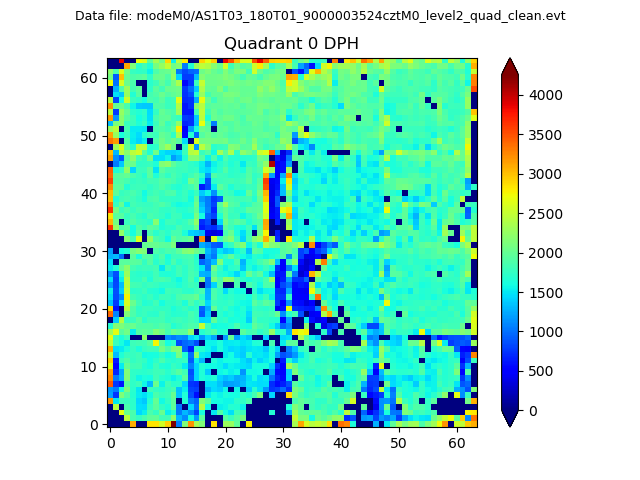 |
 |
Quadrant B |
|---|---|---|---|
| Quadrant D | 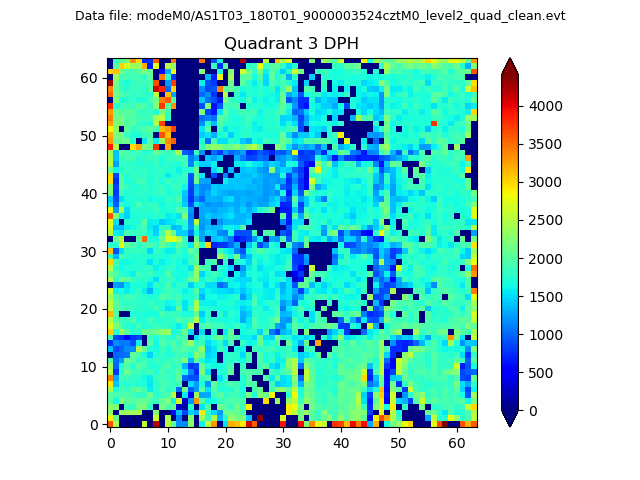 |
 |
Quadrant C |
| Plot type | Count rate plots | Images |
|---|---|---|
| Comparison with Poisson distribution Blue bars denote a histogram of data divided into 1 sec bins. Red curve is a Poisson curve with rate = median count rate of data. |
 |
 |
| Quadrant-wise count rates Data is divided into 100 sec bins |
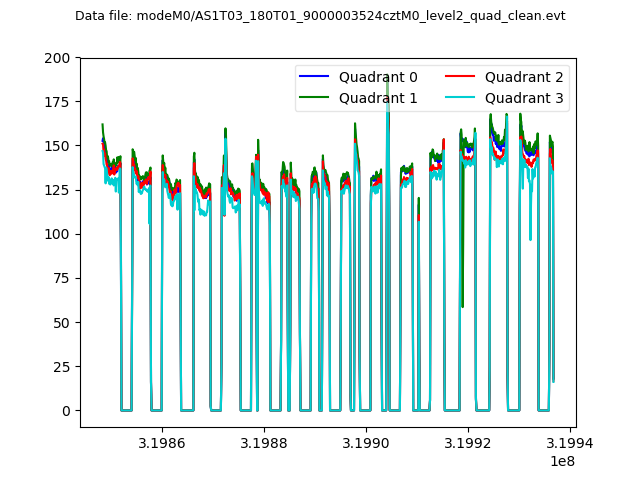 |
|
| Module-wise count rates for Quadrant A Data is divided into 100 sec bins |
 |
 |
| Module-wise count rates for Quadrant B Data is divided into 100 sec bins |
 |
 |
| Module-wise count rates for Quadrant C Data is divided into 100 sec bins |
 |
 |
| Module-wise count rates for Quadrant D Data is divided into 100 sec bins |
 |
 |
| Parameter | Plot |
|---|---|
| CZT HV Monitor |  |
| D_VDD |  |
| Temperature 1 |  |
| Veto HV Monitor |  |
| Veto LLD |  |
| Alpha Counter |  |
| _CPM_Rate |  |
| CZT Counter |  |
| +2.5 Volts monitor | 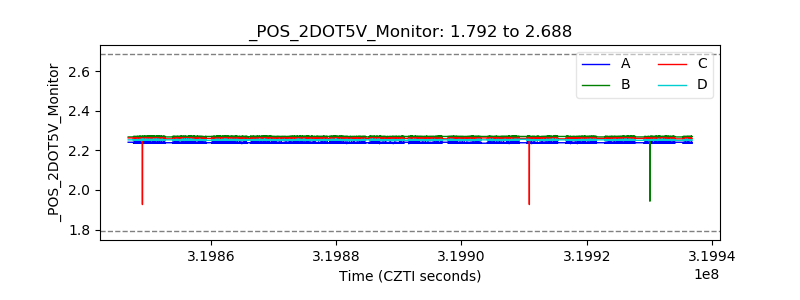 |
| +5 Volts monitor |  |
| _ROLL_ROT |  |
| _Roll_DEC |  |
| _Roll_RA |  |
| Veto Counter |  |