| Param | Original file | Final file |
|---|---|---|
| Filename | modeM0/AS1T03_180T01_9000003524_23768cztM0_level2.evt | modeM0/AS1T03_180T01_9000003524_23768cztM0_level2_quad_clean.evt |
| Size (bytes) | 129,677,760 | 13,541,760 |
| Size | 123.7 MB | 12.9 MB |
| Events in quadrant A | 699,834 | 79,307 |
| Events in quadrant B | 729,069 | 81,830 |
| Events in quadrant C | 754,193 | 77,466 |
| Events in quadrant D | 1,654,603 | 74,646 |
| Mode M0 | |||
|---|---|---|---|
| Quadrant | BADHDUFLAG | Total packets | Discarded packets |
| A | 0 | 2784 | 1 |
| B | 0 | 2914 | 1 |
| C | 0 | 2944 | 1 |
| D | 0 | 5843 | 5 |
| Mode SS | |||
|---|---|---|---|
| Quadrant | BADHDUFLAG | Total packets | Discarded packets |
| A | 0 | 26 | 0 |
| B | 0 | 26 | 0 |
| C | 0 | 26 | 0 |
| D | 0 | 26 | 0 |
| Mode M9 | |||
|---|---|---|---|
| Quadrant | BADHDUFLAG | Total packets | Discarded packets |
| A | 0 | 9 | 0 |
| B | 0 | 9 | 0 |
| C | 0 | 9 | 0 |
| D | 0 | 9 | 0 |
| Quadrant | Total seconds | Saturated seconds | Saturation percentage |
|---|---|---|---|
| A | 1279 | 3 | 0.234558% |
| B | 1279 | 11 | 0.860047% |
| C | 1279 | 47 | 3.674746% |
| D | 1278 | 392 | 30.672926% |
Noise dominated data is calculated using 1-second bins in cleaned event files. If a bin has >2000 counts, and if more than 50% of those come from <1% of pixels, then it is considered to be noise-dominated and hence unusable.
| Quadrant | # 1 sec bins | Bins with >0 counts | Bins with >2000 counts | High rate bins dominated by noise | Noise dominated (total time) | Noise dominated (detector-on time) | Marked lightcurve |
|---|---|---|---|---|---|---|---|
| A | 1279 | 1279 | 0 | 0 | 0.00% | 0.00% | 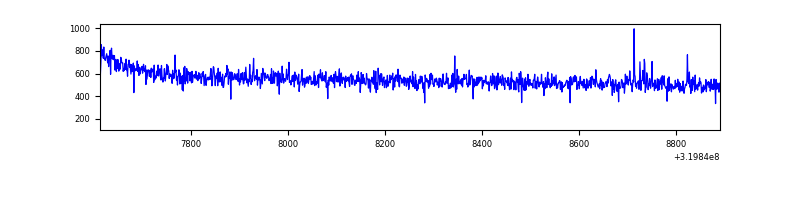 |
| B | 1279 | 1279 | 0 | 0 | 0.00% | 0.00% | 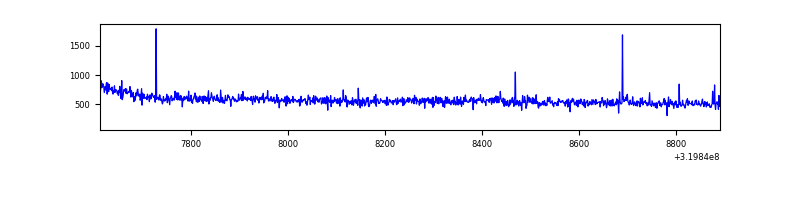 |
| C | 1279 | 1279 | 5 | 5 | 0.39% | 0.39% | 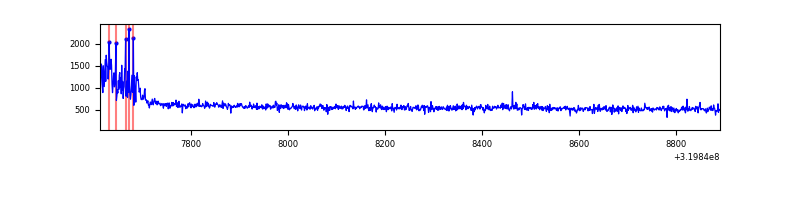 |
| D | 1278 | 1278 | 317 | 317 | 24.80% | 24.80% | 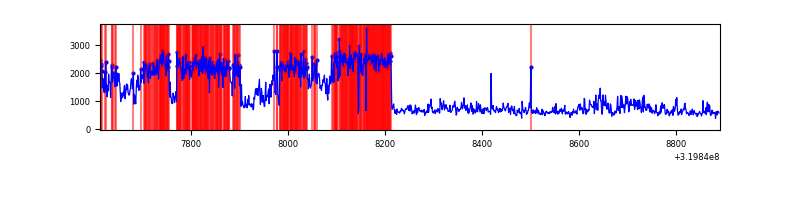 |
Top three noisy pixels from each quadrant. If the there are fewer than three noisy pixels in the level2.evt file, extra rows are filled as -1
| Pixel properties | Quadrant properties | ||||||
|---|---|---|---|---|---|---|---|
| Quadrant | DetID | PixID | Counts | Sigma | Mean | Median | Sigma |
| A | 8 | 255 | 2473 | 60.33 | 181 | 177 | 38.1 |
| A | 13 | 254 | 1960 | 46.85 | 181 | 177 | 38.1 |
| A | 0 | 226 | 1550 | 36.08 | 181 | 177 | 38.1 |
| B | 0 | 229 | 6767 | 183.72 | 182 | 179 | 35.9 |
| B | 12 | 111 | 4002 | 106.61 | 182 | 179 | 35.9 |
| B | 0 | 230 | 3883 | 103.29 | 182 | 179 | 35.9 |
| C | 0 | 10 | 49197 | 1178.59 | 172 | 173 | 41.6 |
| C | 14 | 238 | 27910 | 666.83 | 172 | 173 | 41.6 |
| C | 1 | 16 | 3470 | 79.26 | 172 | 173 | 41.6 |
| D | 13 | 174 | 835438 | 21022.61 | 156 | 152 | 39.7 |
| D | 8 | 195 | 83830 | 2106.02 | 156 | 152 | 39.7 |
| D | 1 | 52 | 69719 | 1750.87 | 156 | 152 | 39.7 |
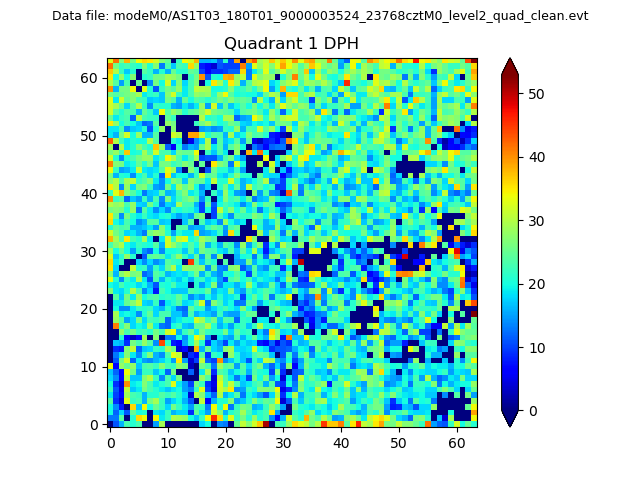
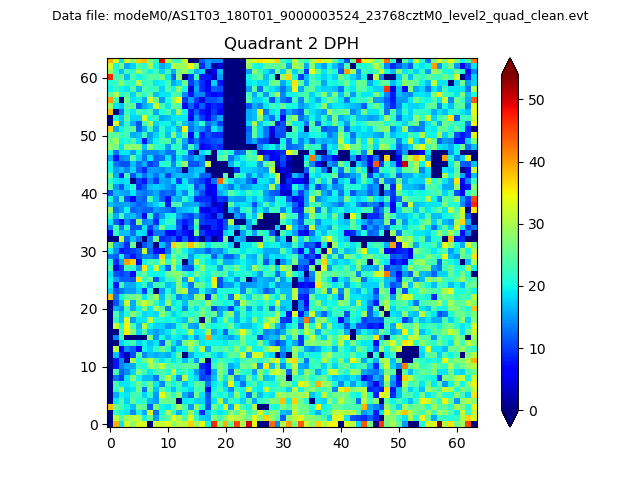
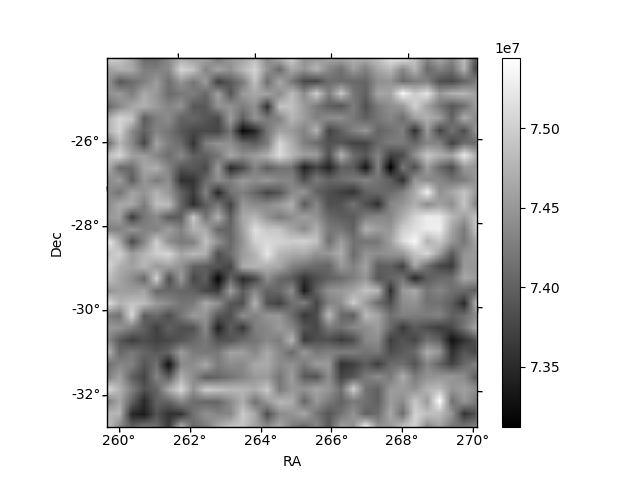
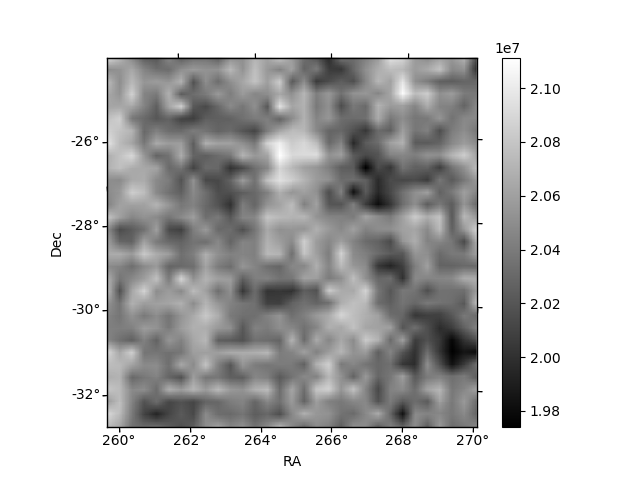
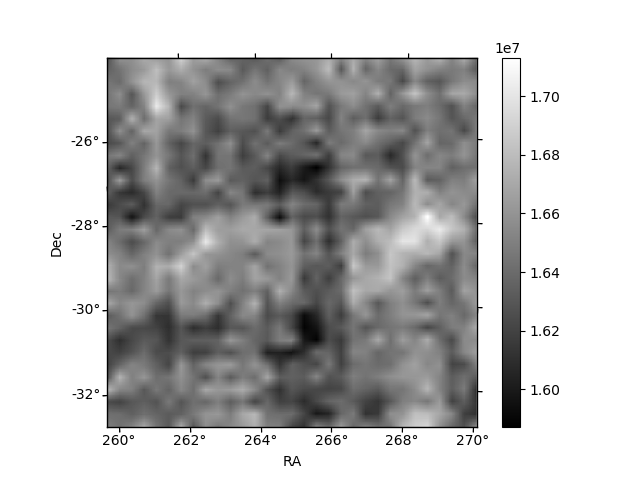
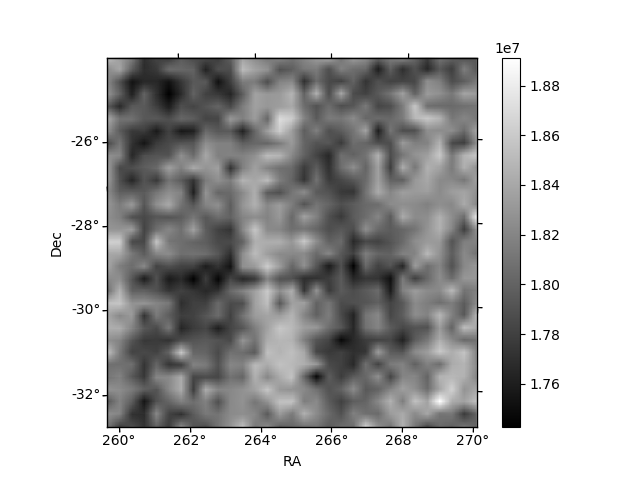
Histogram calculated using DETX and DETY for each event in the final _common_clean file
| Quadrant A |  |
 |
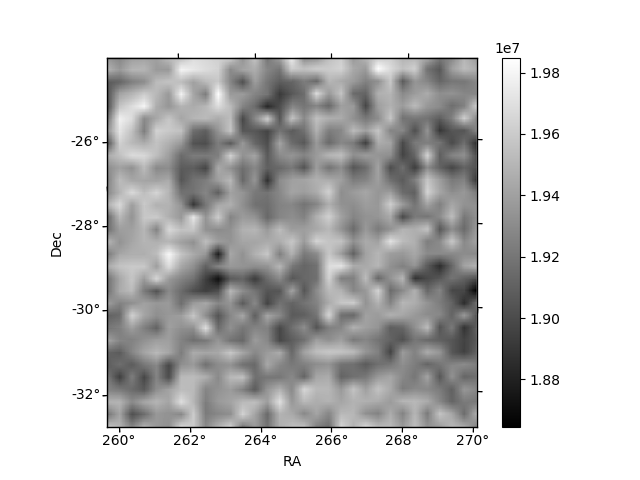
Quadrant B |
|---|---|---|---|
| Quadrant D | 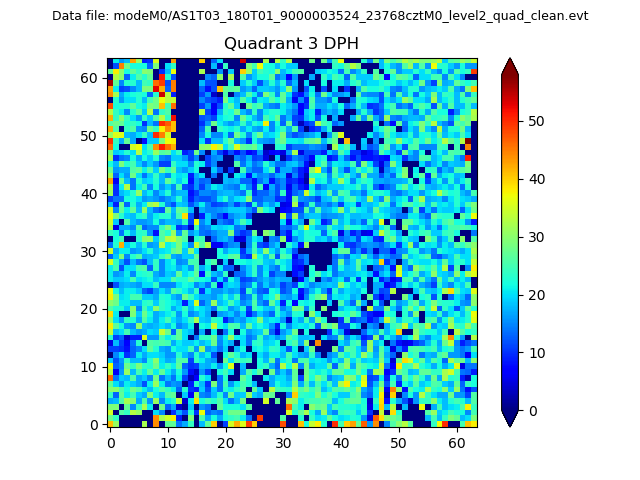 |
 |
Quadrant C |
| Plot type | Count rate plots | Images |
|---|---|---|
| Comparison with Poisson distribution Blue bars denote a histogram of data divided into 1 sec bins. Red curve is a Poisson curve with rate = median count rate of data. |
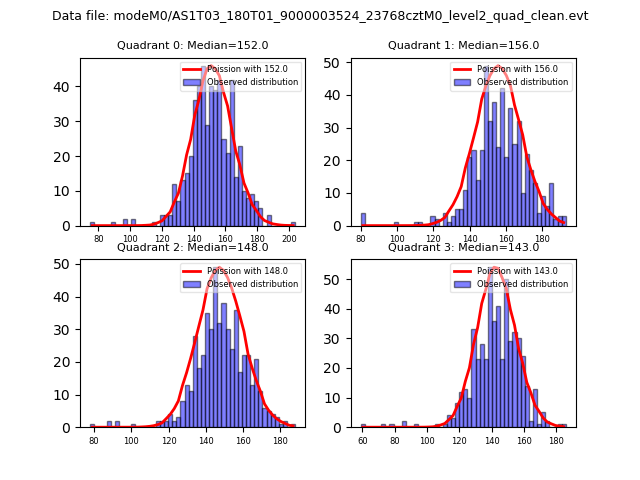 |
 |
| Quadrant-wise count rates Data is divided into 100 sec bins |
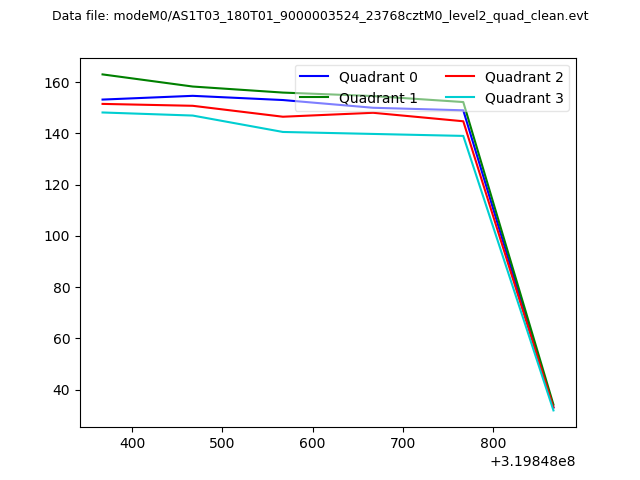 |
|
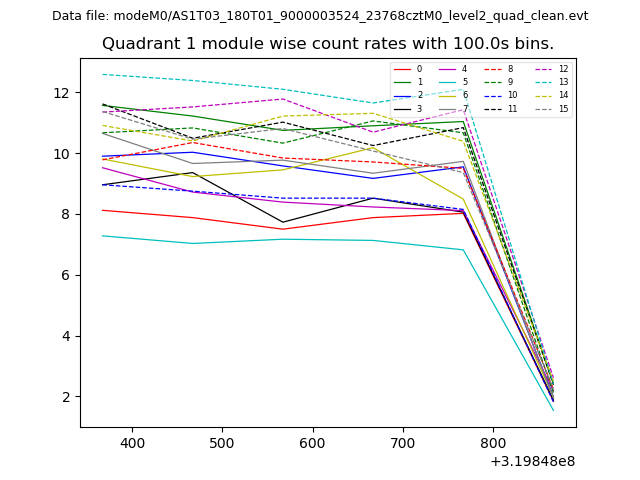
| Module-wise count rates for Quadrant A Data is divided into 100 sec bins |
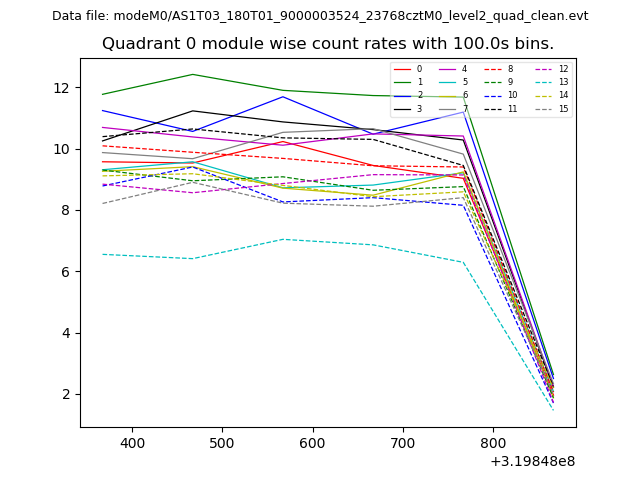 |
 |
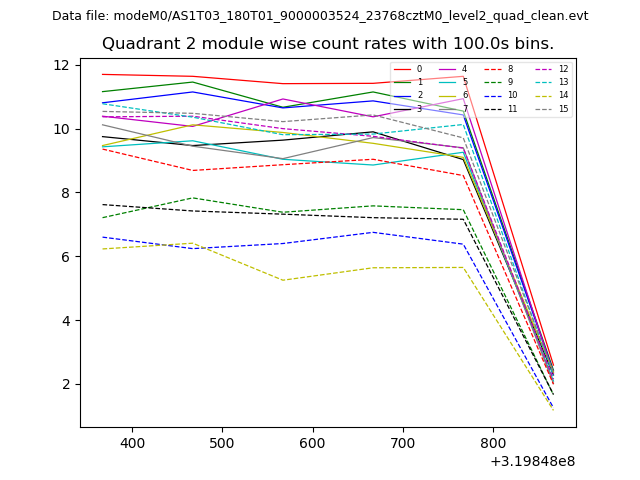
| Module-wise count rates for Quadrant B Data is divided into 100 sec bins |
 |
 |
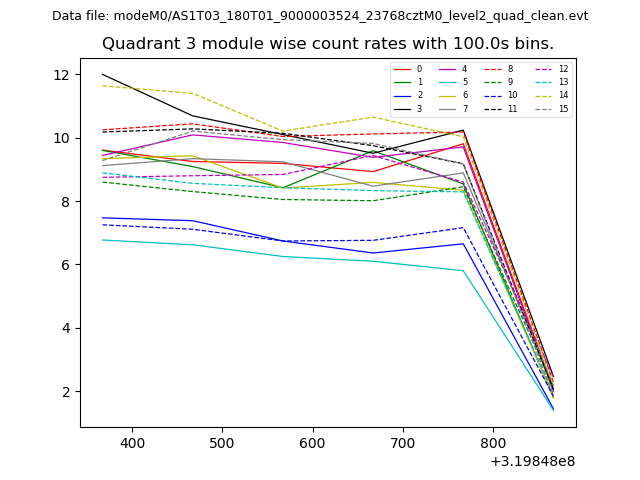
| Module-wise count rates for Quadrant C Data is divided into 100 sec bins |
 |
 |
| Module-wise count rates for Quadrant D Data is divided into 100 sec bins |
 |
 |
| Parameter | Plot |
|---|---|
| CZT HV Monitor | 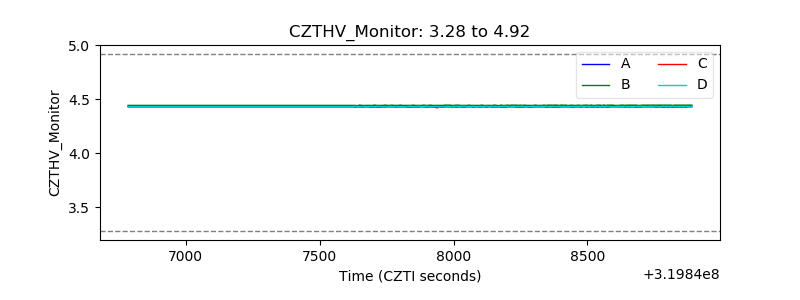 |
| D_VDD | 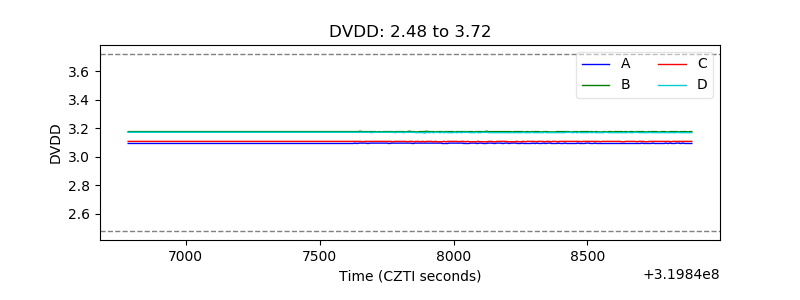 |
| Temperature 1 | 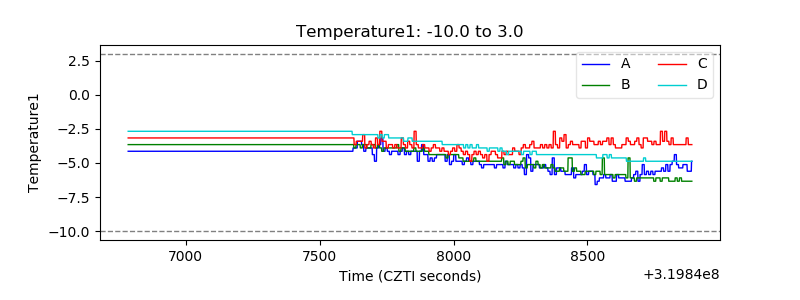 |
| Veto HV Monitor | 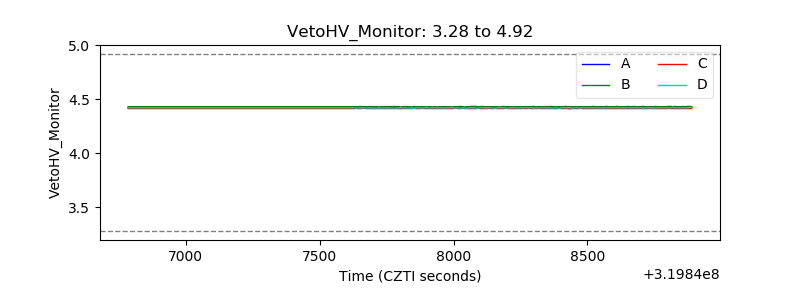 |
| Veto LLD | 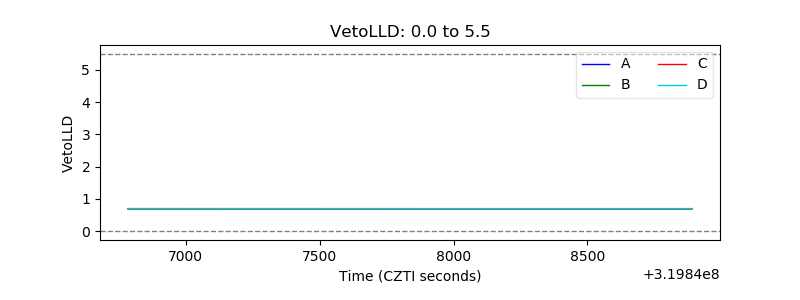 |
| Alpha Counter | 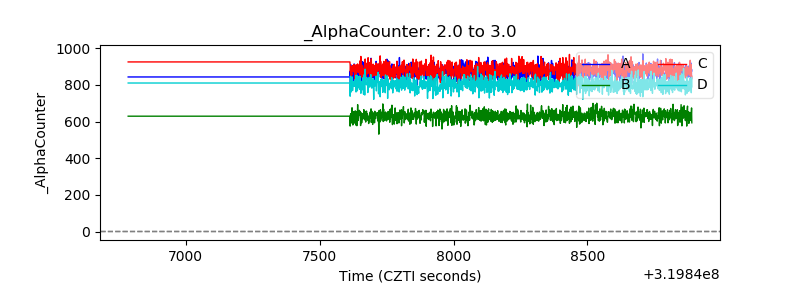 |
| _CPM_Rate | 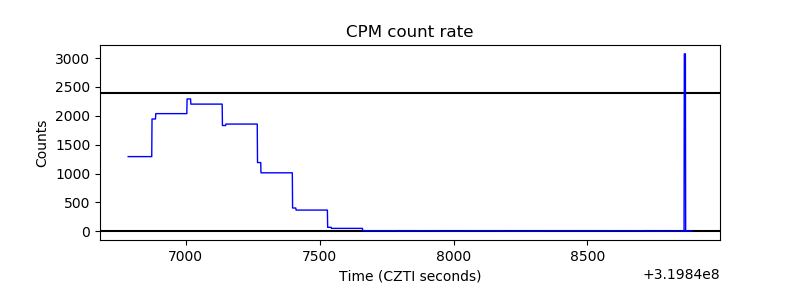 |
| CZT Counter | 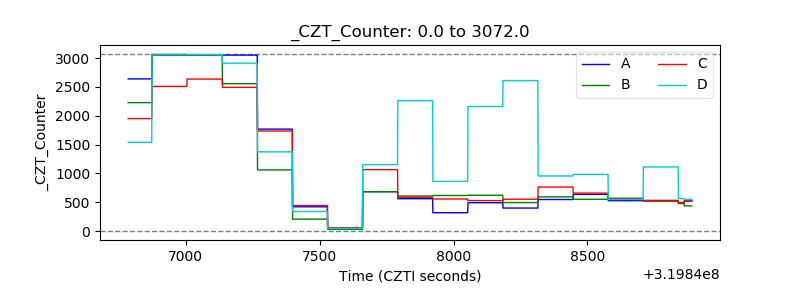 |
| +2.5 Volts monitor | 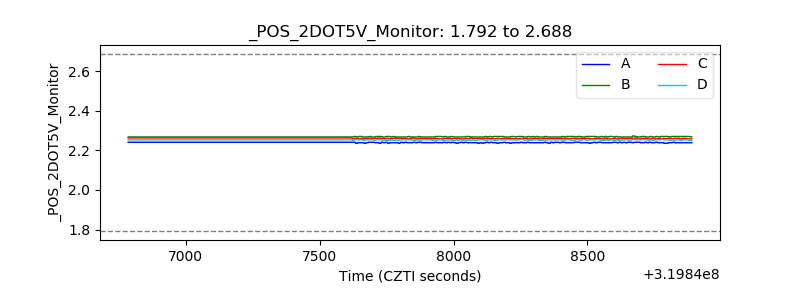 |
| +5 Volts monitor | 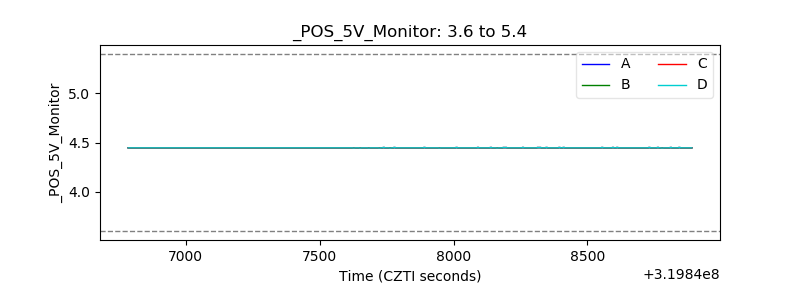 |
| _ROLL_ROT | 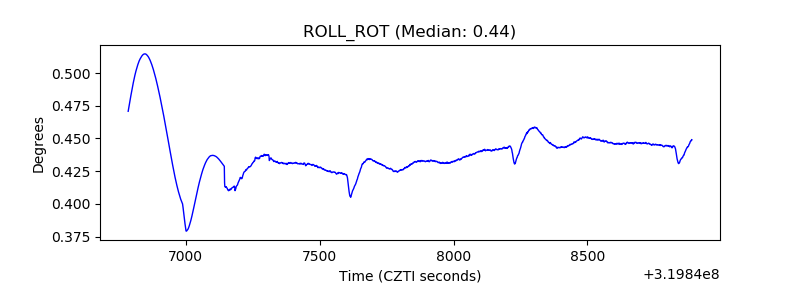 |
| _Roll_DEC | 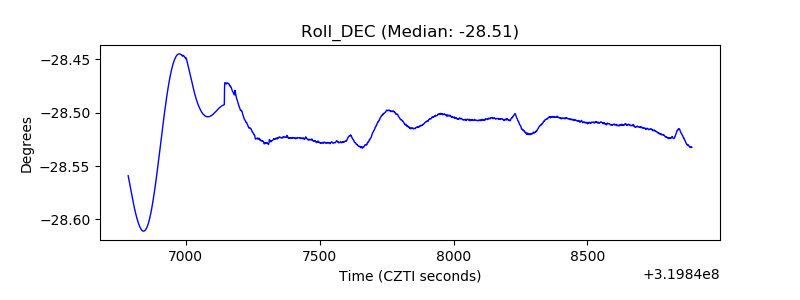 |
| _Roll_RA | 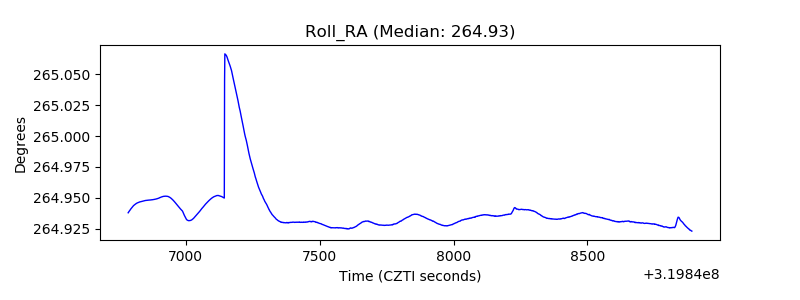 |
| Veto Counter | 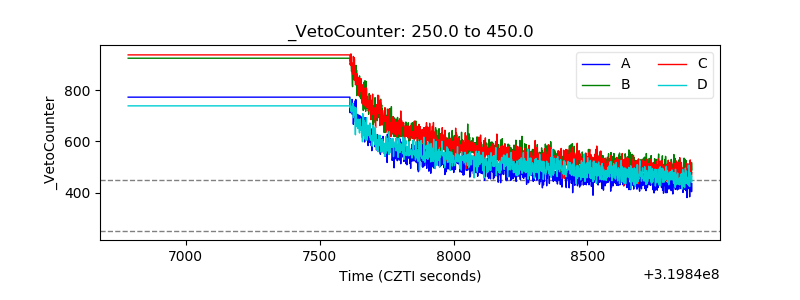 |