| Param | Original file | Final file |
|---|---|---|
| Filename | modeM0/AS1T03_180T01_9000003524_23770cztM0_level2.evt | modeM0/AS1T03_180T01_9000003524_23770cztM0_level2_quad_clean.evt |
| Size (bytes) | 491,005,440 | 104,852,160 |
| Size | 468.3 MB | 100.0 MB |
| Events in quadrant A | 3,246,831 | 679,447 |
| Events in quadrant B | 3,417,831 | 697,243 |
| Events in quadrant C | 3,521,837 | 673,636 |
| Events in quadrant D | 4,220,838 | 650,167 |
| Mode M0 | |||
|---|---|---|---|
| Quadrant | BADHDUFLAG | Total packets | Discarded packets |
| A | 0 | 14021 | 2 |
| B | 0 | 14309 | 2 |
| C | 0 | 14534 | 2 |
| D | 0 | 16996 | 2 |
| Mode SS | |||
|---|---|---|---|
| Quadrant | BADHDUFLAG | Total packets | Discarded packets |
| A | 0 | 140 | 0 |
| B | 0 | 140 | 0 |
| C | 0 | 140 | 0 |
| D | 0 | 140 | 0 |
| Mode M9 | |||
|---|---|---|---|
| Quadrant | BADHDUFLAG | Total packets | Discarded packets |
| A | 0 | 10 | 0 |
| B | 0 | 11 | 0 |
| C | 0 | 11 | 0 |
| D | 0 | 11 | 0 |
| Quadrant | Total seconds | Saturated seconds | Saturation percentage |
|---|---|---|---|
| A | 6812 | 20 | 0.293600% |
| B | 6812 | 47 | 0.689959% |
| C | 6812 | 135 | 1.981797% |
| D | 6812 | 104 | 1.526718% |
Noise dominated data is calculated using 1-second bins in cleaned event files. If a bin has >2000 counts, and if more than 50% of those come from <1% of pixels, then it is considered to be noise-dominated and hence unusable.
| Quadrant | # 1 sec bins | Bins with >0 counts | Bins with >2000 counts | High rate bins dominated by noise | Noise dominated (total time) | Noise dominated (detector-on time) | Marked lightcurve |
|---|---|---|---|---|---|---|---|
| A | 7642 | 6813 | 0 | 0 | 0.00% | 0.00% | 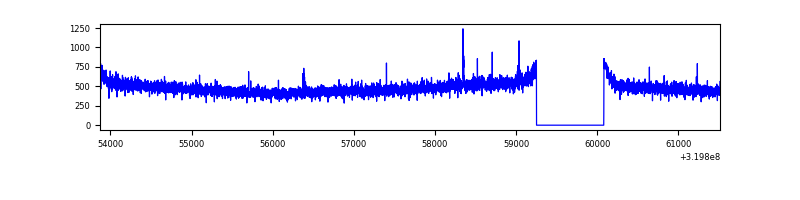 |
| B | 7642 | 6812 | 0 | 0 | 0.00% | 0.00% | 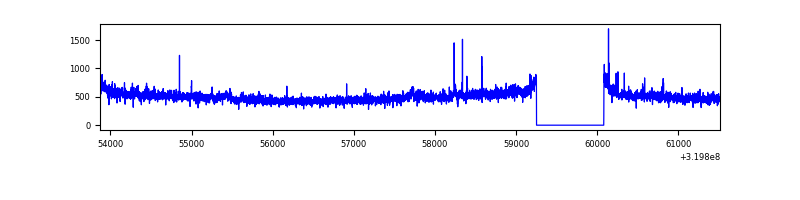 |
| C | 7642 | 6812 | 53 | 53 | 0.69% | 0.78% | 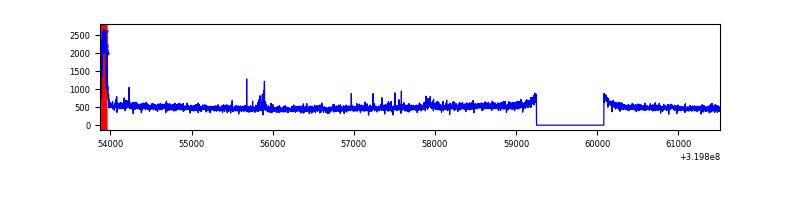 |
| D | 7642 | 6813 | 53 | 53 | 0.69% | 0.78% | 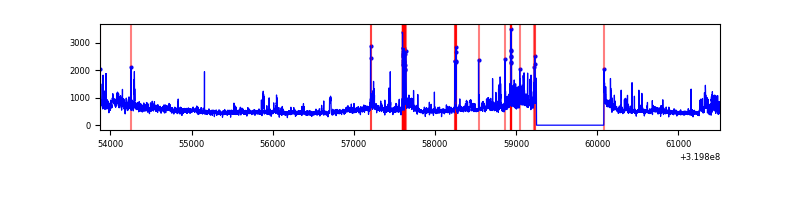 |
Top three noisy pixels from each quadrant. If the there are fewer than three noisy pixels in the level2.evt file, extra rows are filled as -1
| Pixel properties | Quadrant properties | ||||||
|---|---|---|---|---|---|---|---|
| Quadrant | DetID | PixID | Counts | Sigma | Mean | Median | Sigma |
| A | 13 | 254 | 12184 | 67.52 | 839 | 821 | 168.3 |
| A | 14 | 235 | 10108 | 55.19 | 839 | 821 | 168.3 |
| A | 3 | 137 | 7352 | 38.81 | 839 | 821 | 168.3 |
| B | 0 | 229 | 40886 | 249.28 | 846 | 826 | 160.7 |
| B | 0 | 189 | 34843 | 211.68 | 846 | 826 | 160.7 |
| B | 12 | 111 | 19392 | 115.53 | 846 | 826 | 160.7 |
| C | 0 | 10 | 203536 | 1063.45 | 814 | 822 | 190.6 |
| C | 14 | 238 | 128266 | 668.58 | 814 | 822 | 190.6 |
| C | 7 | 247 | 11582 | 56.45 | 814 | 822 | 190.6 |
| D | 1 | 52 | 429620 | 2156.19 | 818 | 796 | 198.9 |
| D | 8 | 195 | 380400 | 1908.7 | 818 | 796 | 198.9 |
| D | 7 | 238 | 170084 | 851.2 | 818 | 796 | 198.9 |
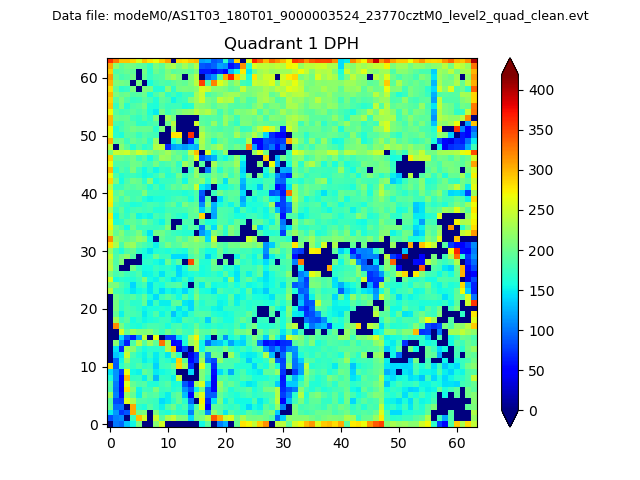
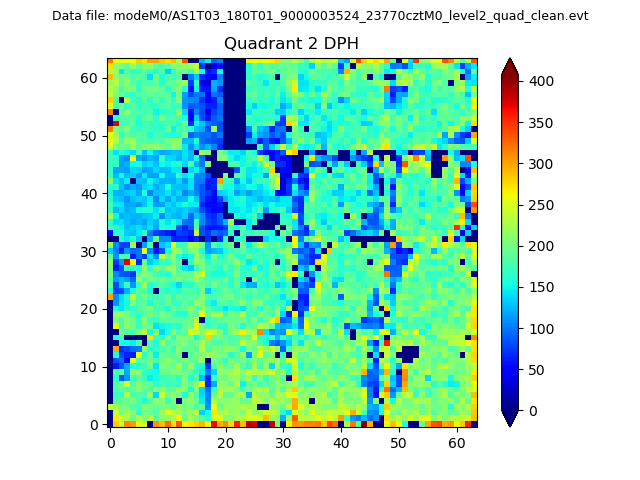
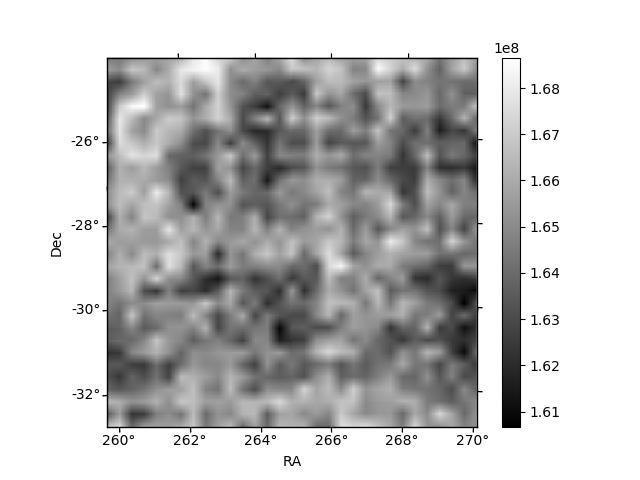
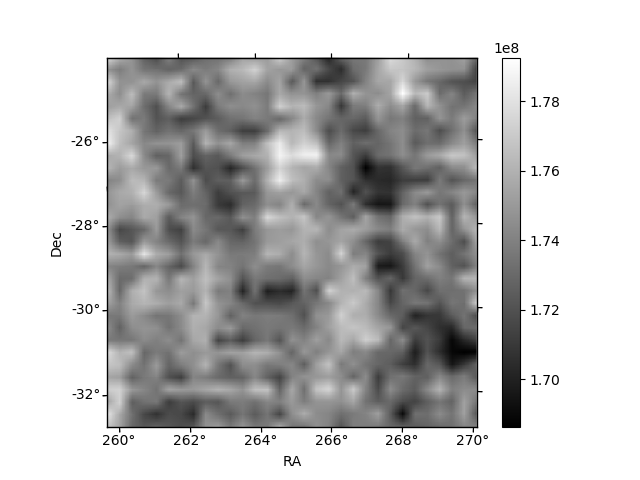
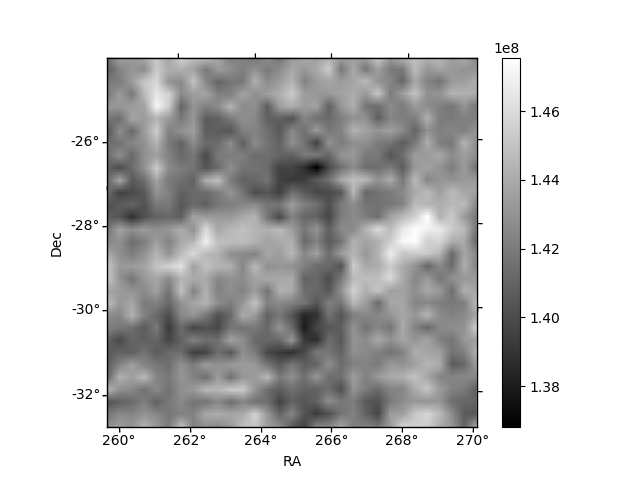
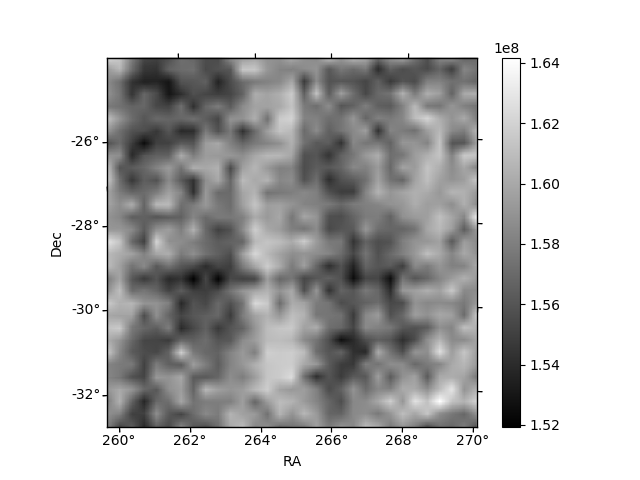
Histogram calculated using DETX and DETY for each event in the final _common_clean file
| Quadrant A |  |
 |
Quadrant B |
|---|---|---|---|
| Quadrant D | 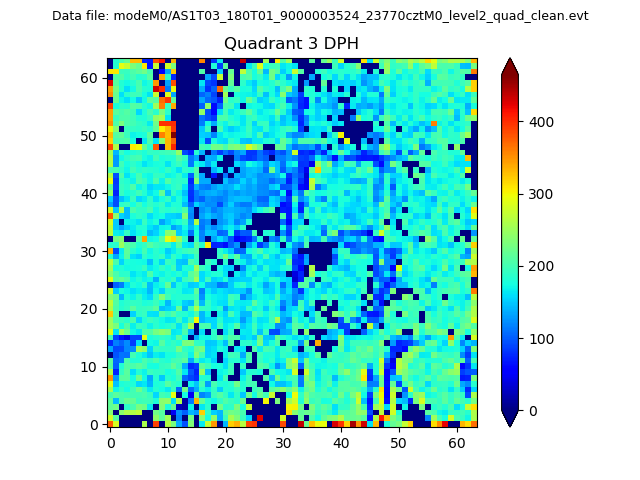 |
 |
Quadrant C |
| Plot type | Count rate plots | Images |
|---|---|---|
| Comparison with Poisson distribution Blue bars denote a histogram of data divided into 1 sec bins. Red curve is a Poisson curve with rate = median count rate of data. |
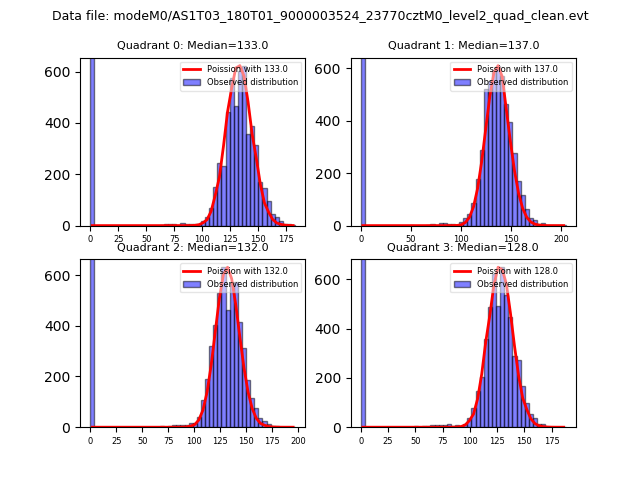 |
 |
| Quadrant-wise count rates Data is divided into 100 sec bins |
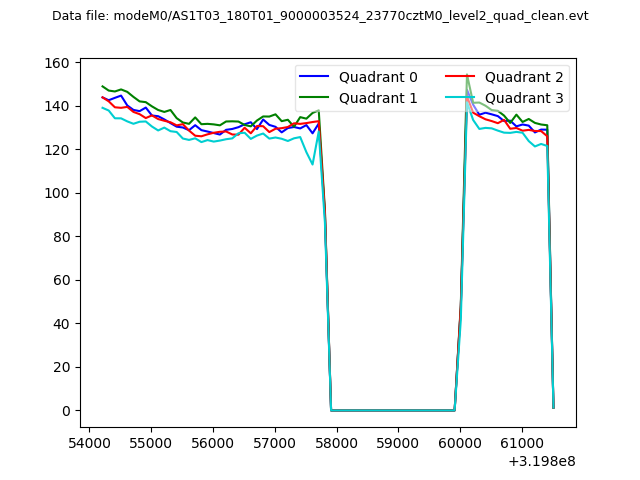 |
|
| Module-wise count rates for Quadrant A Data is divided into 100 sec bins |
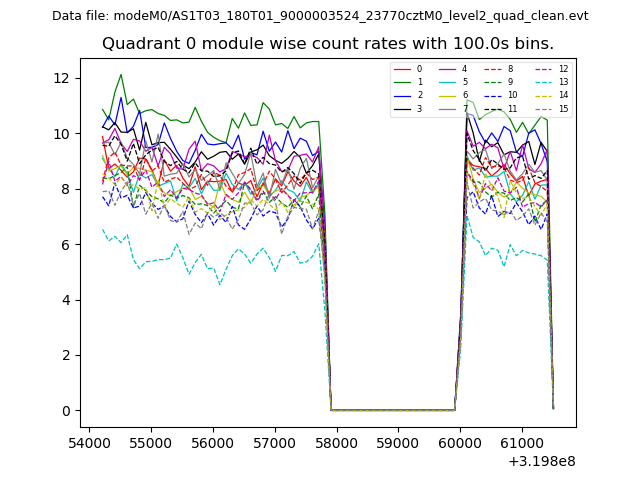 |
 |
| Module-wise count rates for Quadrant B Data is divided into 100 sec bins |
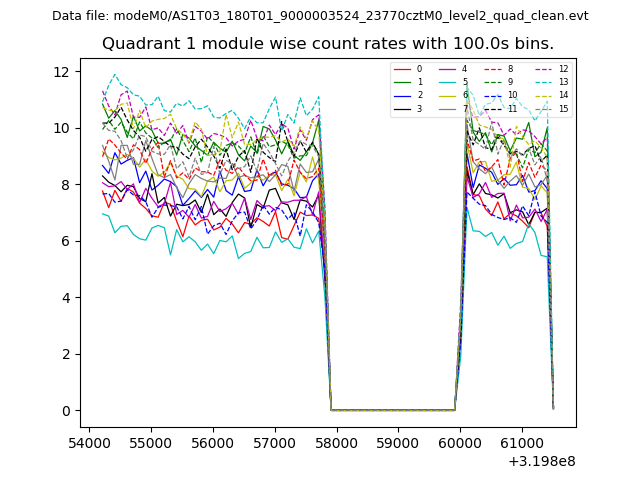 |
 |
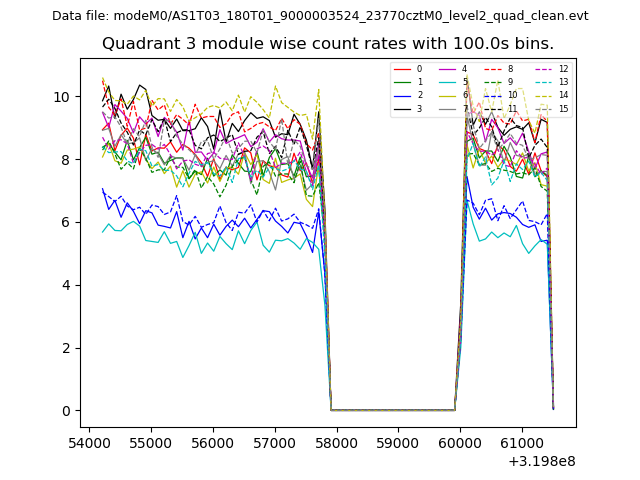
| Module-wise count rates for Quadrant C Data is divided into 100 sec bins |
 |
 |
| Module-wise count rates for Quadrant D Data is divided into 100 sec bins |
 |
 |
| Parameter | Plot |
|---|---|
| CZT HV Monitor | 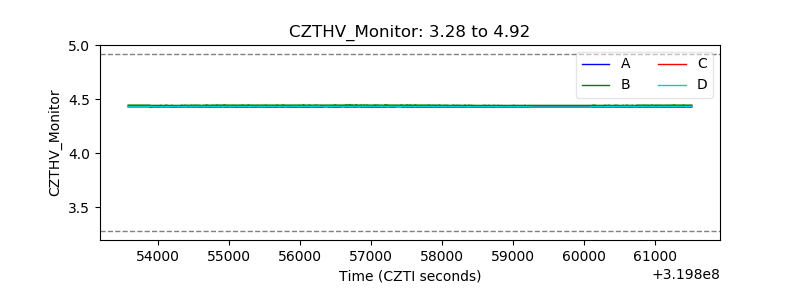 |
| D_VDD | 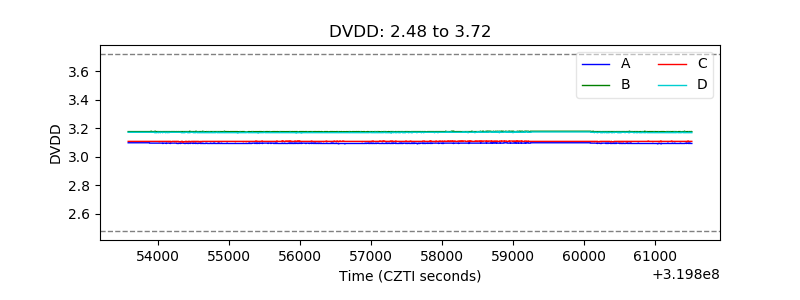 |
| Temperature 1 | 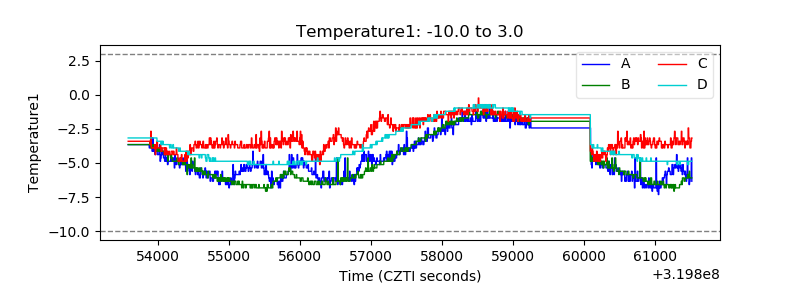 |
| Veto HV Monitor | 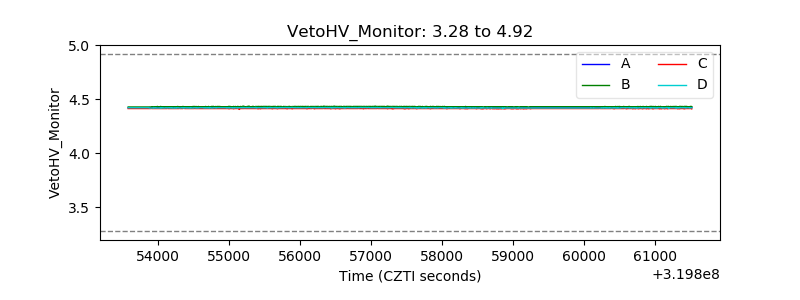 |
| Veto LLD | 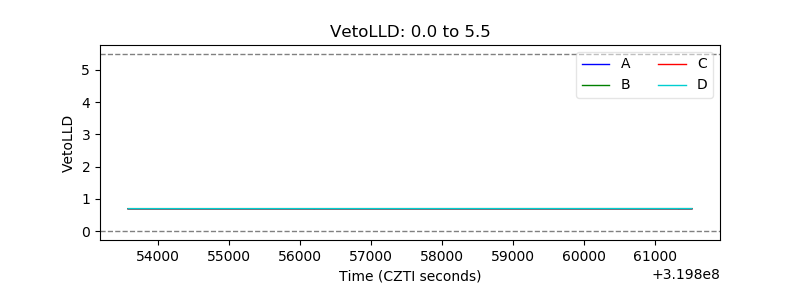 |
| Alpha Counter |  |
| _CPM_Rate | 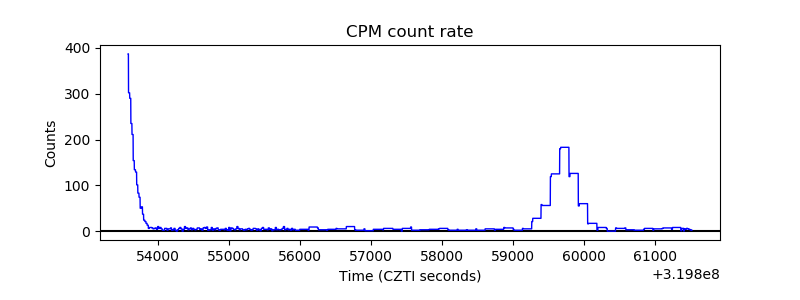 |
| CZT Counter | 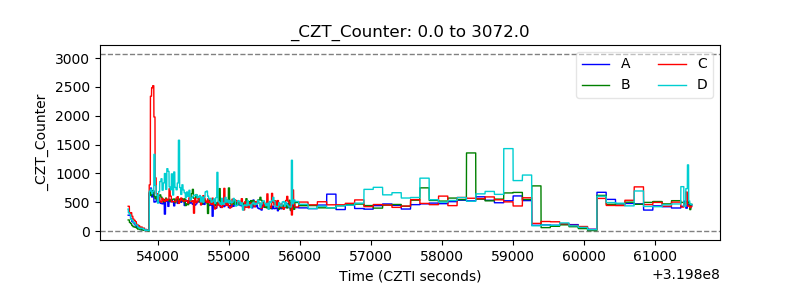 |
| +2.5 Volts monitor |  |
| +5 Volts monitor |  |
| _ROLL_ROT | 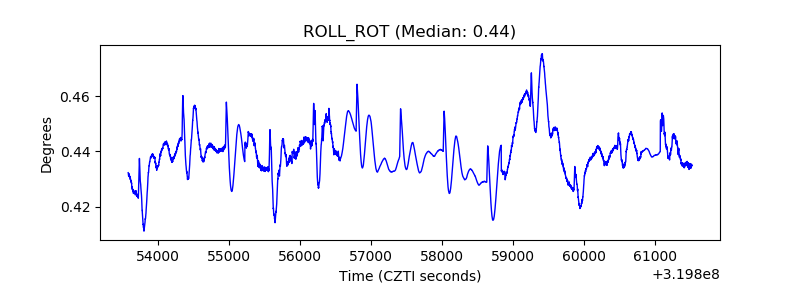 |
| _Roll_DEC | 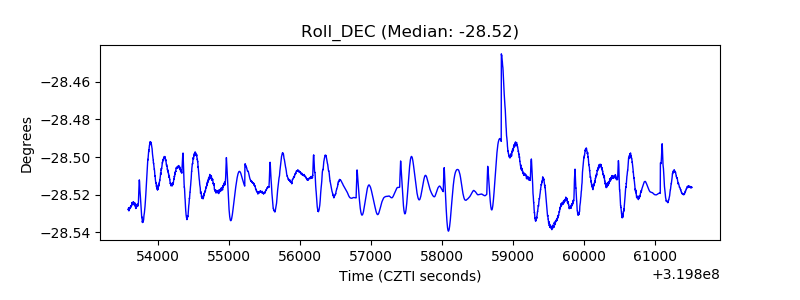 |
| _Roll_RA |  |
| Veto Counter | 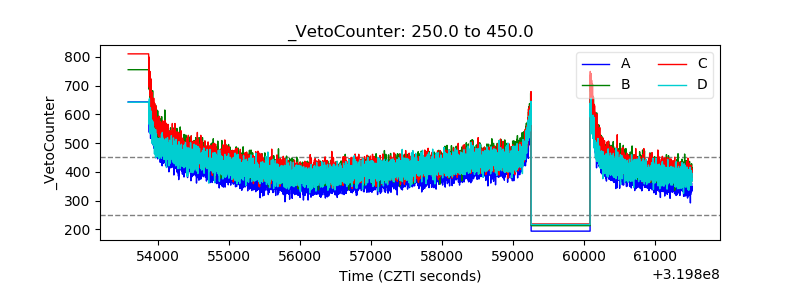 |