| Param | Original file | Final file |
|---|---|---|
| Filename | modeM0/AS1T03_180T01_9000003524_23772cztM0_level2.evt | modeM0/AS1T03_180T01_9000003524_23772cztM0_level2_quad_clean.evt |
| Size (bytes) | 605,946,240 | 110,093,760 |
| Size | 577.9 MB | 105.0 MB |
| Events in quadrant A | 3,671,920 | 709,459 |
| Events in quadrant B | 3,961,002 | 723,057 |
| Events in quadrant C | 3,791,309 | 699,162 |
| Events in quadrant D | 6,405,205 | 666,597 |
| Mode M0 | |||
|---|---|---|---|
| Quadrant | BADHDUFLAG | Total packets | Discarded packets |
| A | 0 | 15975 | 1 |
| B | 0 | 16557 | 1 |
| C | 0 | 16062 | 1 |
| D | 0 | 24354 | 1 |
| Mode SS | |||
|---|---|---|---|
| Quadrant | BADHDUFLAG | Total packets | Discarded packets |
| A | 0 | 154 | 0 |
| B | 0 | 154 | 0 |
| C | 0 | 154 | 0 |
| D | 0 | 154 | 0 |
| Quadrant | Total seconds | Saturated seconds | Saturation percentage |
|---|---|---|---|
| A | 7700 | 132 | 1.714286% |
| B | 7700 | 178 | 2.311688% |
| C | 7700 | 197 | 2.558442% |
| D | 7700 | 169 | 2.194805% |
Noise dominated data is calculated using 1-second bins in cleaned event files. If a bin has >2000 counts, and if more than 50% of those come from <1% of pixels, then it is considered to be noise-dominated and hence unusable.
| Quadrant | # 1 sec bins | Bins with >0 counts | Bins with >2000 counts | High rate bins dominated by noise | Noise dominated (total time) | Noise dominated (detector-on time) | Marked lightcurve |
|---|---|---|---|---|---|---|---|
| A | 7735 | 7701 | 0 | 0 | 0.00% | 0.00% | 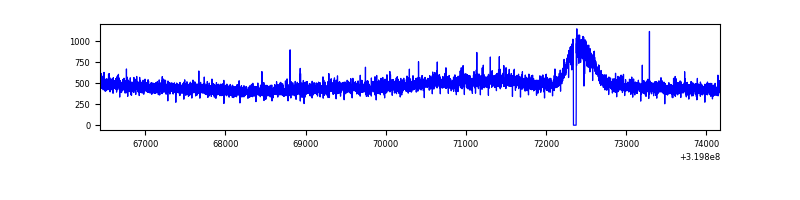 |
| B | 7735 | 7701 | 6 | 6 | 0.08% | 0.08% | 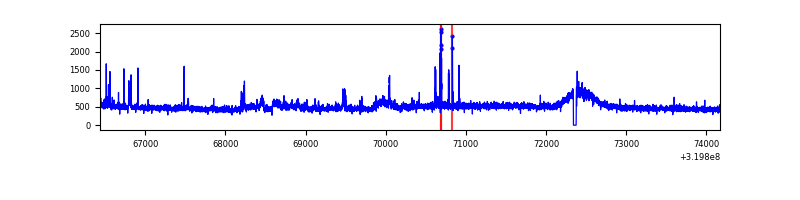 |
| C | 7735 | 7701 | 0 | 0 | 0.00% | 0.00% | 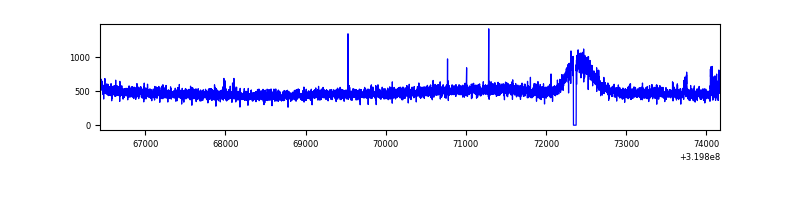 |
| D | 7735 | 7701 | 59 | 59 | 0.76% | 0.77% | 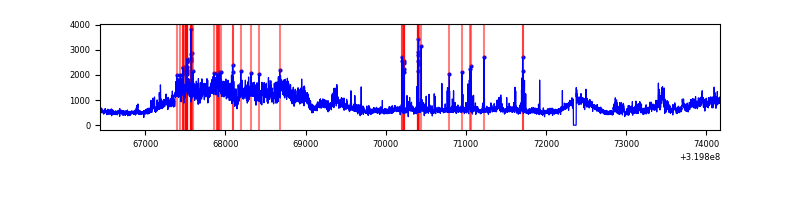 |
Top three noisy pixels from each quadrant. If the there are fewer than three noisy pixels in the level2.evt file, extra rows are filled as -1
| Pixel properties | Quadrant properties | ||||||
|---|---|---|---|---|---|---|---|
| Quadrant | DetID | PixID | Counts | Sigma | Mean | Median | Sigma |
| A | 8 | 4 | 19455 | 96.14 | 946 | 925 | 192.7 |
| A | 13 | 254 | 13851 | 67.07 | 946 | 925 | 192.7 |
| A | 3 | 137 | 8491 | 39.26 | 946 | 925 | 192.7 |
| B | 0 | 229 | 69725 | 375.1 | 945 | 920 | 183.4 |
| B | 0 | 189 | 52391 | 280.6 | 945 | 920 | 183.4 |
| B | 3 | 64 | 33672 | 178.55 | 945 | 920 | 183.4 |
| C | 14 | 238 | 142343 | 644.35 | 922 | 929 | 219.5 |
| C | 7 | 247 | 32830 | 145.35 | 922 | 929 | 219.5 |
| C | 8 | 128 | 12783 | 54.01 | 922 | 929 | 219.5 |
| D | 7 | 238 | 1910346 | 8437.5 | 926 | 899 | 226.3 |
| D | 8 | 195 | 498703 | 2199.71 | 926 | 899 | 226.3 |
| D | 1 | 52 | 377069 | 1662.23 | 926 | 899 | 226.3 |
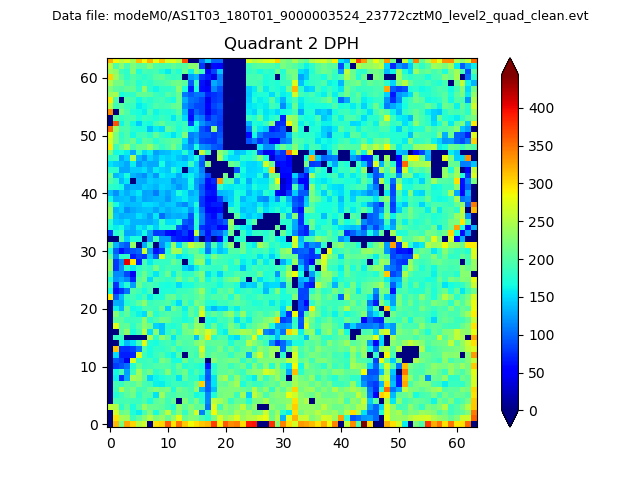
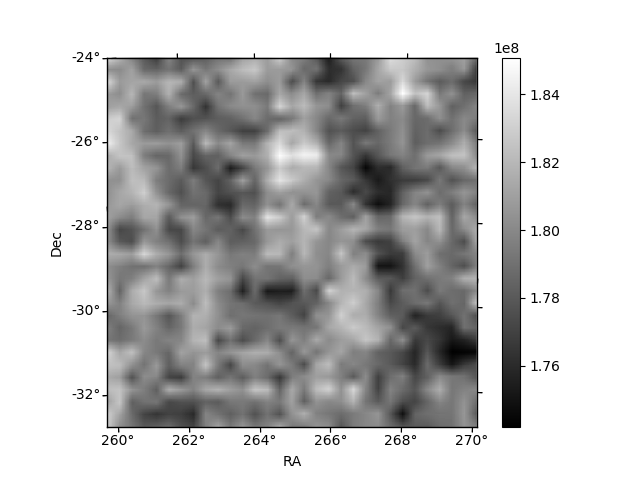
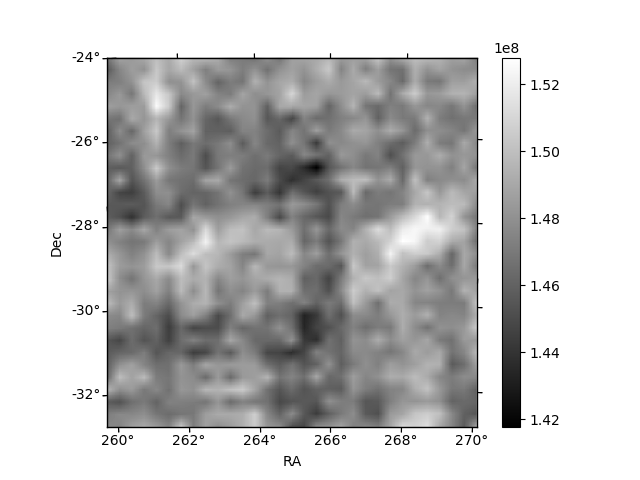
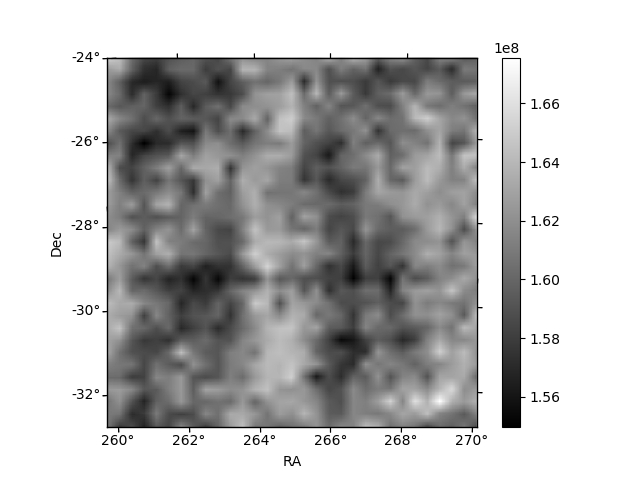
Histogram calculated using DETX and DETY for each event in the final _common_clean file
| Quadrant A | 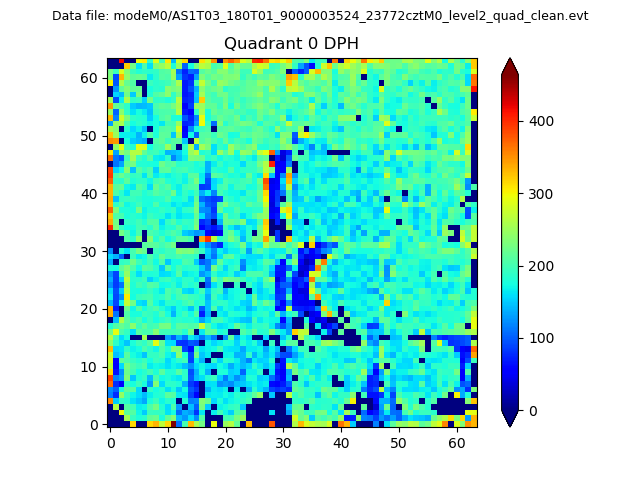 |
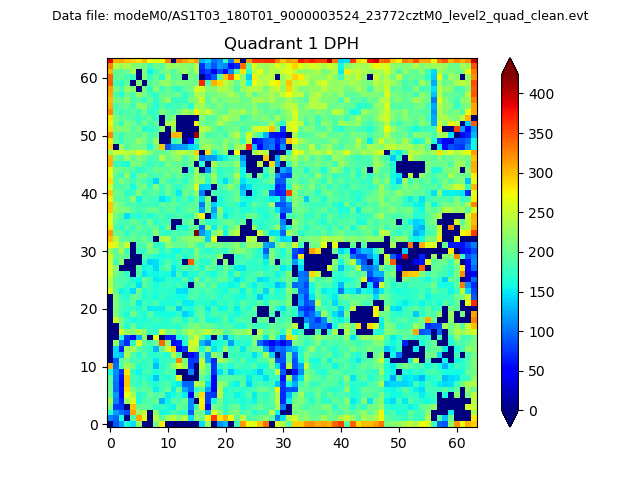 |
Quadrant B |
|---|---|---|---|
| Quadrant D | 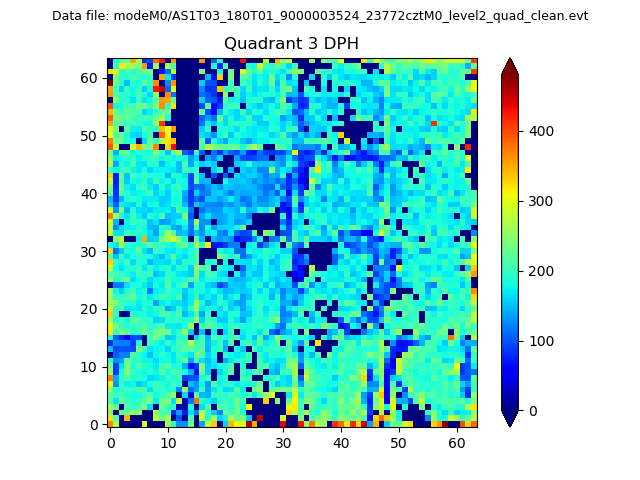 |
 |
Quadrant C |
| Plot type | Count rate plots | Images |
|---|---|---|
| Comparison with Poisson distribution Blue bars denote a histogram of data divided into 1 sec bins. Red curve is a Poisson curve with rate = median count rate of data. |
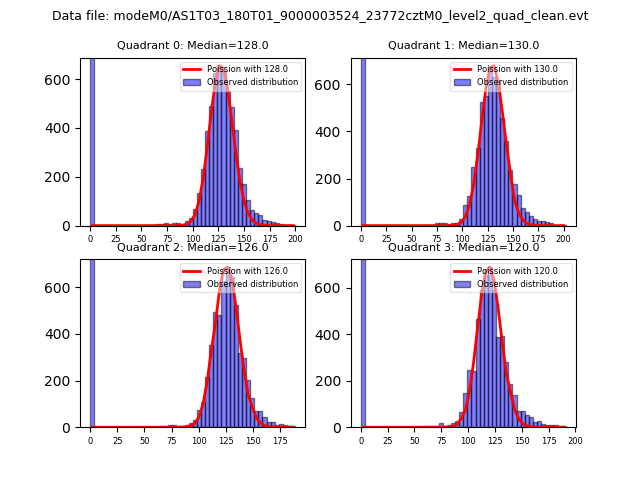 |
 |
| Quadrant-wise count rates Data is divided into 100 sec bins |
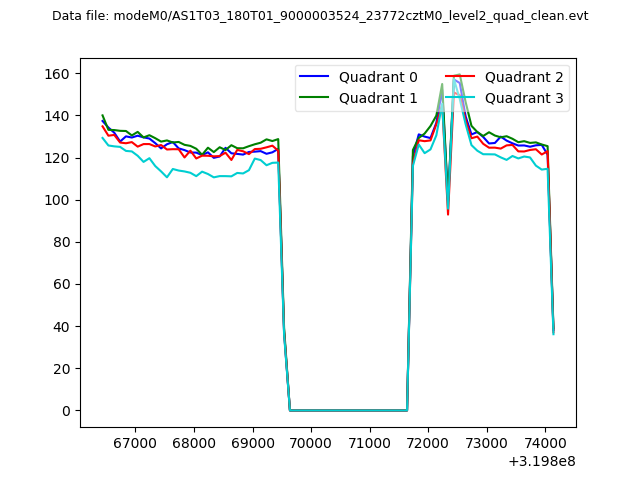 |
|
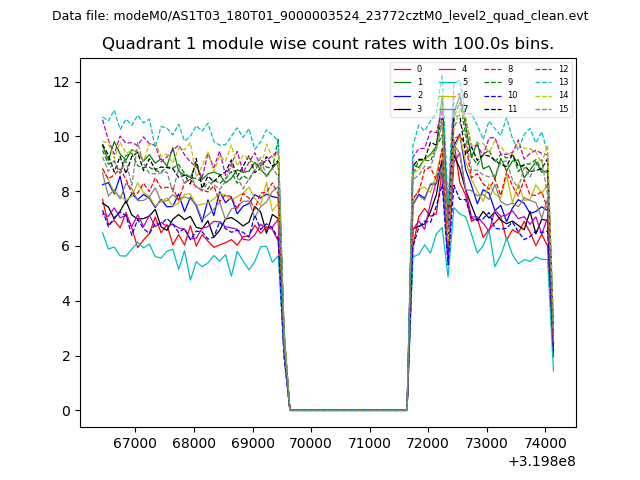
| Module-wise count rates for Quadrant A Data is divided into 100 sec bins |
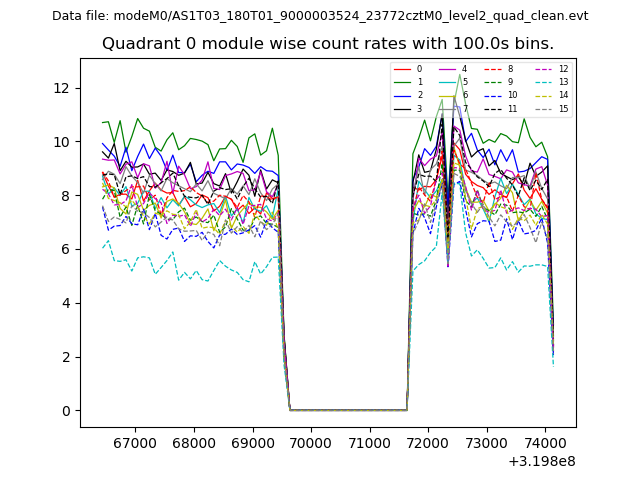 |
 |
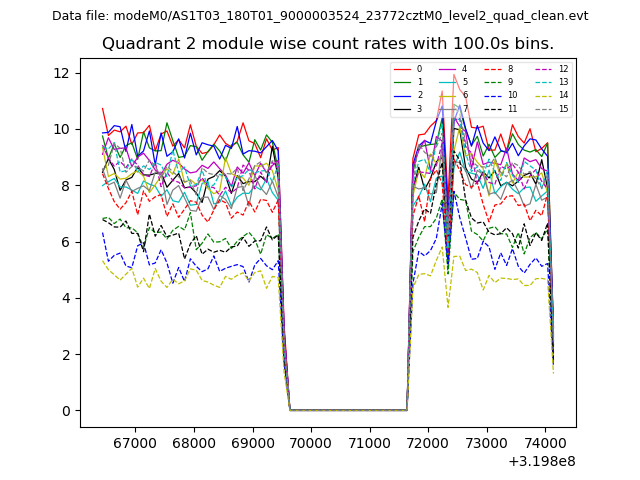
| Module-wise count rates for Quadrant B Data is divided into 100 sec bins |
 |
 |
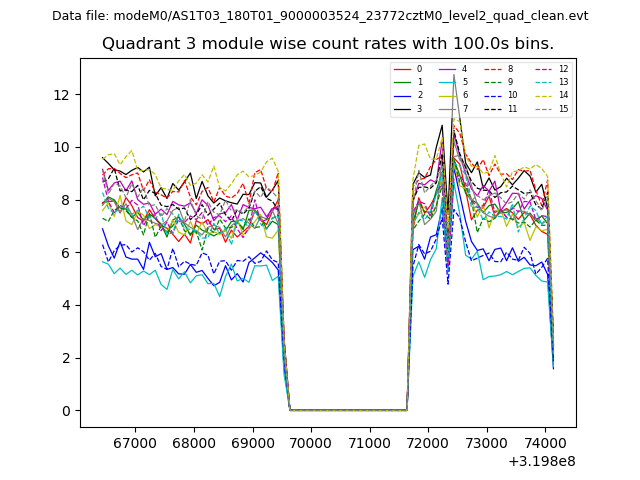
| Module-wise count rates for Quadrant C Data is divided into 100 sec bins |
 |
 |
| Module-wise count rates for Quadrant D Data is divided into 100 sec bins |
 |
 |
| Parameter | Plot |
|---|---|
| CZT HV Monitor | 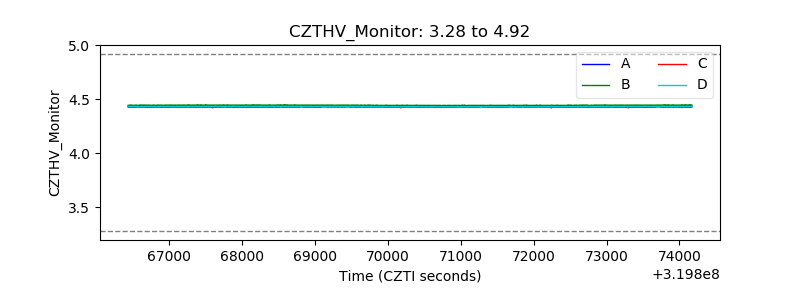 |
| D_VDD | 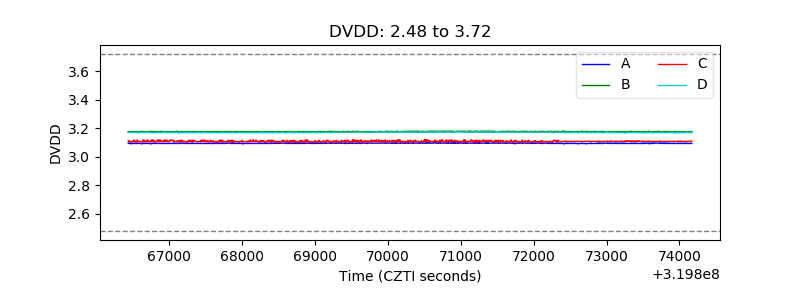 |
| Temperature 1 | 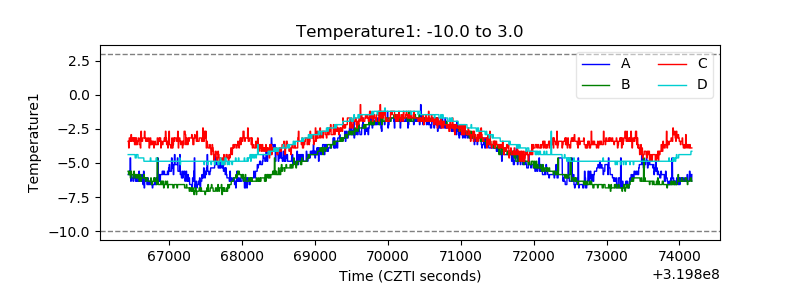 |
| Veto HV Monitor | 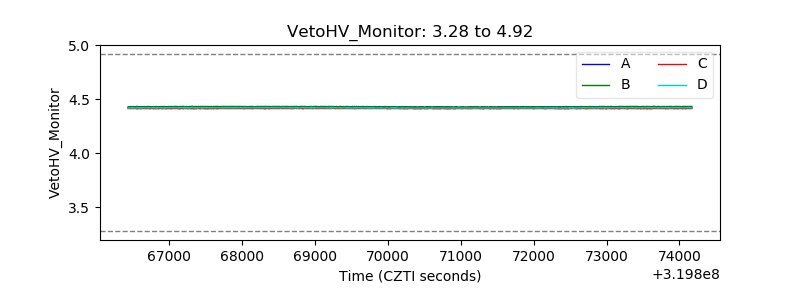 |
| Veto LLD | 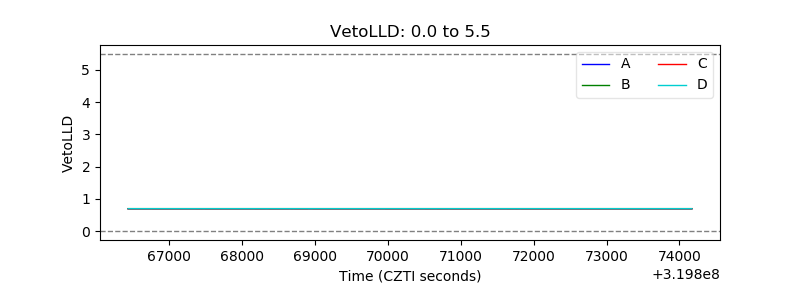 |
| Alpha Counter | 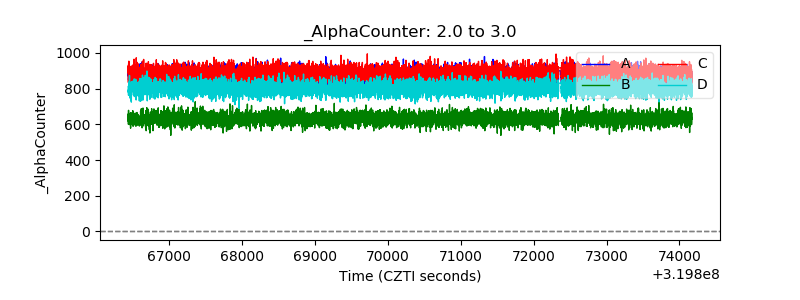 |
| _CPM_Rate | 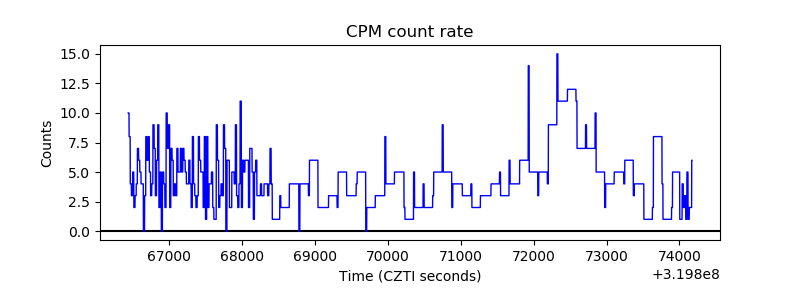 |
| CZT Counter |  |
| +2.5 Volts monitor | 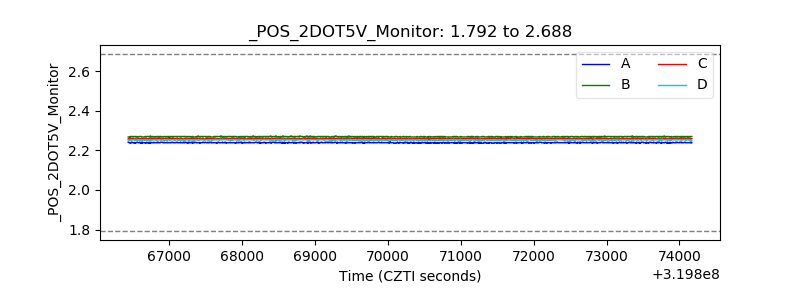 |
| +5 Volts monitor |  |
| _ROLL_ROT |  |
| _Roll_DEC | 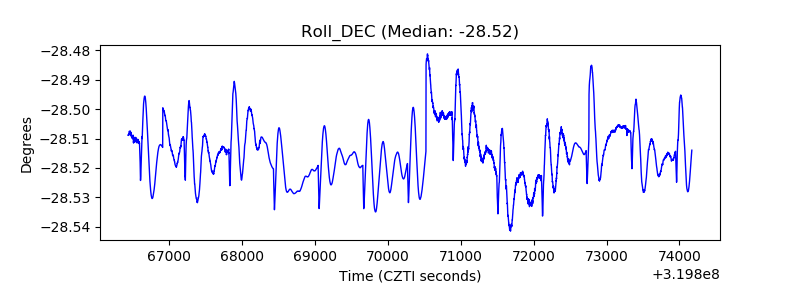 |
| _Roll_RA |  |
| Veto Counter |  |