| Param | Original file | Final file |
|---|---|---|
| Filename | modeM0/AS1T03_180T01_9000003524_23776cztM0_level2.evt | modeM0/AS1T03_180T01_9000003524_23776cztM0_level2_quad_clean.evt |
| Size (bytes) | 1,528,764,480 | 266,149,440 |
| Size | 1.4 GB | 253.8 MB |
| Events in quadrant A | 10,028,230 | 1,652,664 |
| Events in quadrant B | 10,719,082 | 1,692,331 |
| Events in quadrant C | 10,267,754 | 1,638,557 |
| Events in quadrant D | 13,820,478 | 1,586,050 |
| Mode M0 | |||
|---|---|---|---|
| Quadrant | BADHDUFLAG | Total packets | Discarded packets |
| A | 0 | 43957 | 3 |
| B | 0 | 45301 | 3 |
| C | 0 | 44191 | 3 |
| D | 0 | 55368 | 3 |
| Mode SS | |||
|---|---|---|---|
| Quadrant | BADHDUFLAG | Total packets | Discarded packets |
| A | 0 | 440 | 0 |
| B | 0 | 440 | 0 |
| C | 0 | 440 | 0 |
| D | 0 | 440 | 0 |
| Mode M9 | |||
|---|---|---|---|
| Quadrant | BADHDUFLAG | Total packets | Discarded packets |
| A | 0 | 14 | 0 |
| B | 0 | 14 | 0 |
| C | 0 | 14 | 0 |
| D | 0 | 14 | 0 |
| Quadrant | Total seconds | Saturated seconds | Saturation percentage |
|---|---|---|---|
| A | 21657 | 230 | 1.062012% |
| B | 21658 | 272 | 1.255887% |
| C | 21658 | 346 | 1.597562% |
| D | 21657 | 325 | 1.500670% |
Noise dominated data is calculated using 1-second bins in cleaned event files. If a bin has >2000 counts, and if more than 50% of those come from <1% of pixels, then it is considered to be noise-dominated and hence unusable.
| Quadrant | # 1 sec bins | Bins with >0 counts | Bins with >2000 counts | High rate bins dominated by noise | Noise dominated (total time) | Noise dominated (detector-on time) | Marked lightcurve |
|---|---|---|---|---|---|---|---|
| A | 23078 | 21659 | 0 | 0 | 0.00% | 0.00% | 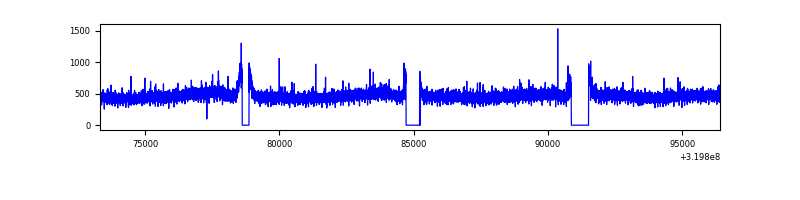 |
| B | 23079 | 21660 | 13 | 13 | 0.06% | 0.06% | 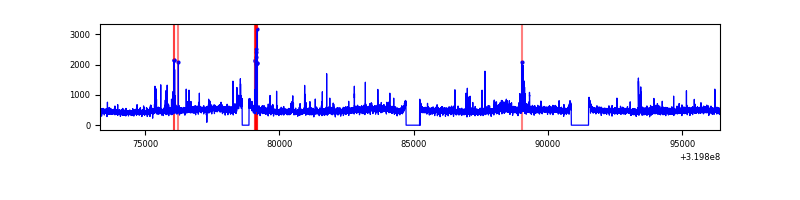 |
| C | 23079 | 21660 | 0 | 0 | 0.00% | 0.00% | 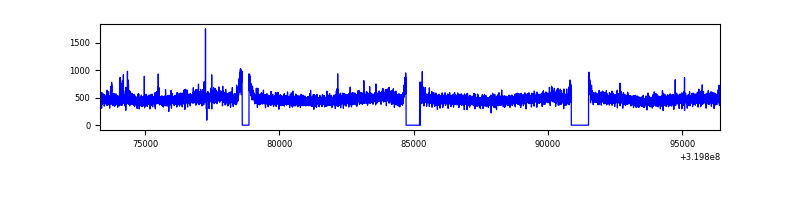 |
| D | 23078 | 21659 | 90 | 90 | 0.39% | 0.42% | 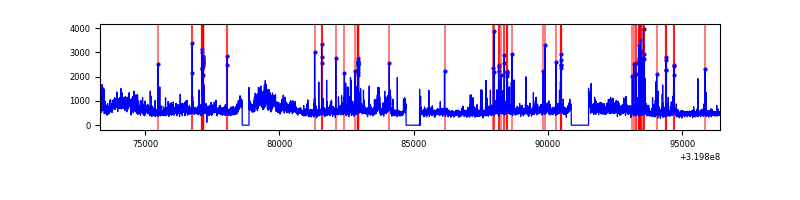 |
Top three noisy pixels from each quadrant. If the there are fewer than three noisy pixels in the level2.evt file, extra rows are filled as -1
| Pixel properties | Quadrant properties | ||||||
|---|---|---|---|---|---|---|---|
| Quadrant | DetID | PixID | Counts | Sigma | Mean | Median | Sigma |
| A | 13 | 254 | 38819 | 69.56 | 2596 | 2537 | 521.6 |
| A | 3 | 137 | 23153 | 39.52 | 2596 | 2537 | 521.6 |
| A | 0 | 226 | 22598 | 38.46 | 2596 | 2537 | 521.6 |
| B | 0 | 229 | 231815 | 466.5 | 2587 | 2523 | 491.5 |
| B | 0 | 189 | 124262 | 247.68 | 2587 | 2523 | 491.5 |
| B | 15 | 32 | 88269 | 174.45 | 2587 | 2523 | 491.5 |
| C | 14 | 238 | 396783 | 668.52 | 2512 | 2531 | 589.7 |
| C | 7 | 247 | 81103 | 133.23 | 2512 | 2531 | 589.7 |
| C | 13 | 61 | 17433 | 25.27 | 2512 | 2531 | 589.7 |
| D | 8 | 195 | 1937670 | 3148.68 | 2537 | 2461 | 614.6 |
| D | 7 | 238 | 1055022 | 1712.57 | 2537 | 2461 | 614.6 |
| D | 1 | 52 | 936937 | 1520.44 | 2537 | 2461 | 614.6 |
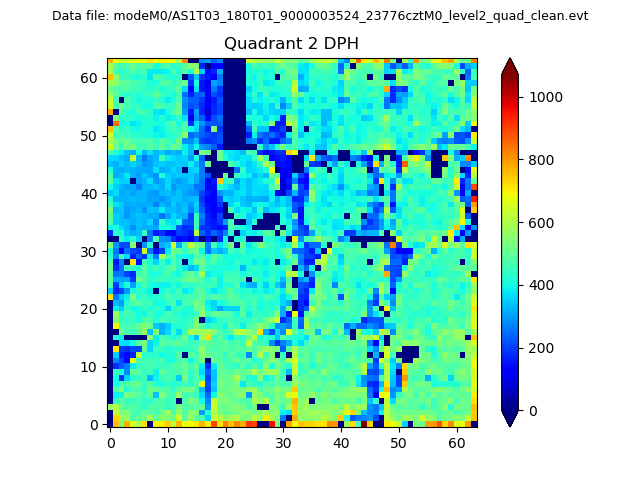
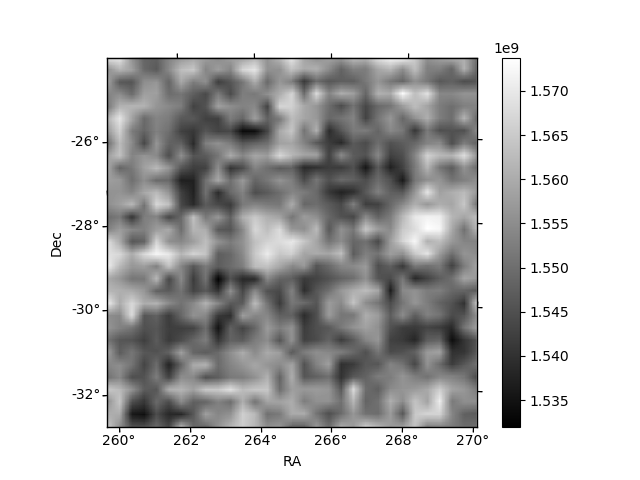
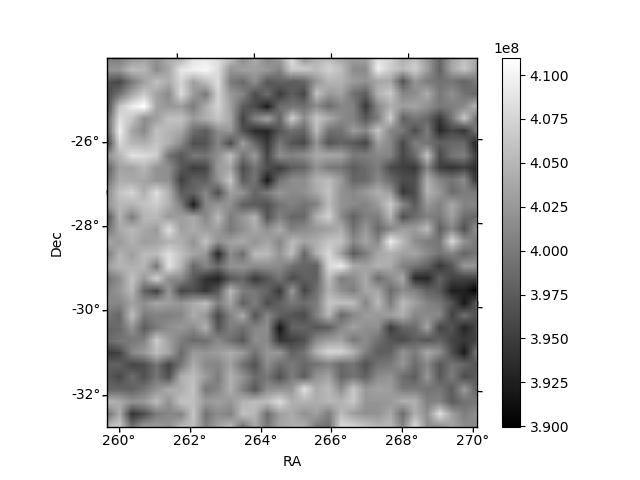
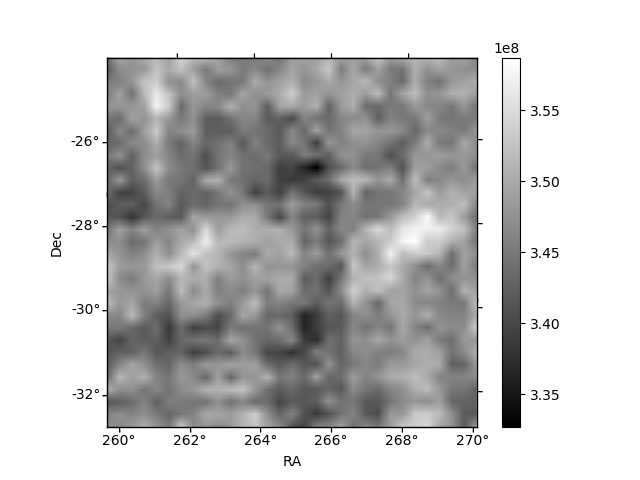
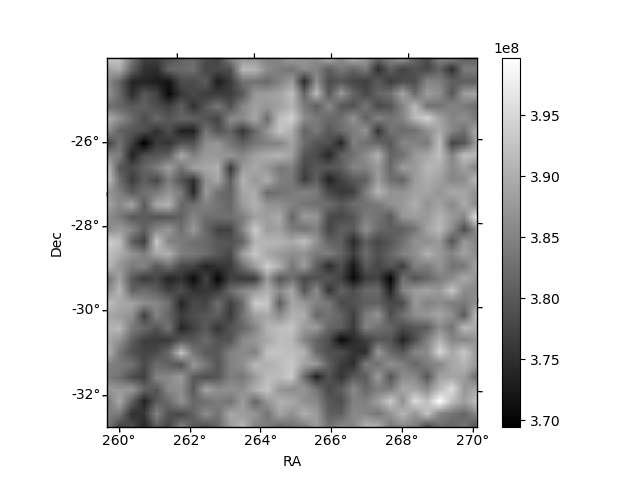
Histogram calculated using DETX and DETY for each event in the final _common_clean file
| Quadrant A | 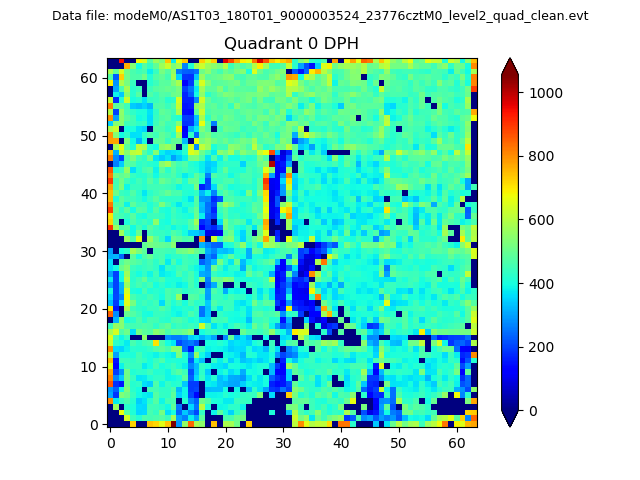 |
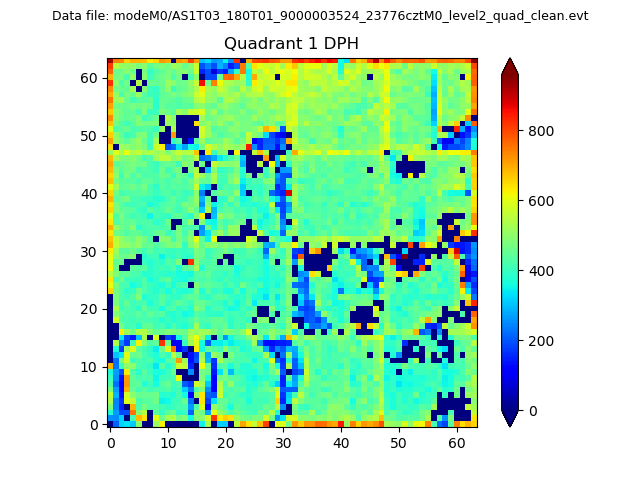 |
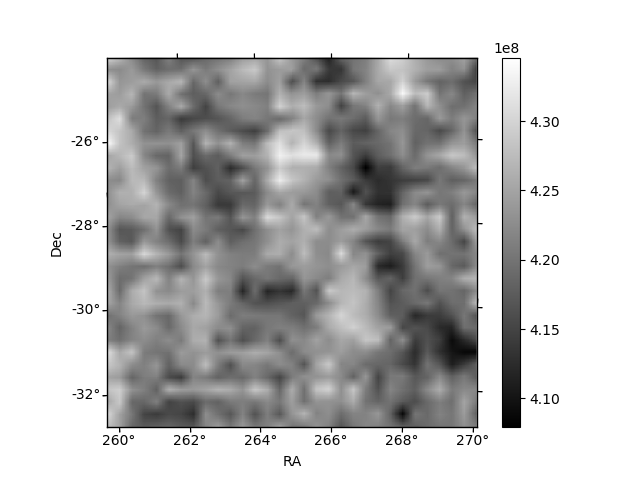
Quadrant B |
|---|---|---|---|
| Quadrant D | 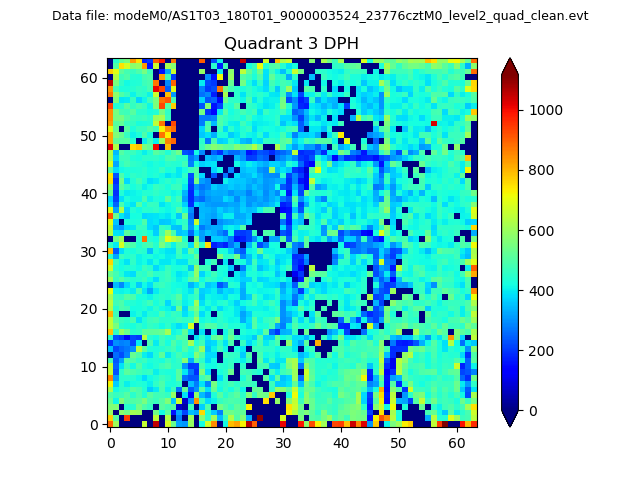 |
 |
Quadrant C |
| Plot type | Count rate plots | Images |
|---|---|---|
| Comparison with Poisson distribution Blue bars denote a histogram of data divided into 1 sec bins. Red curve is a Poisson curve with rate = median count rate of data. |
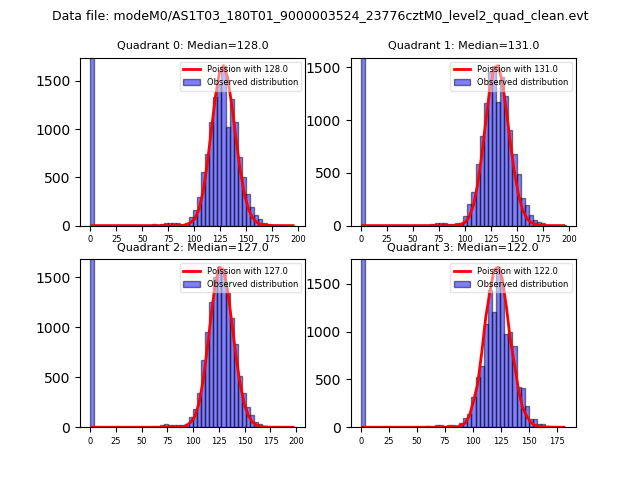 |
 |
| Quadrant-wise count rates Data is divided into 100 sec bins |
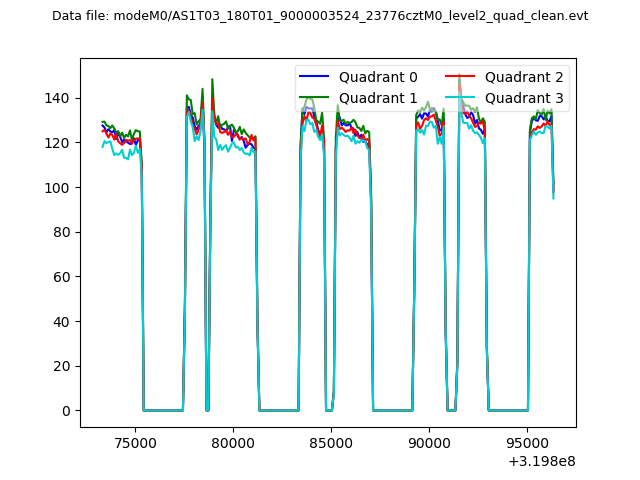 |
|
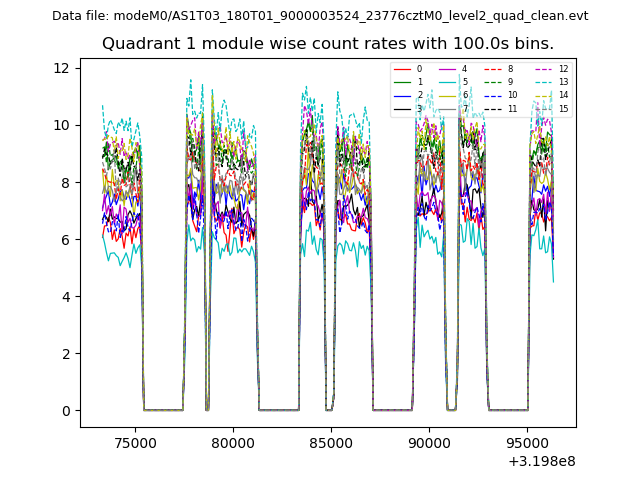
| Module-wise count rates for Quadrant A Data is divided into 100 sec bins |
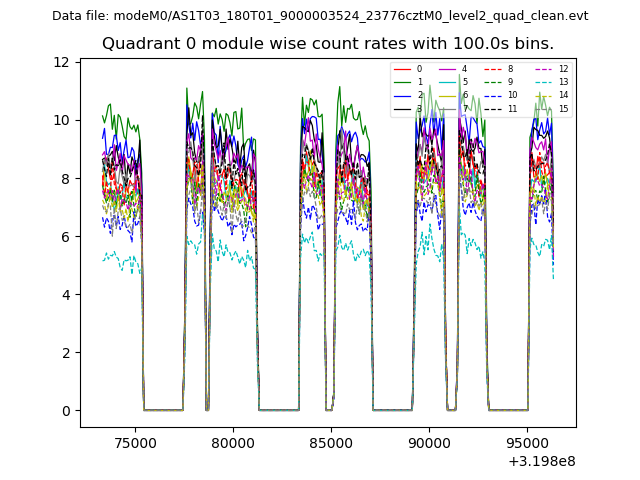 |
 |
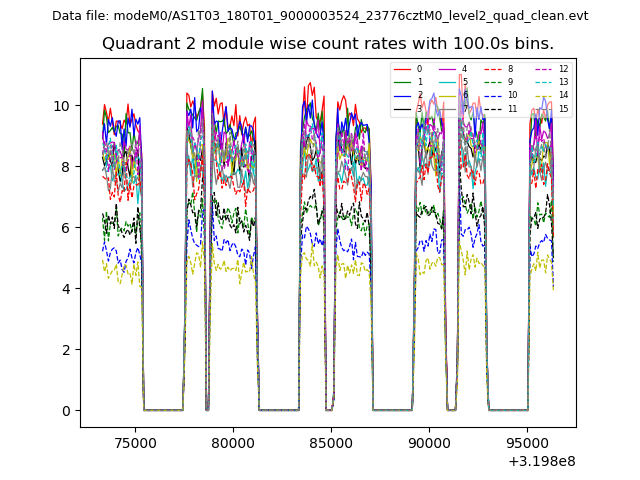
| Module-wise count rates for Quadrant B Data is divided into 100 sec bins |
 |
 |
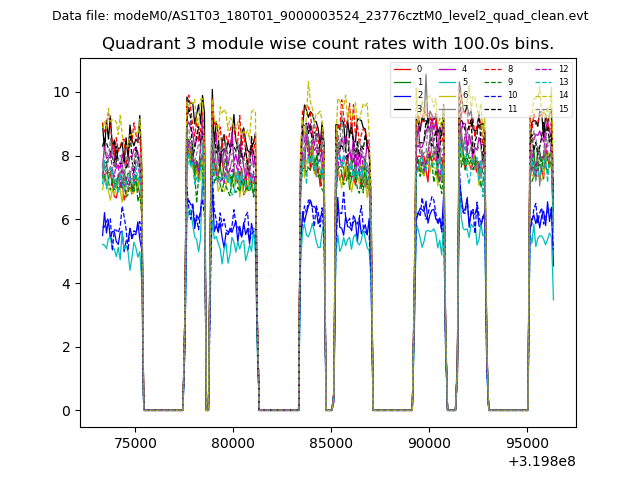
| Module-wise count rates for Quadrant C Data is divided into 100 sec bins |
 |
 |
| Module-wise count rates for Quadrant D Data is divided into 100 sec bins |
 |
 |
| Parameter | Plot |
|---|---|
| CZT HV Monitor | 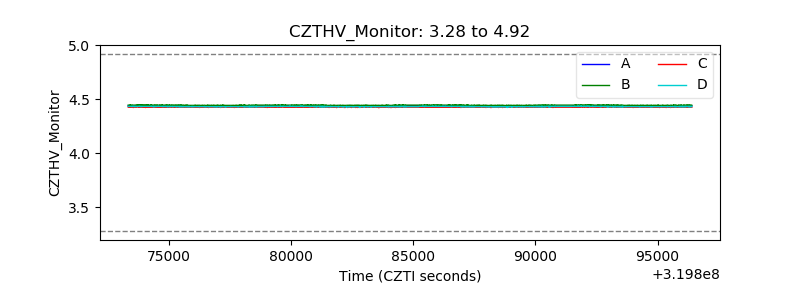 |
| D_VDD | 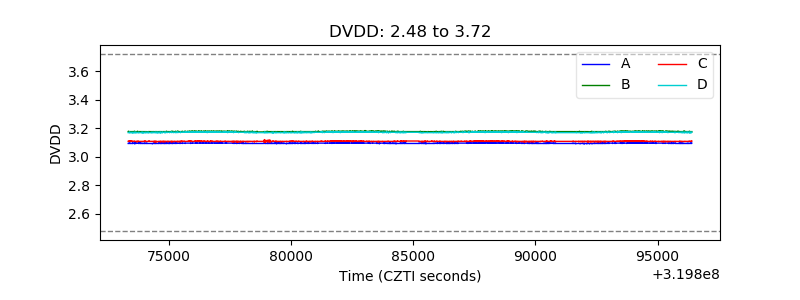 |
| Temperature 1 | 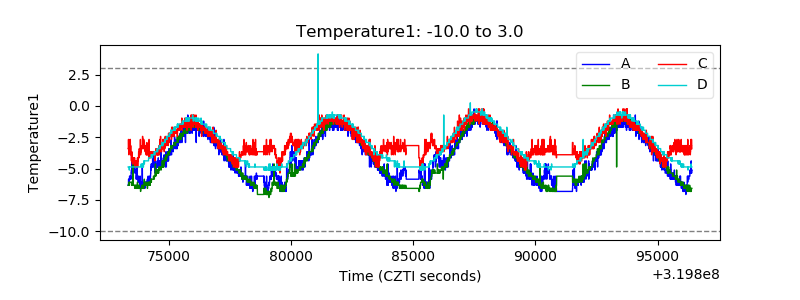 |
| Veto HV Monitor | 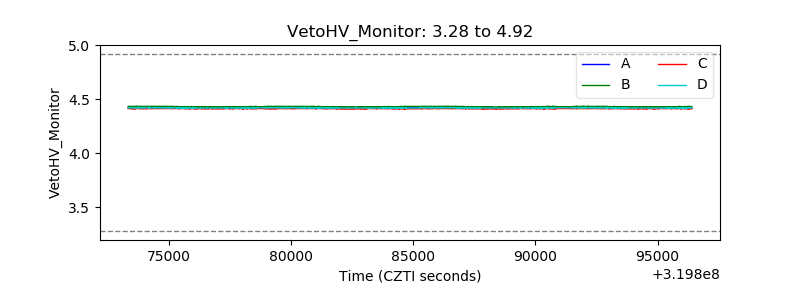 |
| Veto LLD | 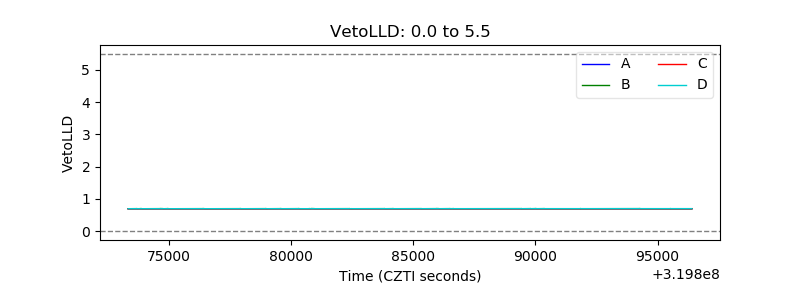 |
| Alpha Counter | 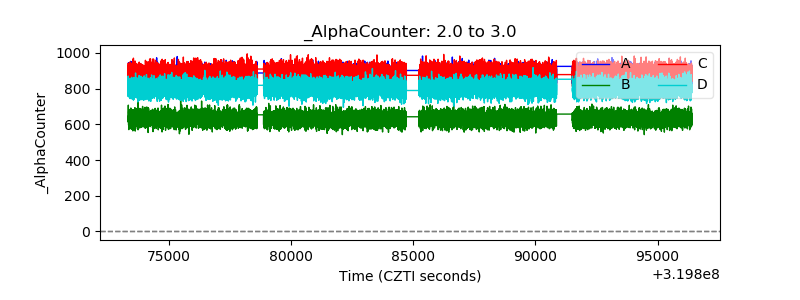 |
| _CPM_Rate | 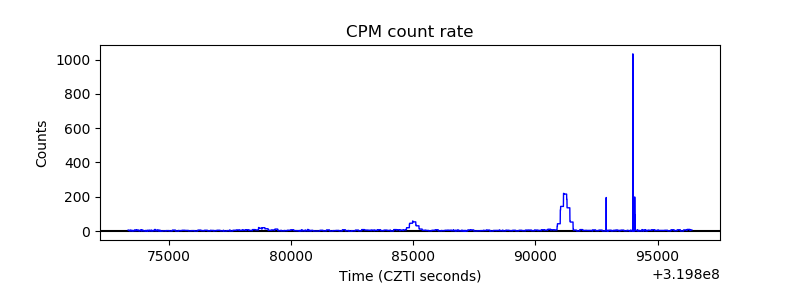 |
| CZT Counter | 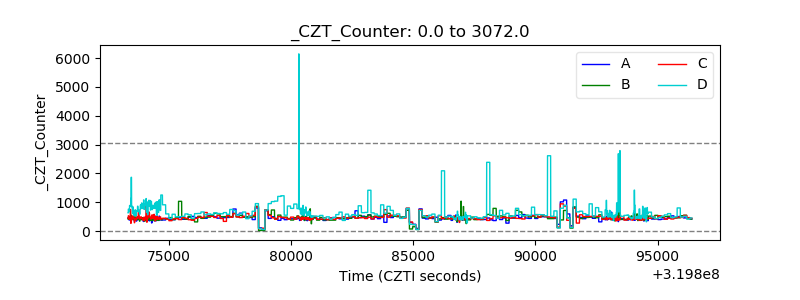 |
| +2.5 Volts monitor |  |
| +5 Volts monitor | 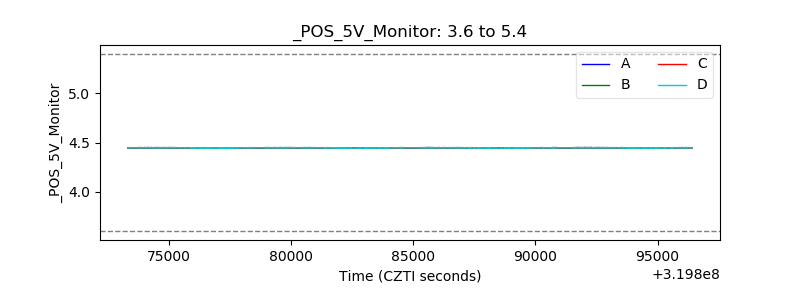 |
| _ROLL_ROT | 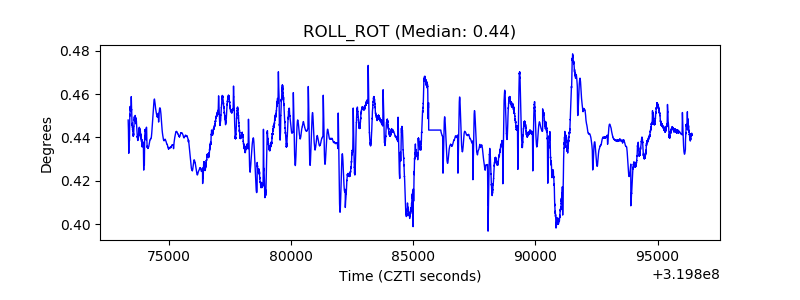 |
| _Roll_DEC | 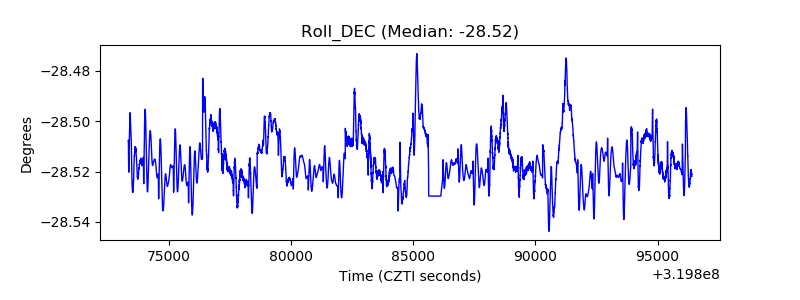 |
| _Roll_RA | 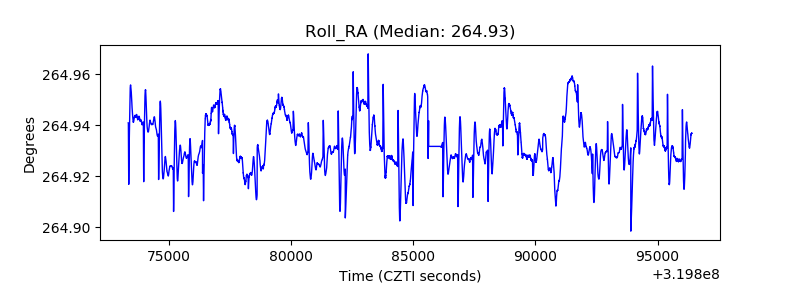 |
| Veto Counter | 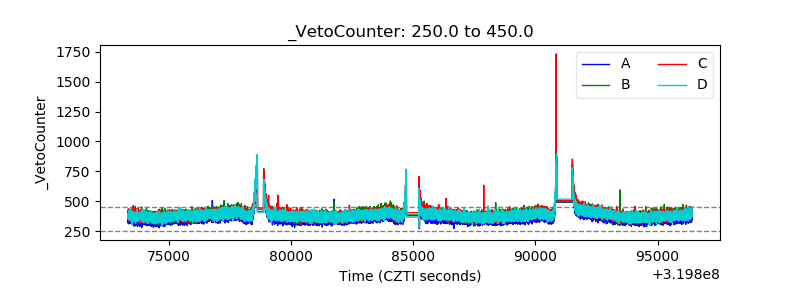 |