| Param | Original file | Final file |
|---|---|---|
| Filename | modeM0/AS1T03_180T01_9000003524_23777cztM0_level2.evt | modeM0/AS1T03_180T01_9000003524_23777cztM0_level2_quad_clean.evt |
| Size (bytes) | 548,130,240 | 101,113,920 |
| Size | 522.7 MB | 96.4 MB |
| Events in quadrant A | 3,831,573 | 637,110 |
| Events in quadrant B | 4,018,141 | 649,665 |
| Events in quadrant C | 3,887,043 | 623,308 |
| Events in quadrant D | 4,333,905 | 609,676 |
| Mode M0 | |||
|---|---|---|---|
| Quadrant | BADHDUFLAG | Total packets | Discarded packets |
| A | 0 | 16309 | 2 |
| B | 0 | 16666 | 2 |
| C | 0 | 16323 | 2 |
| D | 0 | 17637 | 2 |
| Mode SS | |||
|---|---|---|---|
| Quadrant | BADHDUFLAG | Total packets | Discarded packets |
| A | 0 | 158 | 0 |
| B | 0 | 158 | 0 |
| C | 0 | 158 | 0 |
| D | 0 | 158 | 0 |
| Mode M9 | |||
|---|---|---|---|
| Quadrant | BADHDUFLAG | Total packets | Discarded packets |
| A | 0 | 19 | 0 |
| B | 0 | 19 | 0 |
| C | 0 | 19 | 0 |
| D | 0 | 19 | 0 |
| Quadrant | Total seconds | Saturated seconds | Saturation percentage |
|---|---|---|---|
| A | 7807 | 120 | 1.537082% |
| B | 7807 | 144 | 1.844499% |
| C | 7807 | 146 | 1.870117% |
| D | 7807 | 121 | 1.549891% |
Noise dominated data is calculated using 1-second bins in cleaned event files. If a bin has >2000 counts, and if more than 50% of those come from <1% of pixels, then it is considered to be noise-dominated and hence unusable.
| Quadrant | # 1 sec bins | Bins with >0 counts | Bins with >2000 counts | High rate bins dominated by noise | Noise dominated (total time) | Noise dominated (detector-on time) | Marked lightcurve |
|---|---|---|---|---|---|---|---|
| A | 9662 | 7807 | 0 | 0 | 0.00% | 0.00% | 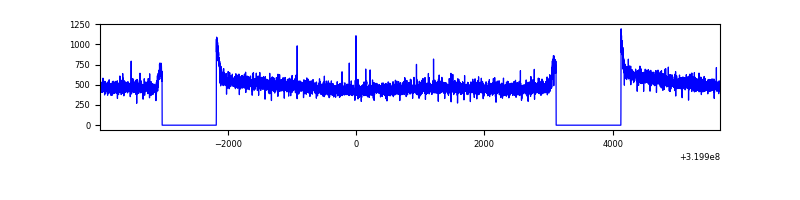 |
| B | 9662 | 7807 | 11 | 11 | 0.11% | 0.14% | 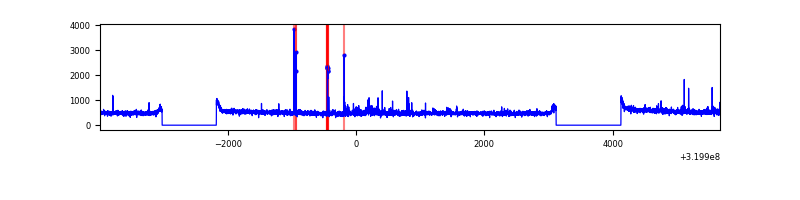 |
| C | 9662 | 7807 | 0 | 0 | 0.00% | 0.00% | 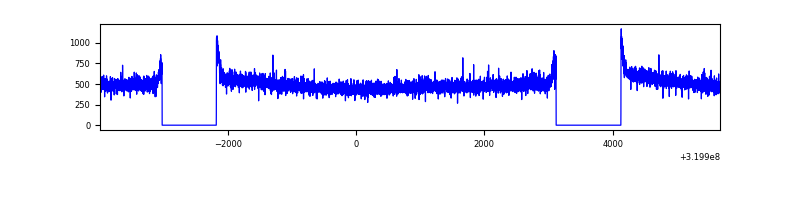 |
| D | 9662 | 7807 | 23 | 23 | 0.24% | 0.29% | 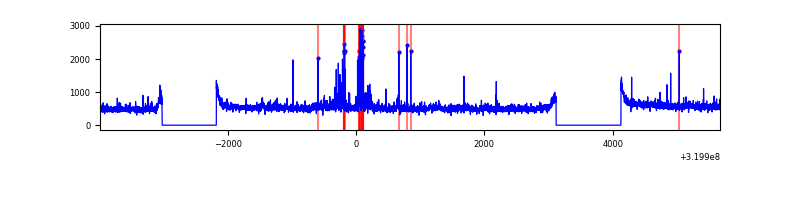 |
Top three noisy pixels from each quadrant. If the there are fewer than three noisy pixels in the level2.evt file, extra rows are filled as -1
| Pixel properties | Quadrant properties | ||||||
|---|---|---|---|---|---|---|---|
| Quadrant | DetID | PixID | Counts | Sigma | Mean | Median | Sigma |
| A | 13 | 254 | 13531 | 62.46 | 994 | 972 | 201.1 |
| A | 3 | 137 | 8610 | 37.98 | 994 | 972 | 201.1 |
| A | 0 | 226 | 8503 | 37.45 | 994 | 972 | 201.1 |
| B | 0 | 245 | 48599 | 250.35 | 987 | 960 | 190.3 |
| B | 15 | 33 | 35372 | 180.84 | 987 | 960 | 190.3 |
| B | 12 | 111 | 22583 | 113.63 | 987 | 960 | 190.3 |
| C | 14 | 238 | 150730 | 672.95 | 954 | 961 | 222.6 |
| C | 7 | 247 | 16451 | 69.6 | 954 | 961 | 222.6 |
| C | 13 | 61 | 6531 | 25.03 | 954 | 961 | 222.6 |
| D | 8 | 195 | 348422 | 1466.35 | 972 | 943 | 237.0 |
| D | 1 | 52 | 142386 | 596.89 | 972 | 943 | 237.0 |
| D | 12 | 233 | 121968 | 510.72 | 972 | 943 | 237.0 |
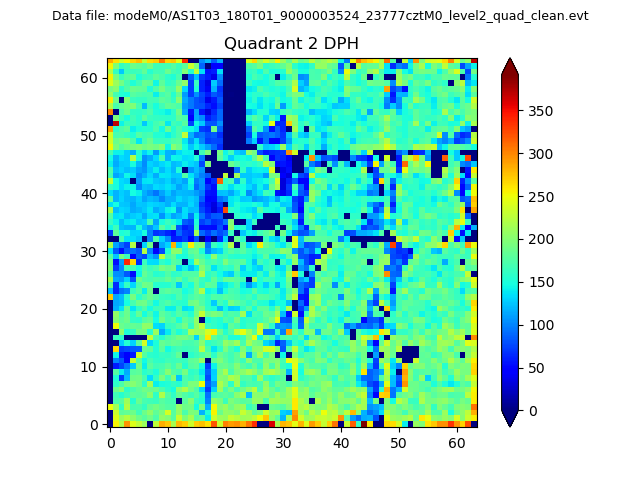
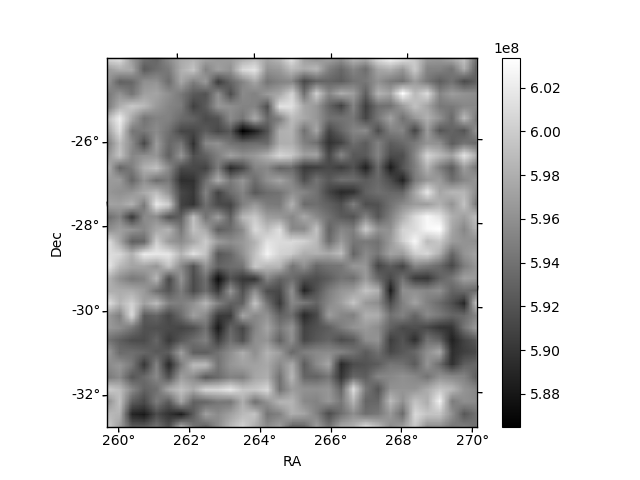
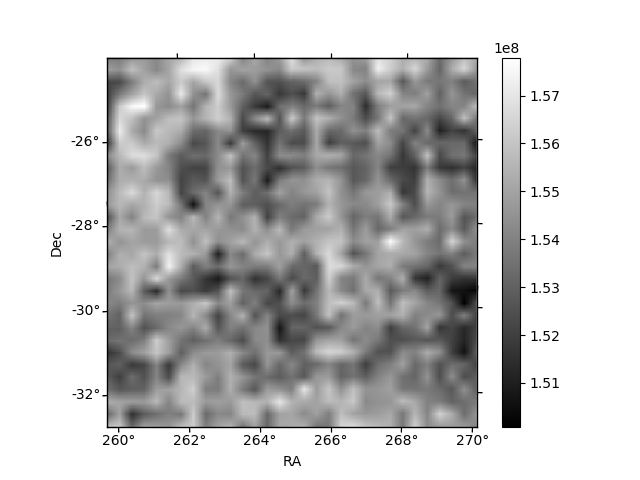
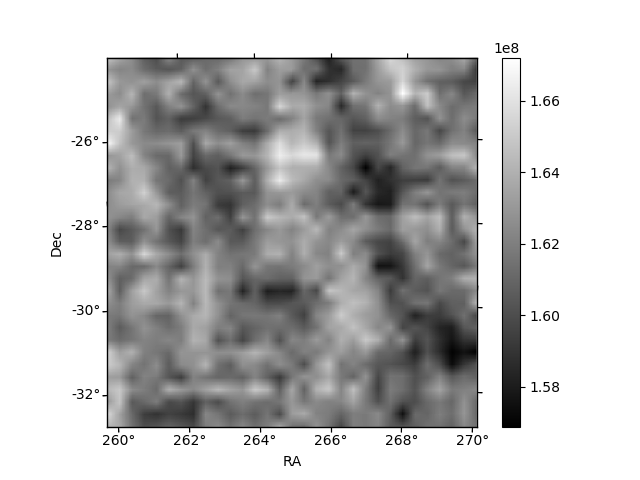
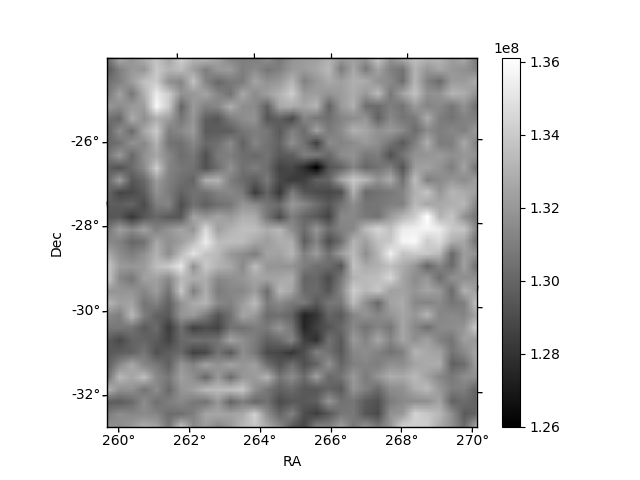
Histogram calculated using DETX and DETY for each event in the final _common_clean file
| Quadrant A | 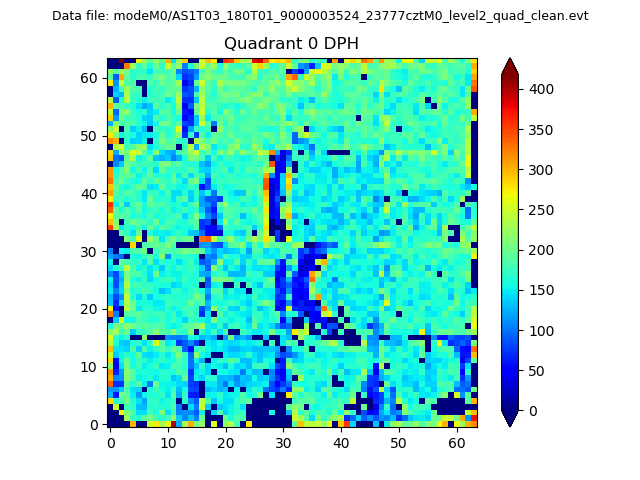 |
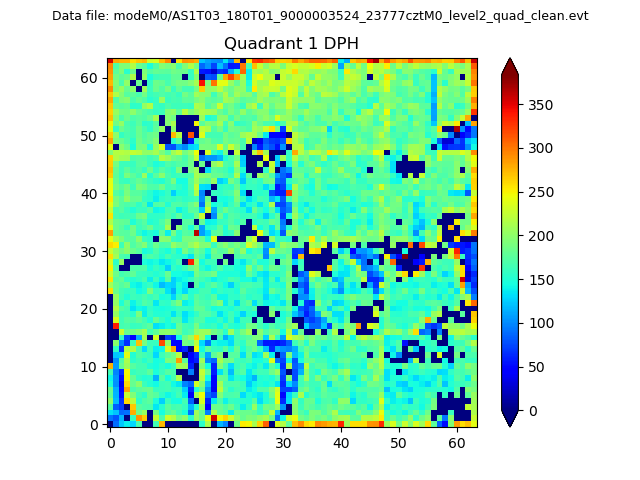 |
Quadrant B |
|---|---|---|---|
| Quadrant D | 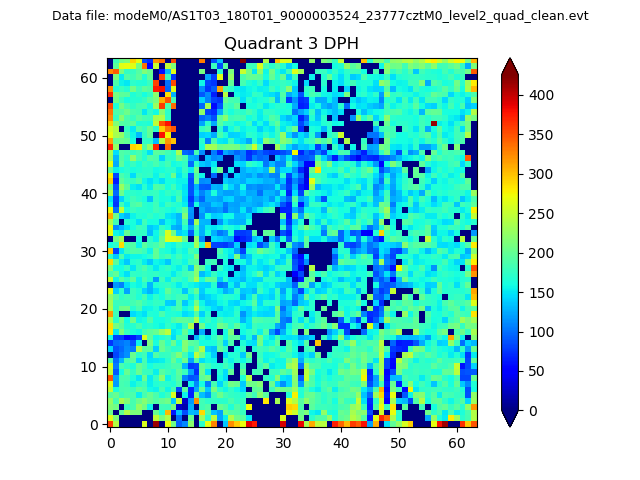 |
 |
Quadrant C |
| Plot type | Count rate plots | Images |
|---|---|---|
| Comparison with Poisson distribution Blue bars denote a histogram of data divided into 1 sec bins. Red curve is a Poisson curve with rate = median count rate of data. |
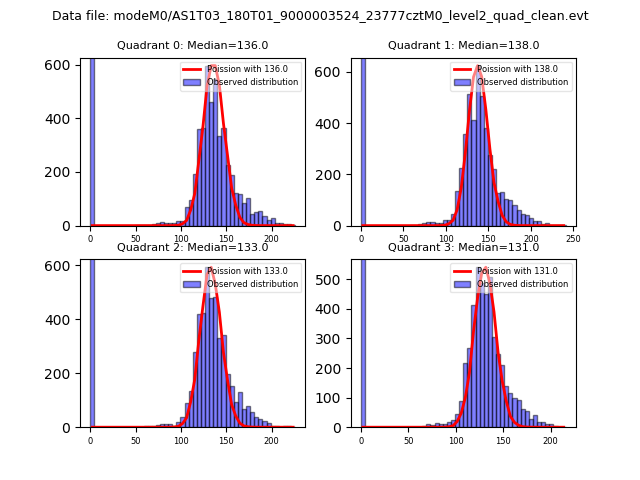 |
 |
| Quadrant-wise count rates Data is divided into 100 sec bins |
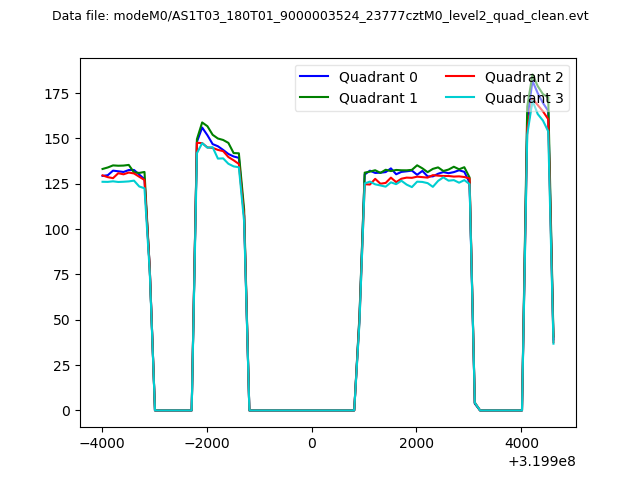 |
|
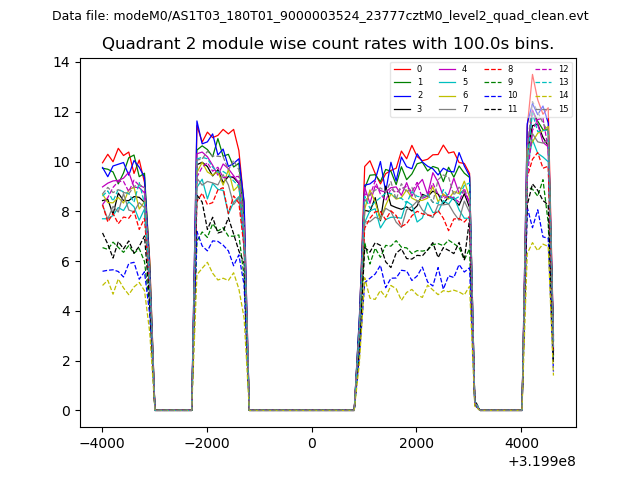
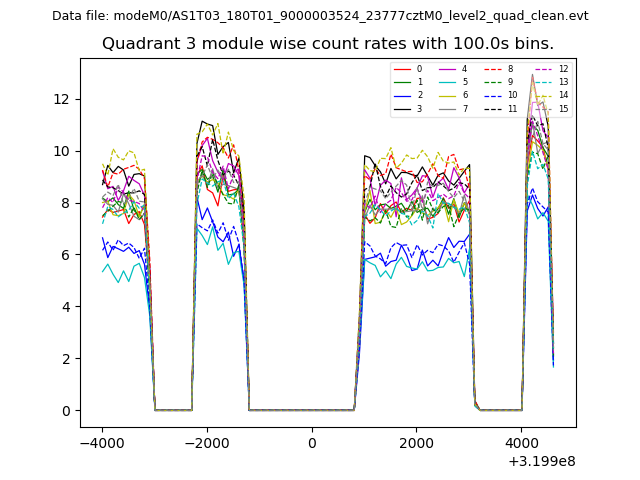
| Module-wise count rates for Quadrant A Data is divided into 100 sec bins |
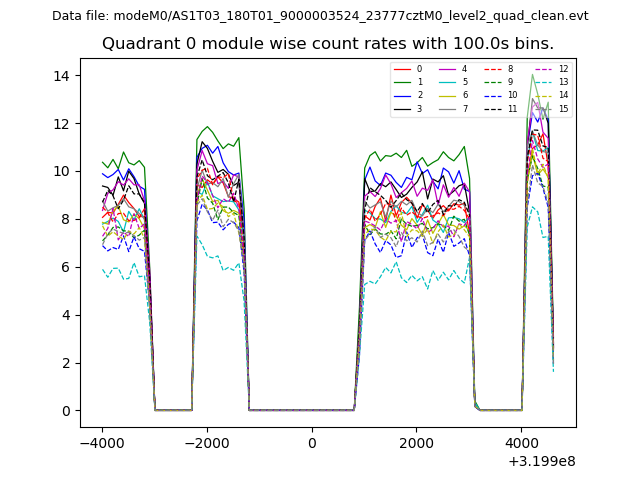 |
 |
| Module-wise count rates for Quadrant B Data is divided into 100 sec bins |
 |
 |
| Module-wise count rates for Quadrant C Data is divided into 100 sec bins |
 |
 |
| Module-wise count rates for Quadrant D Data is divided into 100 sec bins |
 |
 |
| Parameter | Plot |
|---|---|
| CZT HV Monitor |  |
| D_VDD | 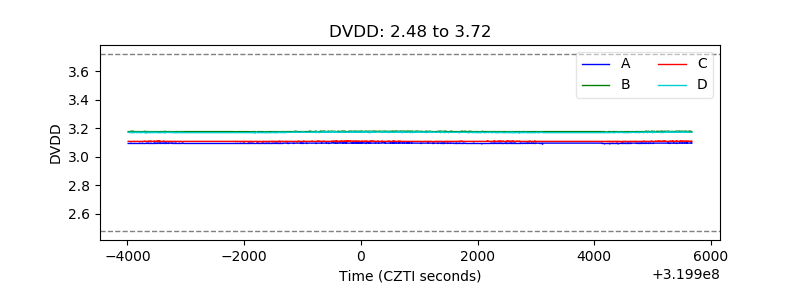 |
| Temperature 1 | 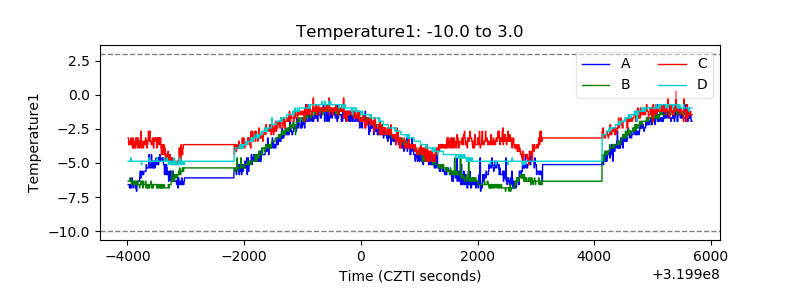 |
| Veto HV Monitor |  |
| Veto LLD | 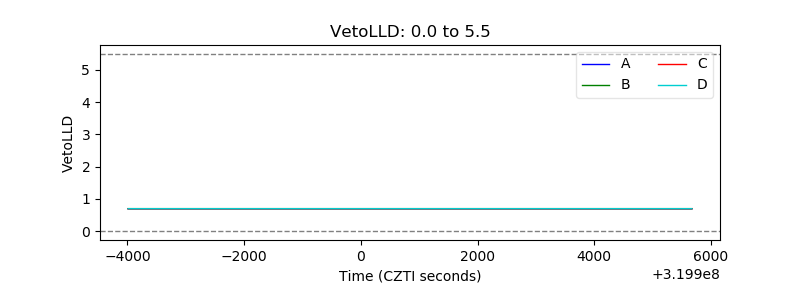 |
| Alpha Counter | 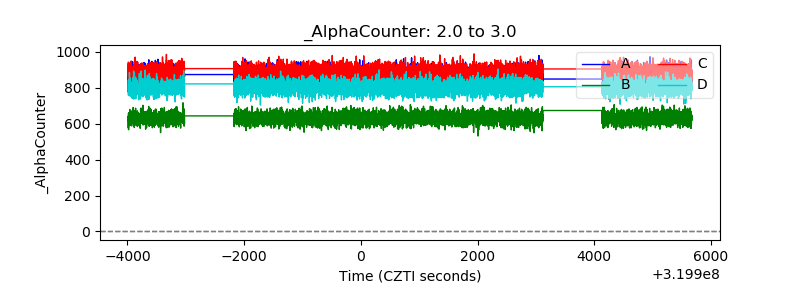 |
| _CPM_Rate | 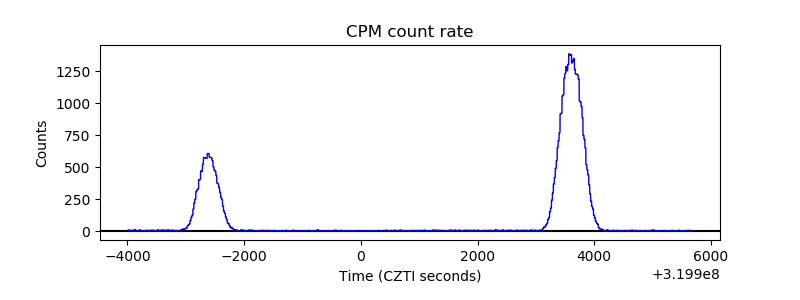 |
| CZT Counter | 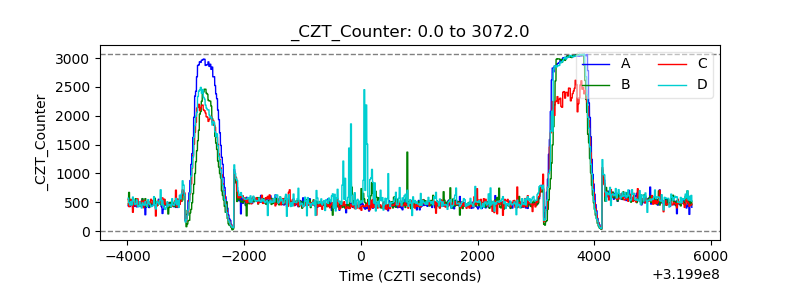 |
| +2.5 Volts monitor |  |
| +5 Volts monitor |  |
| _ROLL_ROT | 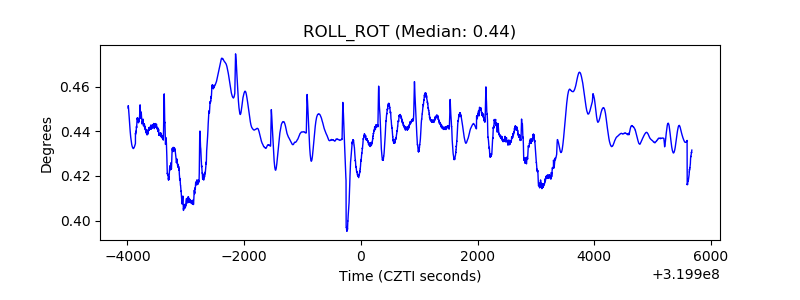 |
| _Roll_DEC | 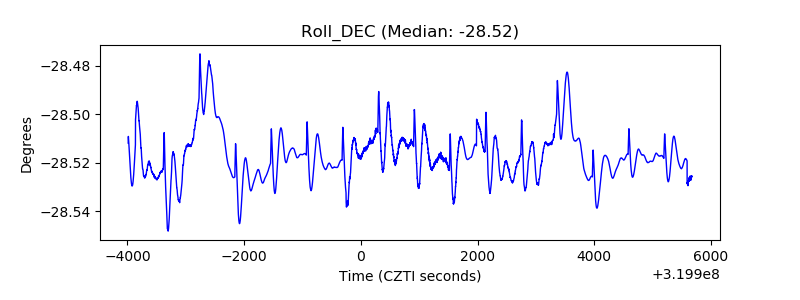 |
| _Roll_RA | 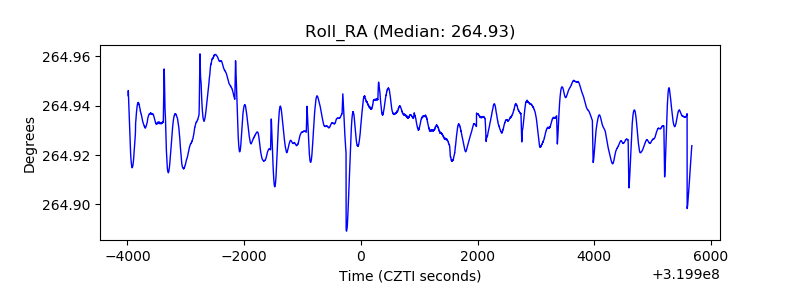 |
| Veto Counter | 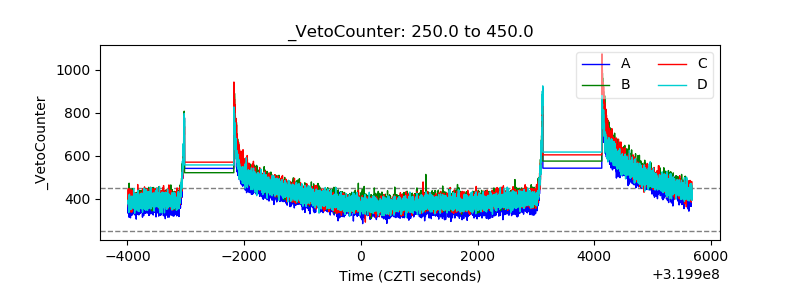 |