| Param | Original file | Final file |
|---|---|---|
| Filename | modeM0/AS1T03_180T01_9000003524_23779cztM0_level2.evt | modeM0/AS1T03_180T01_9000003524_23779cztM0_level2_quad_clean.evt |
| Size (bytes) | 486,296,640 | 69,655,680 |
| Size | 463.8 MB | 66.4 MB |
| Events in quadrant A | 3,317,549 | 422,608 |
| Events in quadrant B | 3,519,173 | 426,965 |
| Events in quadrant C | 3,315,432 | 407,665 |
| Events in quadrant D | 4,137,177 | 401,273 |
| Mode M0 | |||
|---|---|---|---|
| Quadrant | BADHDUFLAG | Total packets | Discarded packets |
| A | 0 | 13989 | 1 |
| B | 0 | 14482 | 2 |
| C | 0 | 13875 | 1 |
| D | 0 | 16497 | 1 |
| Mode SS | |||
|---|---|---|---|
| Quadrant | BADHDUFLAG | Total packets | Discarded packets |
| A | 0 | 130 | 0 |
| B | 0 | 130 | 0 |
| C | 0 | 130 | 0 |
| D | 0 | 130 | 0 |
| Mode M9 | |||
|---|---|---|---|
| Quadrant | BADHDUFLAG | Total packets | Discarded packets |
| A | 0 | 12 | 0 |
| B | 0 | 12 | 0 |
| C | 0 | 12 | 0 |
| D | 0 | 12 | 0 |
| Quadrant | Total seconds | Saturated seconds | Saturation percentage |
|---|---|---|---|
| A | 6461 | 48 | 0.742919% |
| B | 6461 | 72 | 1.114379% |
| C | 6461 | 66 | 1.021514% |
| D | 6461 | 39 | 0.603622% |
Noise dominated data is calculated using 1-second bins in cleaned event files. If a bin has >2000 counts, and if more than 50% of those come from <1% of pixels, then it is considered to be noise-dominated and hence unusable.
| Quadrant | # 1 sec bins | Bins with >0 counts | Bins with >2000 counts | High rate bins dominated by noise | Noise dominated (total time) | Noise dominated (detector-on time) | Marked lightcurve |
|---|---|---|---|---|---|---|---|
| A | 7631 | 6461 | 0 | 0 | 0.00% | 0.00% | 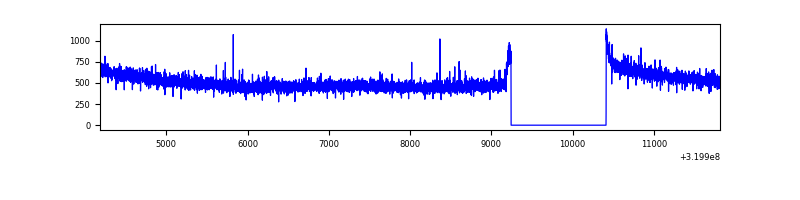 |
| B | 7631 | 6461 | 8 | 8 | 0.10% | 0.12% | 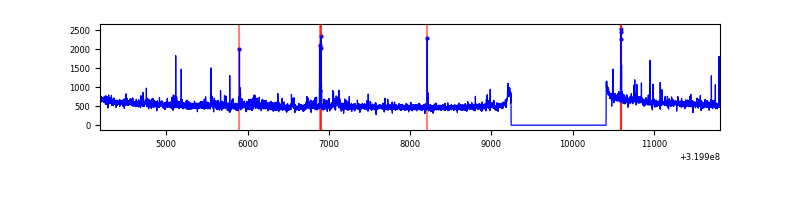 |
| C | 7631 | 6461 | 0 | 0 | 0.00% | 0.00% | 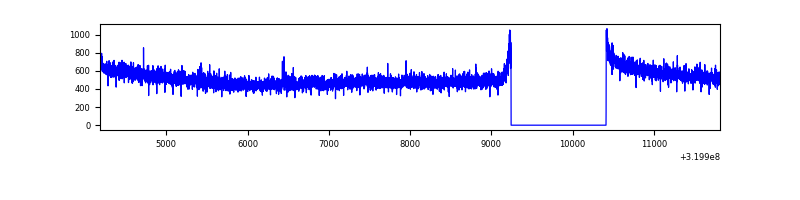 |
| D | 7631 | 6461 | 8 | 8 | 0.10% | 0.12% | 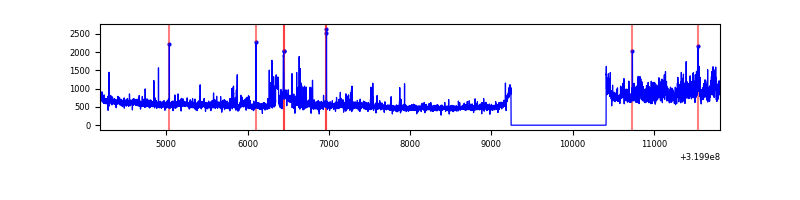 |
Top three noisy pixels from each quadrant. If the there are fewer than three noisy pixels in the level2.evt file, extra rows are filled as -1
| Pixel properties | Quadrant properties | ||||||
|---|---|---|---|---|---|---|---|
| Quadrant | DetID | PixID | Counts | Sigma | Mean | Median | Sigma |
| A | 13 | 254 | 10859 | 58.59 | 860 | 844 | 170.9 |
| A | 0 | 226 | 7601 | 39.53 | 860 | 844 | 170.9 |
| A | 3 | 137 | 7126 | 36.75 | 860 | 844 | 170.9 |
| B | 0 | 189 | 76747 | 476.93 | 850 | 832 | 159.2 |
| B | 0 | 245 | 43424 | 267.58 | 850 | 832 | 159.2 |
| B | 3 | 64 | 35901 | 220.32 | 850 | 832 | 159.2 |
| C | 14 | 238 | 129846 | 686.29 | 815 | 823 | 188.0 |
| C | 7 | 247 | 8548 | 41.09 | 815 | 823 | 188.0 |
| C | 13 | 61 | 5655 | 25.7 | 815 | 823 | 188.0 |
| D | 8 | 195 | 746612 | 3696.75 | 835 | 812 | 201.7 |
| D | 1 | 52 | 175422 | 865.5 | 835 | 812 | 201.7 |
| D | 9 | 85 | 31751 | 153.36 | 835 | 812 | 201.7 |
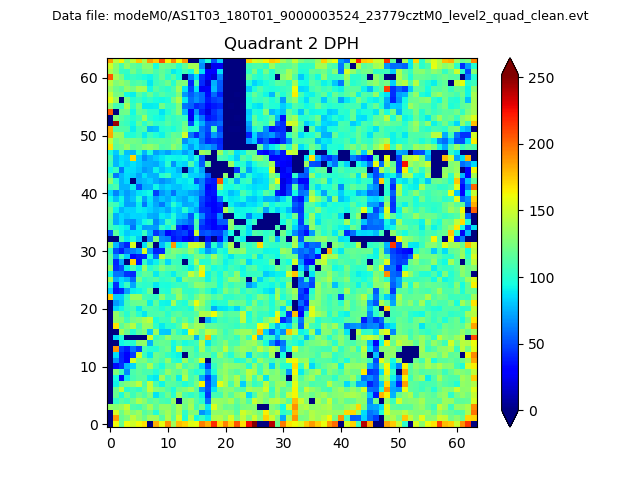
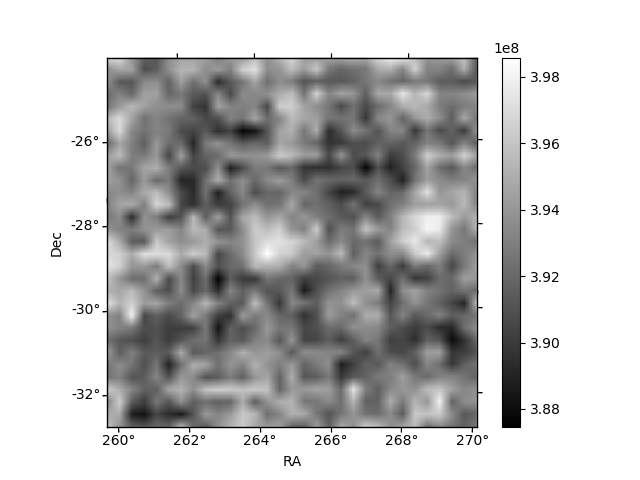
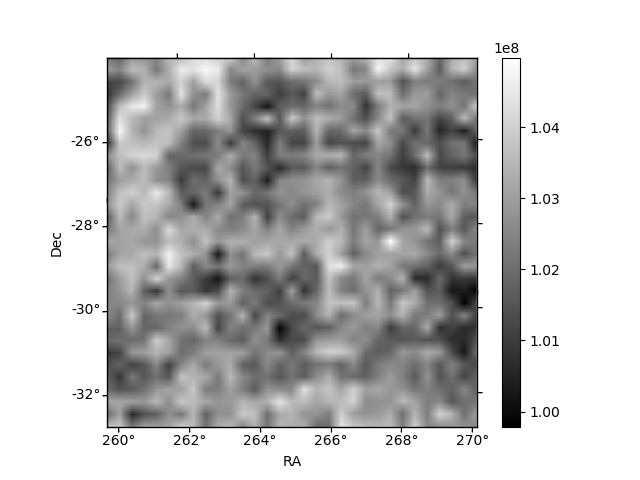
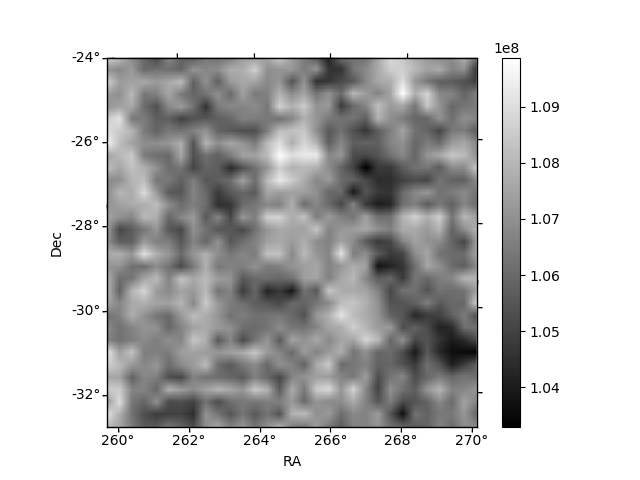
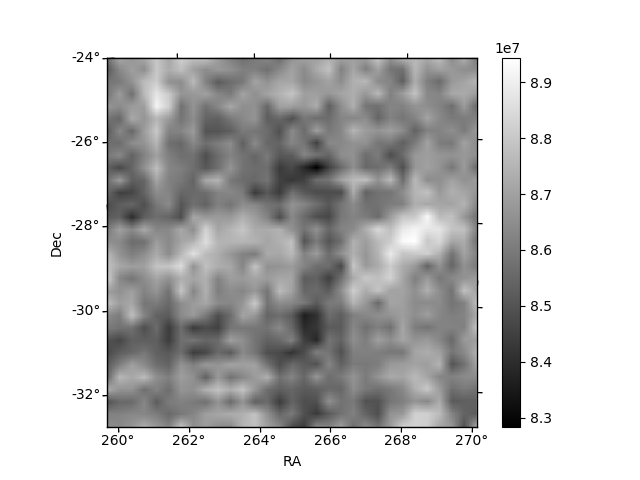
Histogram calculated using DETX and DETY for each event in the final _common_clean file
| Quadrant A | 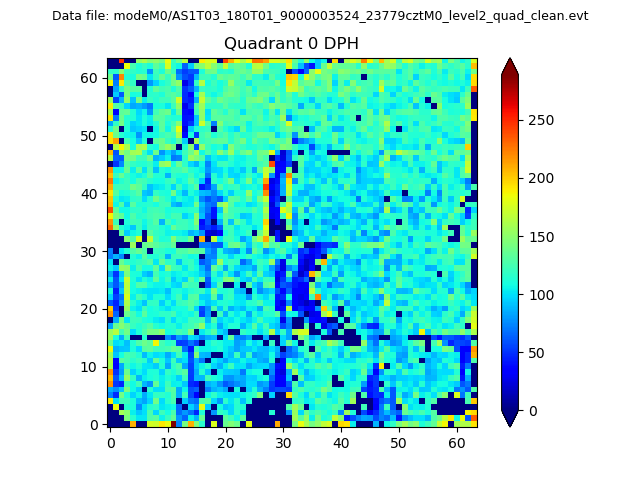 |
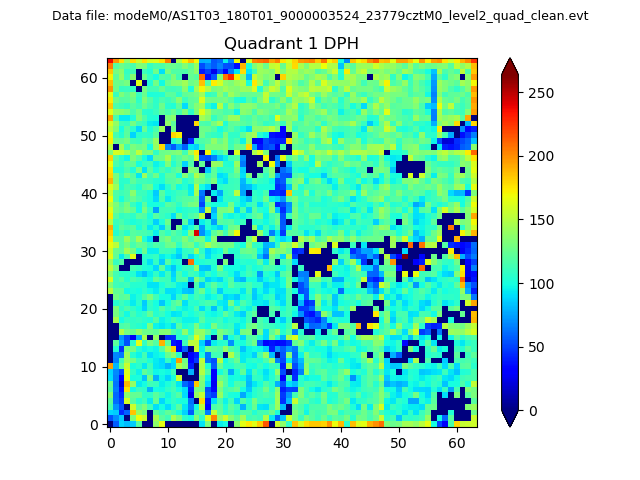 |
Quadrant B |
|---|---|---|---|
| Quadrant D | 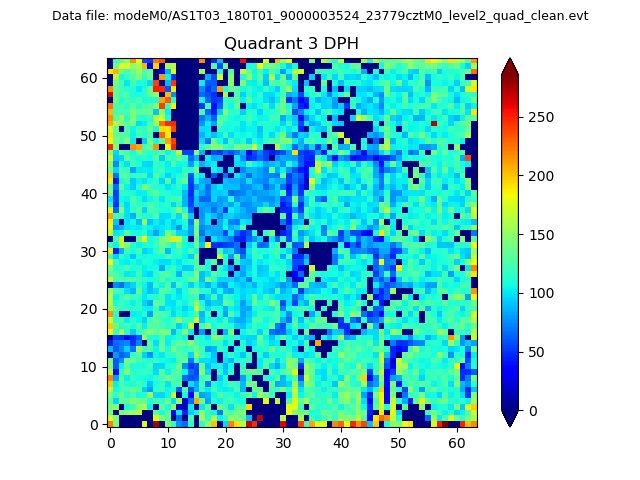 |
 |
Quadrant C |
| Plot type | Count rate plots | Images |
|---|---|---|
| Comparison with Poisson distribution Blue bars denote a histogram of data divided into 1 sec bins. Red curve is a Poisson curve with rate = median count rate of data. |
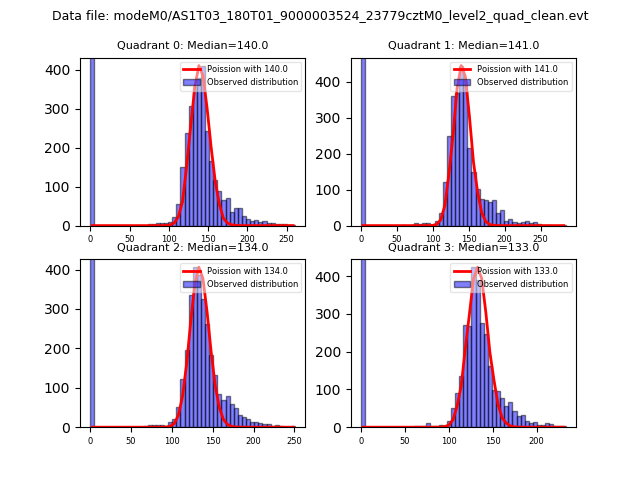 |
 |
| Quadrant-wise count rates Data is divided into 100 sec bins |
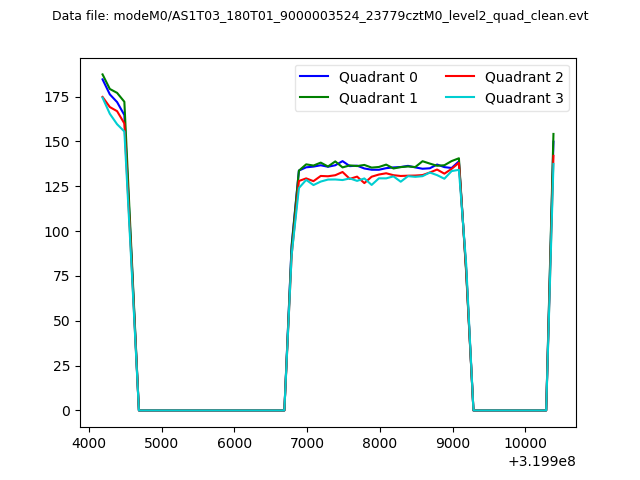 |
|
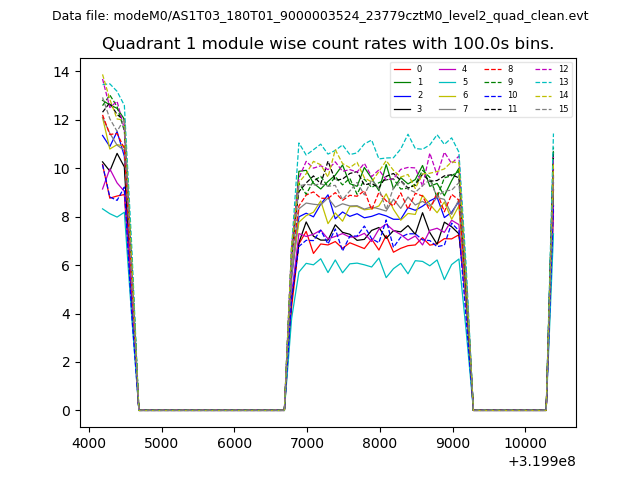
| Module-wise count rates for Quadrant A Data is divided into 100 sec bins |
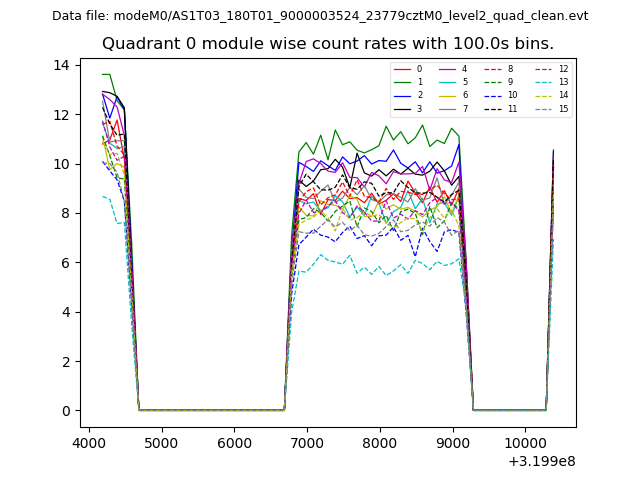 |
 |
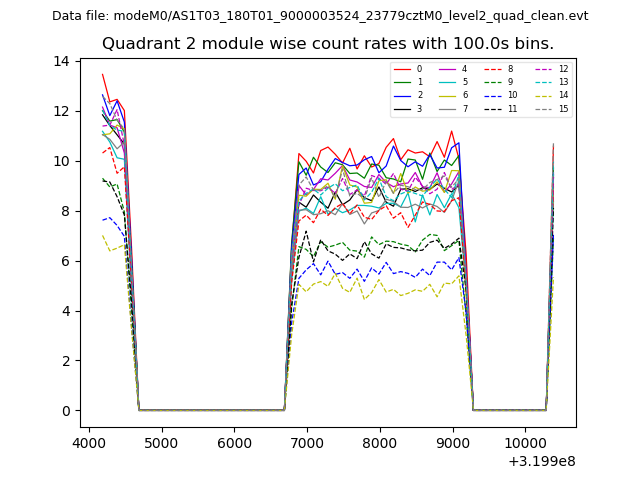
| Module-wise count rates for Quadrant B Data is divided into 100 sec bins |
 |
 |
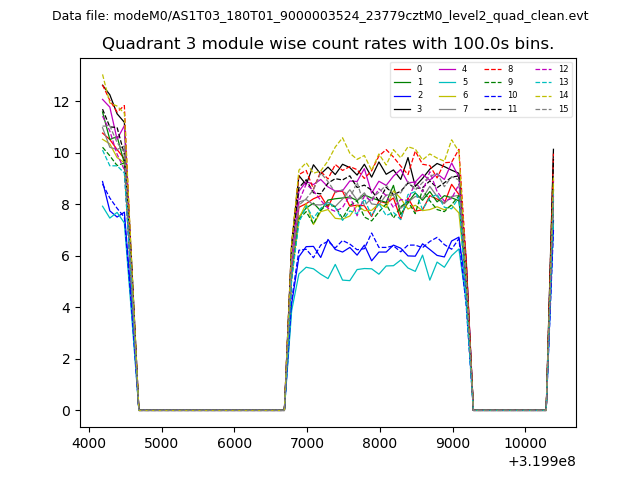
| Module-wise count rates for Quadrant C Data is divided into 100 sec bins |
 |
 |
| Module-wise count rates for Quadrant D Data is divided into 100 sec bins |
 |
 |
| Parameter | Plot |
|---|---|
| CZT HV Monitor | 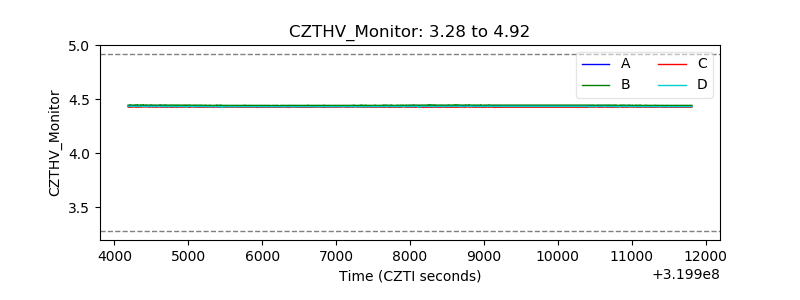 |
| D_VDD | 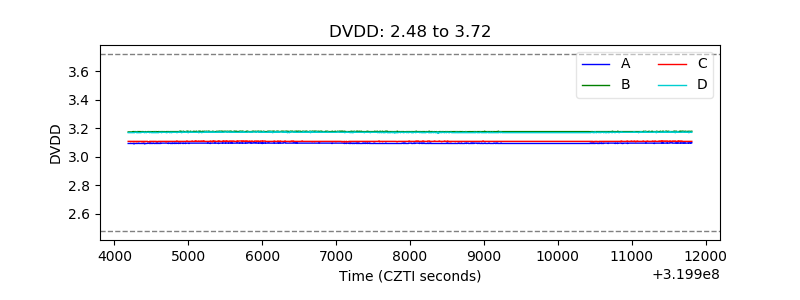 |
| Temperature 1 | 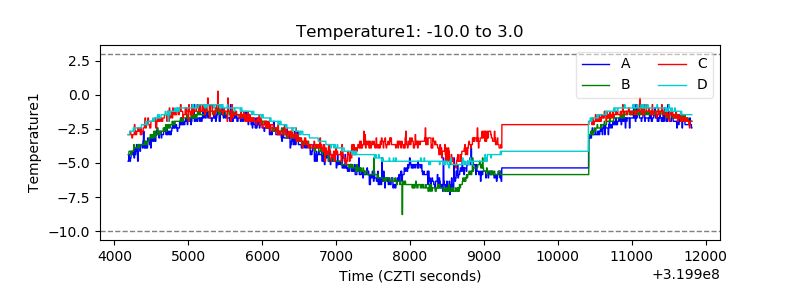 |
| Veto HV Monitor | 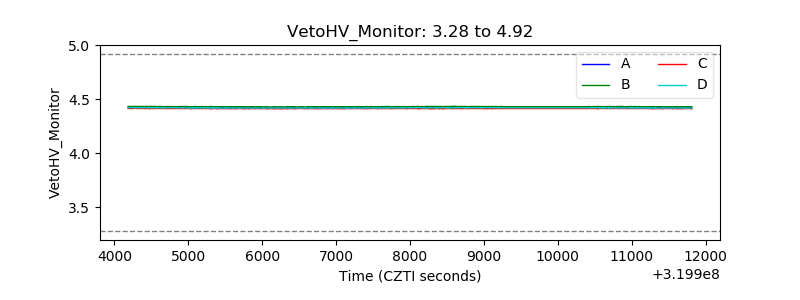 |
| Veto LLD | 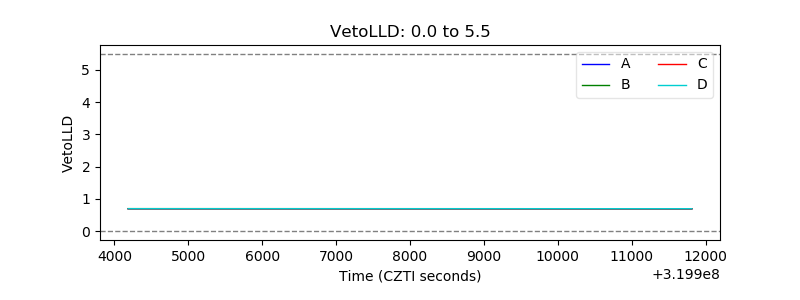 |
| Alpha Counter | 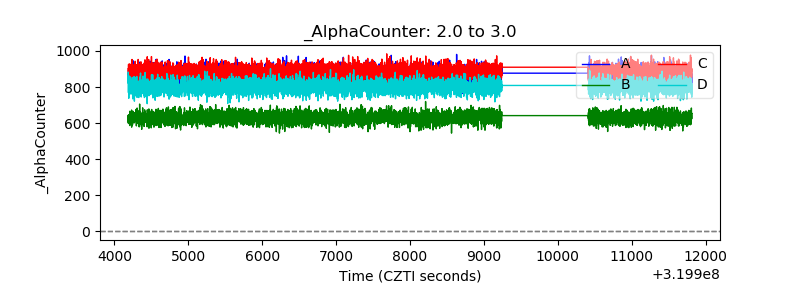 |
| _CPM_Rate | 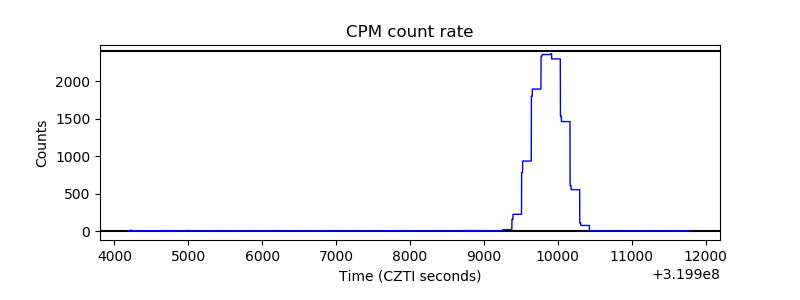 |
| CZT Counter | 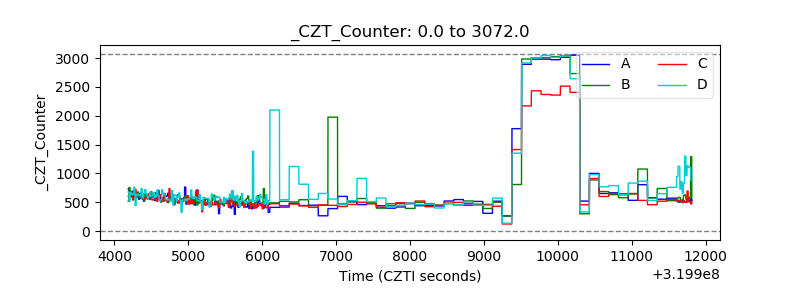 |
| +2.5 Volts monitor | 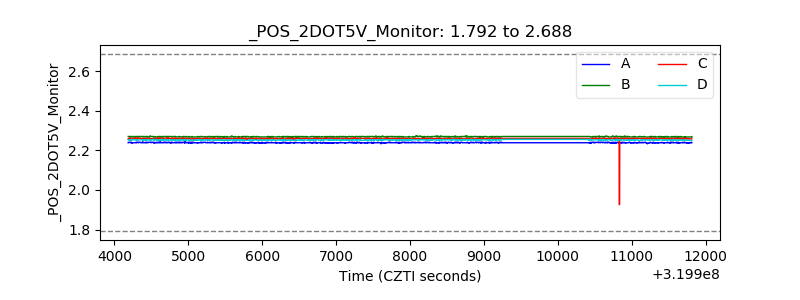 |
| +5 Volts monitor |  |
| _ROLL_ROT | 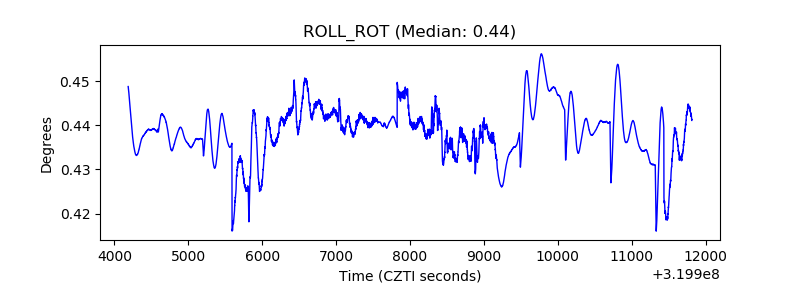 |
| _Roll_DEC | 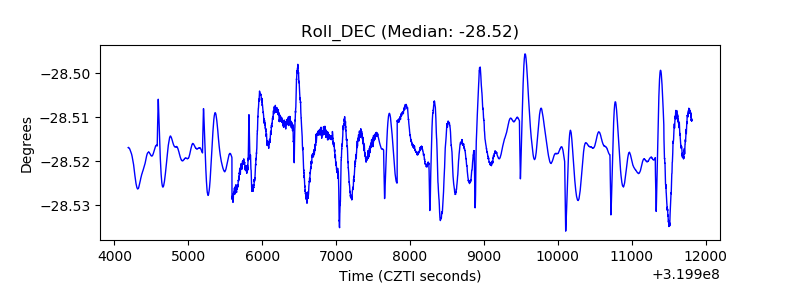 |
| _Roll_RA | 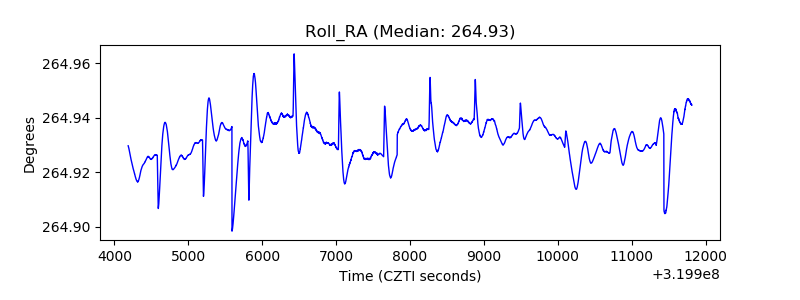 |
| Veto Counter | 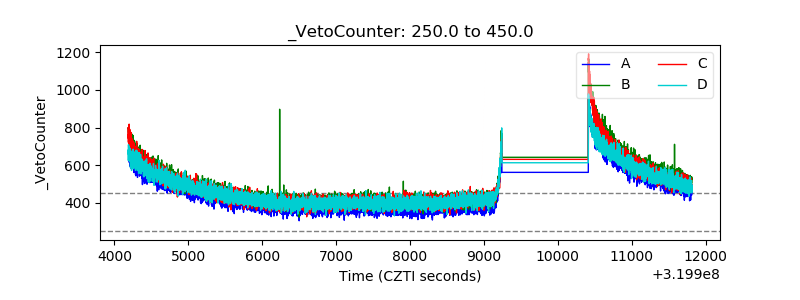 |