| Param | Original file | Final file |
|---|---|---|
| Filename | modeM0/AS1T03_180T01_9000003524_23780cztM0_level2.evt | modeM0/AS1T03_180T01_9000003524_23780cztM0_level2_quad_clean.evt |
| Size (bytes) | 526,299,840 | 65,136,960 |
| Size | 501.9 MB | 62.1 MB |
| Events in quadrant A | 3,378,614 | 392,119 |
| Events in quadrant B | 3,960,421 | 396,461 |
| Events in quadrant C | 3,380,126 | 378,142 |
| Events in quadrant D | 4,795,072 | 367,854 |
| Mode M0 | |||
|---|---|---|---|
| Quadrant | BADHDUFLAG | Total packets | Discarded packets |
| A | 0 | 14087 | 2 |
| B | 0 | 15813 | 1 |
| C | 0 | 13928 | 1 |
| D | 0 | 18666 | 1 |
| Mode SS | |||
|---|---|---|---|
| Quadrant | BADHDUFLAG | Total packets | Discarded packets |
| A | 0 | 128 | 0 |
| B | 0 | 128 | 0 |
| C | 0 | 128 | 0 |
| D | 0 | 128 | 0 |
| Mode M9 | |||
|---|---|---|---|
| Quadrant | BADHDUFLAG | Total packets | Discarded packets |
| A | 0 | 12 | 0 |
| B | 0 | 12 | 0 |
| C | 0 | 12 | 0 |
| D | 0 | 12 | 0 |
| Quadrant | Total seconds | Saturated seconds | Saturation percentage |
|---|---|---|---|
| A | 6267 | 66 | 1.053135% |
| B | 6267 | 264 | 4.212542% |
| C | 6267 | 97 | 1.547790% |
| D | 6267 | 129 | 2.058401% |
Noise dominated data is calculated using 1-second bins in cleaned event files. If a bin has >2000 counts, and if more than 50% of those come from <1% of pixels, then it is considered to be noise-dominated and hence unusable.
| Quadrant | # 1 sec bins | Bins with >0 counts | Bins with >2000 counts | High rate bins dominated by noise | Noise dominated (total time) | Noise dominated (detector-on time) | Marked lightcurve |
|---|---|---|---|---|---|---|---|
| A | 7527 | 6267 | 0 | 0 | 0.00% | 0.00% | 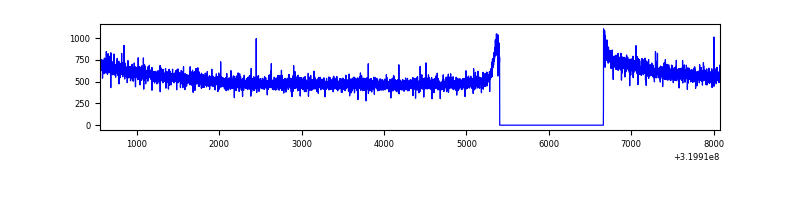 |
| B | 7527 | 6267 | 155 | 155 | 2.06% | 2.47% | 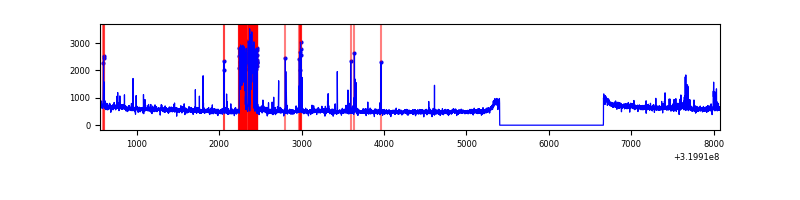 |
| C | 7527 | 6267 | 0 | 0 | 0.00% | 0.00% | 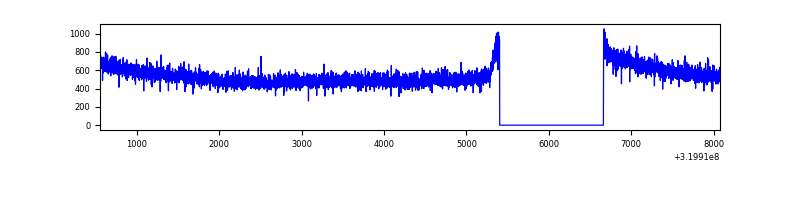 |
| D | 7527 | 6267 | 63 | 63 | 0.84% | 1.01% | 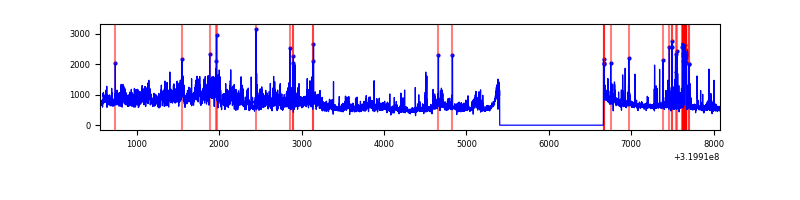 |
Top three noisy pixels from each quadrant. If the there are fewer than three noisy pixels in the level2.evt file, extra rows are filled as -1
| Pixel properties | Quadrant properties | ||||||
|---|---|---|---|---|---|---|---|
| Quadrant | DetID | PixID | Counts | Sigma | Mean | Median | Sigma |
| A | 13 | 254 | 11501 | 61.54 | 876 | 861 | 172.9 |
| A | 0 | 226 | 7794 | 40.1 | 876 | 861 | 172.9 |
| A | 3 | 137 | 6981 | 35.4 | 876 | 861 | 172.9 |
| B | 3 | 64 | 532575 | 3333.56 | 860 | 844 | 159.5 |
| B | 0 | 189 | 18839 | 112.82 | 860 | 844 | 159.5 |
| B | 12 | 111 | 17837 | 106.53 | 860 | 844 | 159.5 |
| C | 14 | 238 | 133603 | 701.89 | 828 | 836 | 189.2 |
| C | 4 | 175 | 12186 | 60.0 | 828 | 836 | 189.2 |
| C | 13 | 61 | 5760 | 26.03 | 828 | 836 | 189.2 |
| D | 8 | 195 | 1133984 | 5667.18 | 839 | 819 | 200.0 |
| D | 1 | 52 | 160282 | 797.51 | 839 | 819 | 200.0 |
| D | 12 | 233 | 149944 | 745.8 | 839 | 819 | 200.0 |
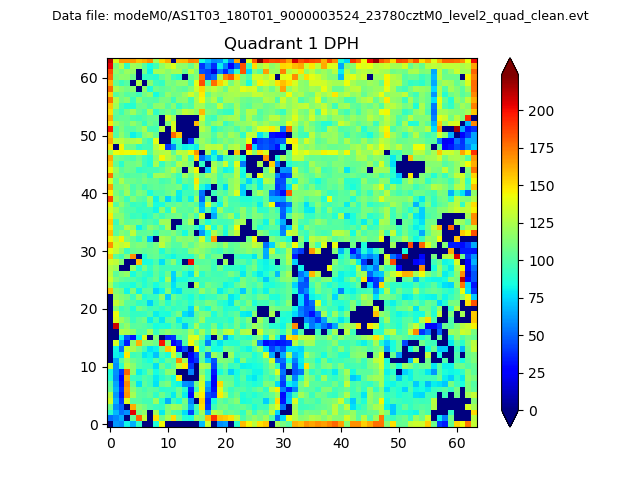
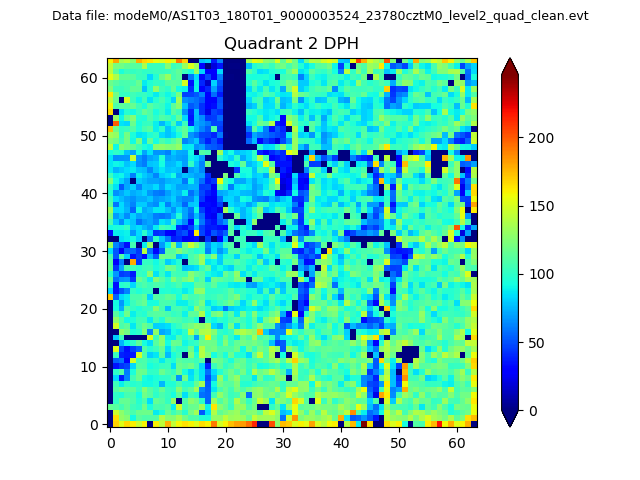
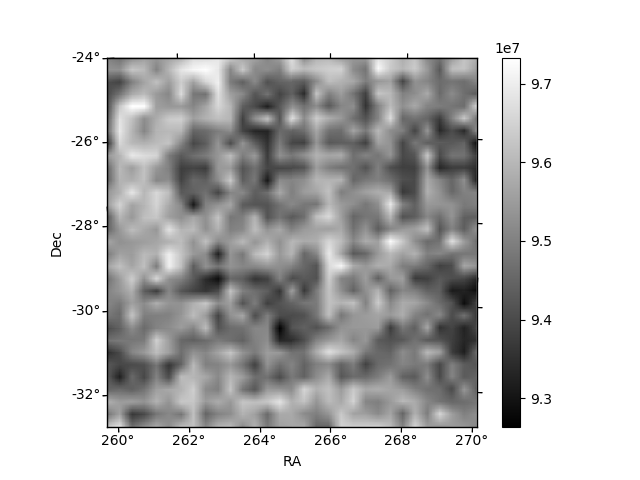
Histogram calculated using DETX and DETY for each event in the final _common_clean file
| Quadrant A |  |
 |
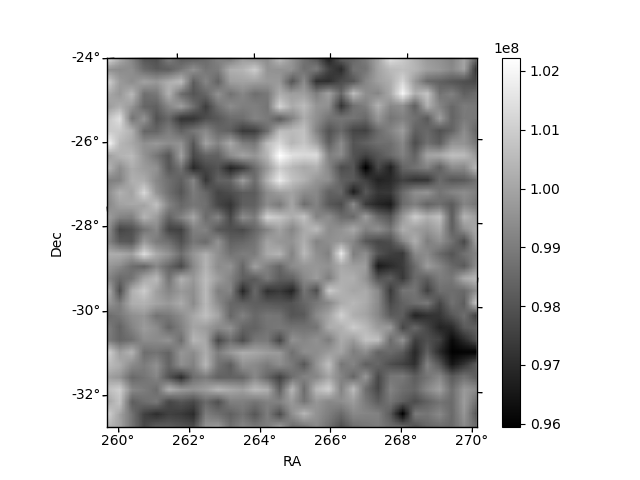
Quadrant B |
|---|---|---|---|
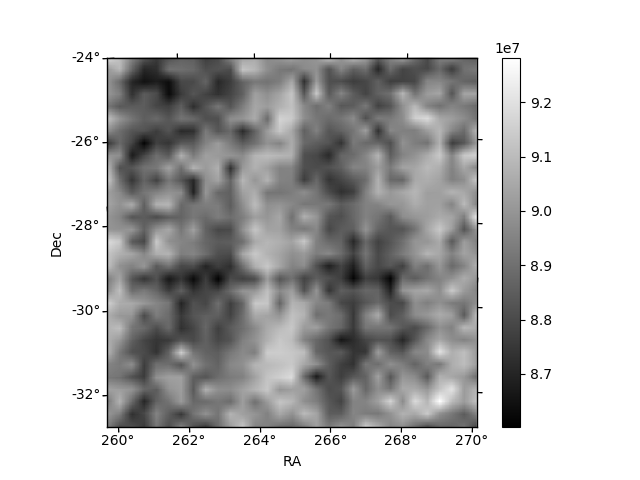
| Quadrant D |  |
 |
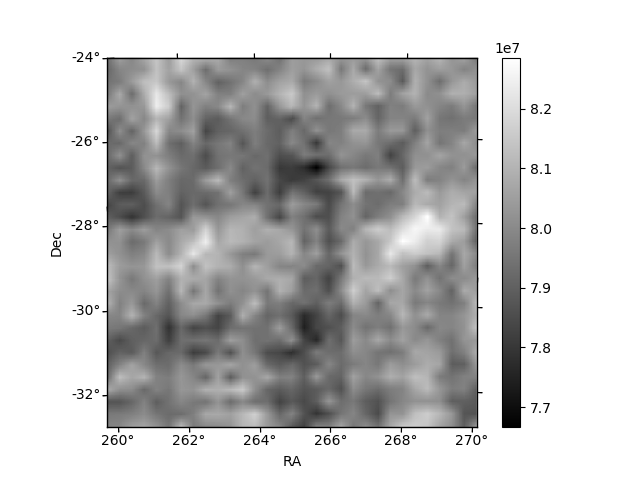
Quadrant C |
| Plot type | Count rate plots | Images |
|---|---|---|
| Comparison with Poisson distribution Blue bars denote a histogram of data divided into 1 sec bins. Red curve is a Poisson curve with rate = median count rate of data. |
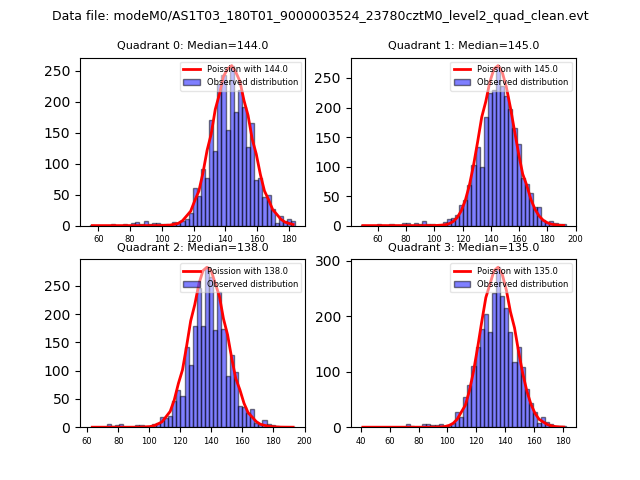 |
 |
| Quadrant-wise count rates Data is divided into 100 sec bins |
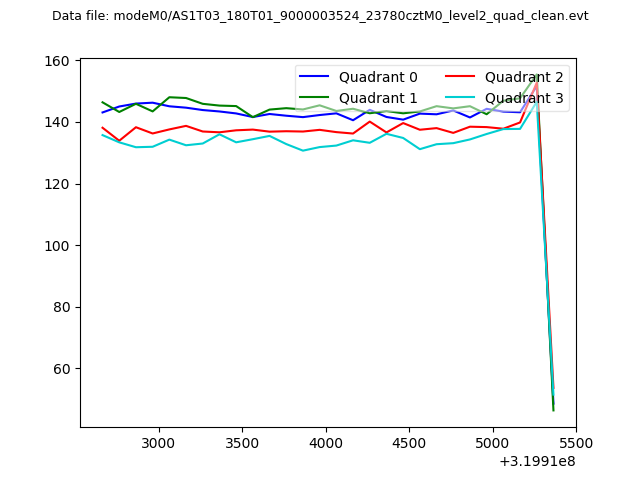 |
|
| Module-wise count rates for Quadrant A Data is divided into 100 sec bins |
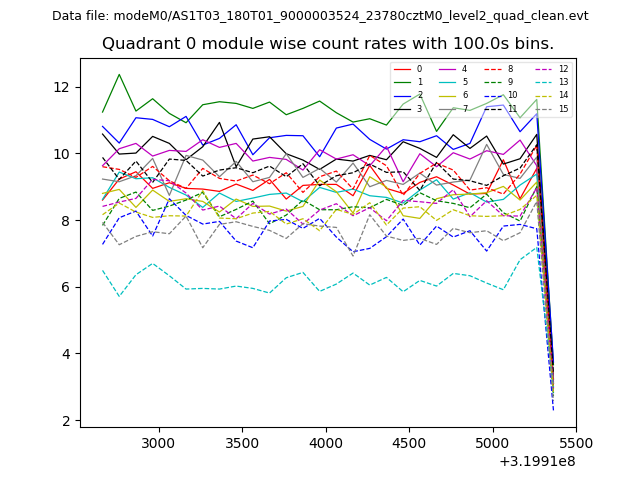 |
 |
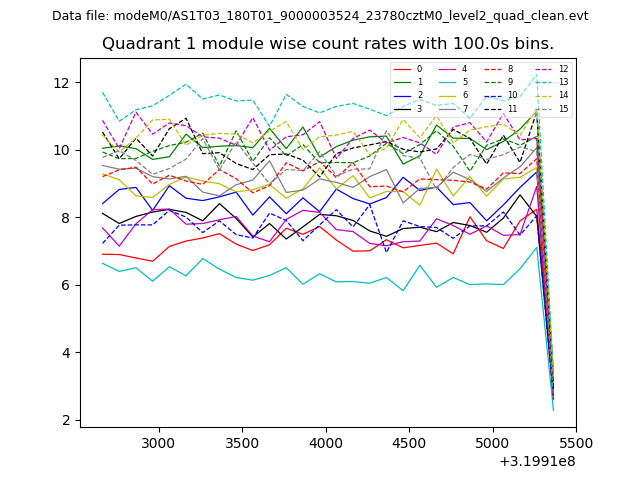
| Module-wise count rates for Quadrant B Data is divided into 100 sec bins |
 |
 |
| Module-wise count rates for Quadrant C Data is divided into 100 sec bins |
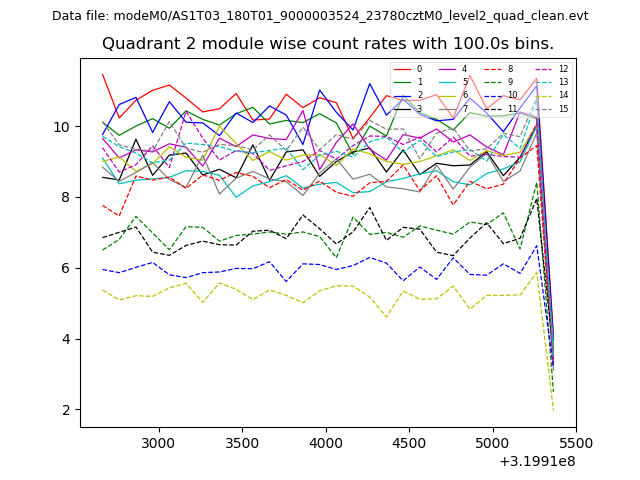 |
 |
| Module-wise count rates for Quadrant D Data is divided into 100 sec bins |
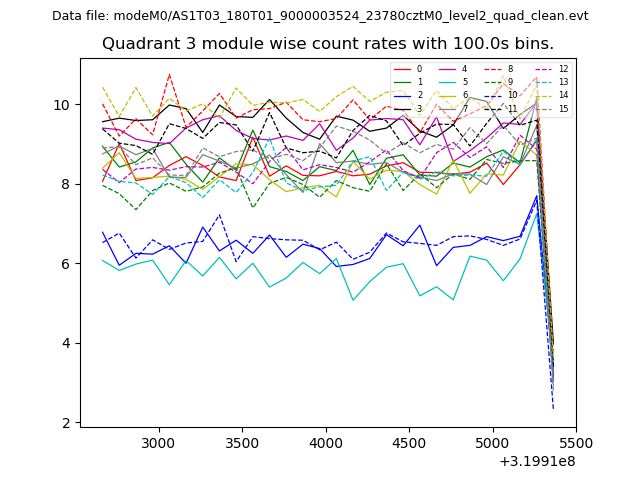 |
 |
| Parameter | Plot |
|---|---|
| CZT HV Monitor | 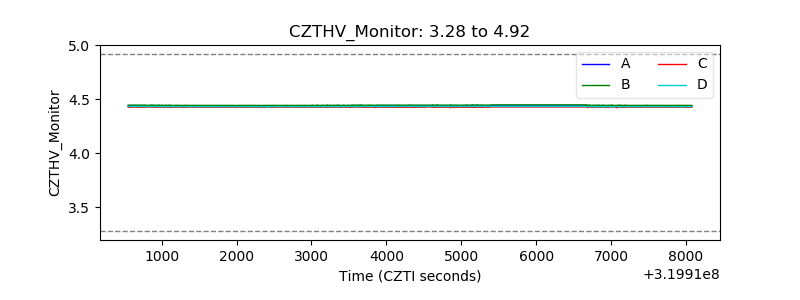 |
| D_VDD | 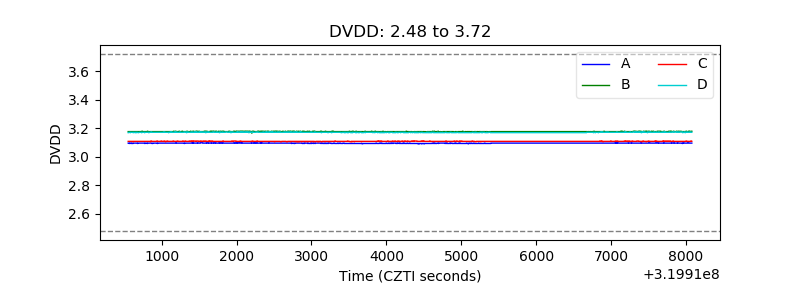 |
| Temperature 1 | 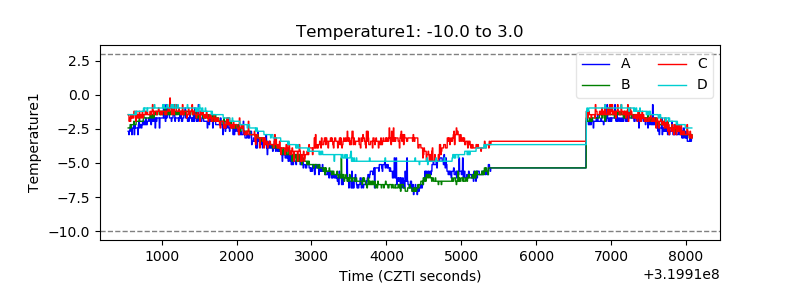 |
| Veto HV Monitor | 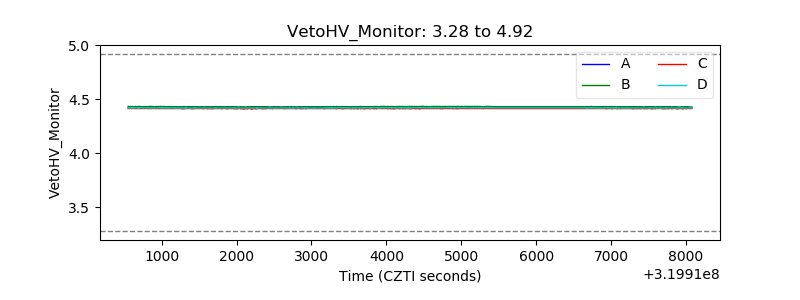 |
| Veto LLD | 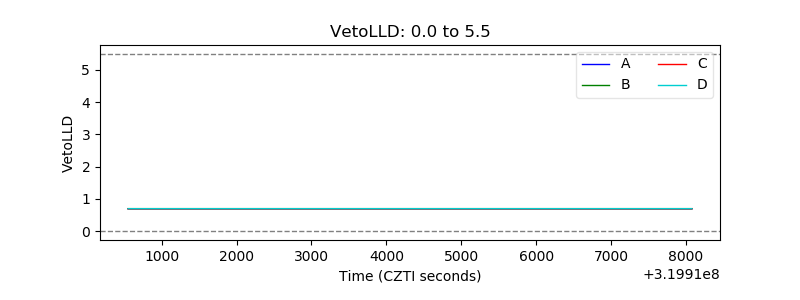 |
| Alpha Counter | 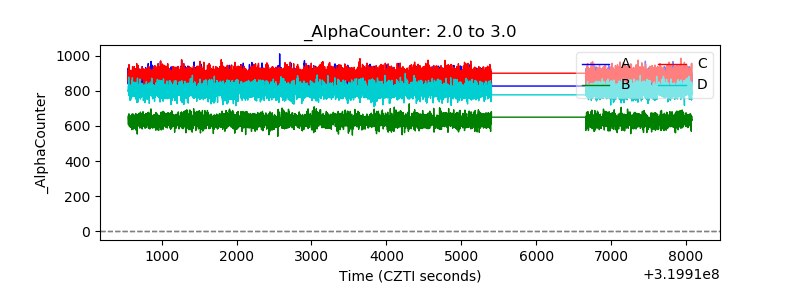 |
| _CPM_Rate | 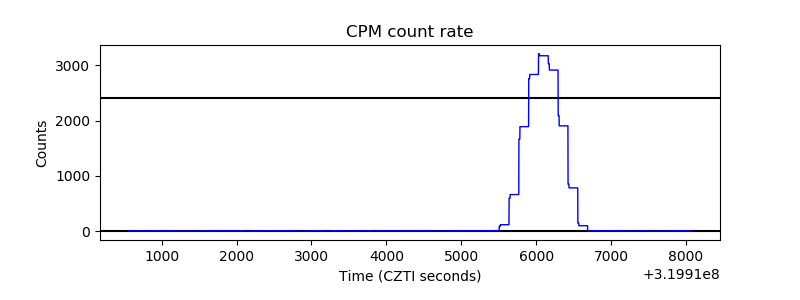 |
| CZT Counter |  |
| +2.5 Volts monitor |  |
| +5 Volts monitor | 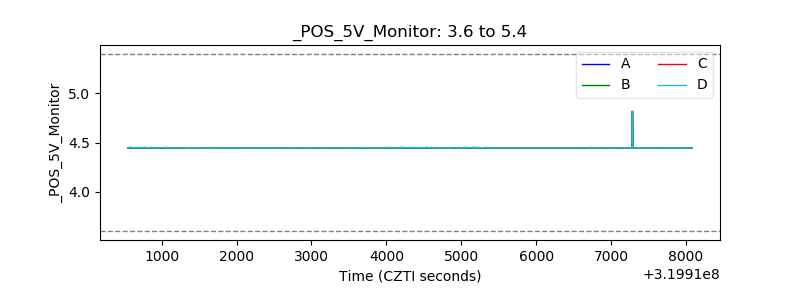 |
| _ROLL_ROT | 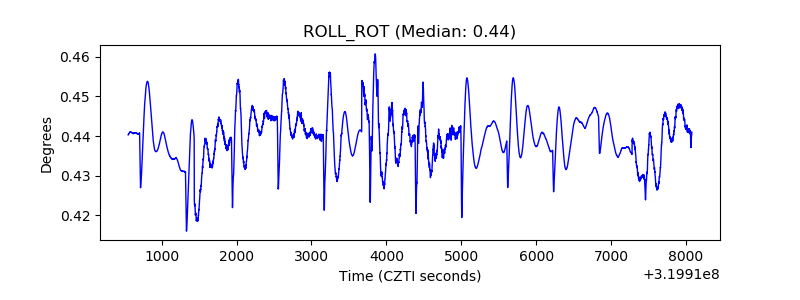 |
| _Roll_DEC | 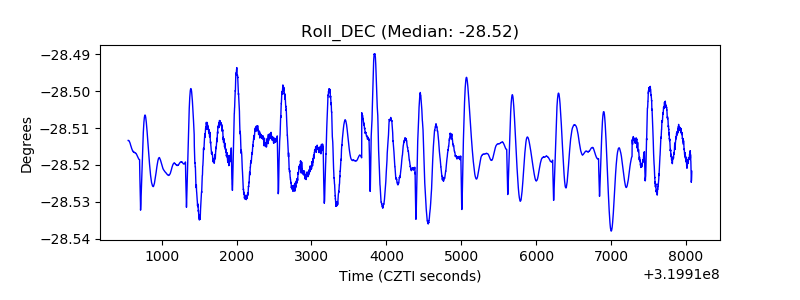 |
| _Roll_RA |  |
| Veto Counter | 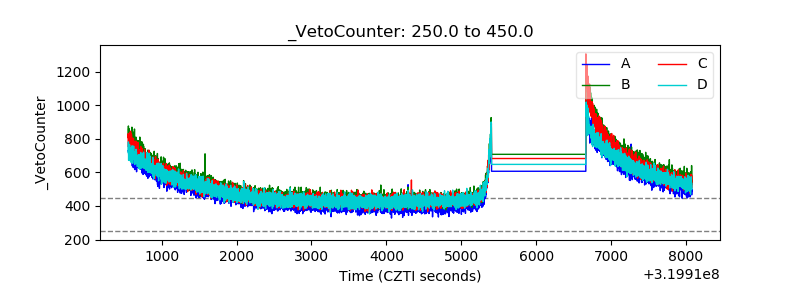 |