| Param | Original file | Final file |
|---|---|---|
| Filename | modeM0/AS1T03_180T01_9000003524_23781cztM0_level2.evt | modeM0/AS1T03_180T01_9000003524_23781cztM0_level2_quad_clean.evt |
| Size (bytes) | 510,232,320 | 73,071,360 |
| Size | 486.6 MB | 69.7 MB |
| Events in quadrant A | 3,440,979 | 461,629 |
| Events in quadrant B | 4,199,299 | 446,754 |
| Events in quadrant C | 3,449,047 | 441,770 |
| Events in quadrant D | 3,948,271 | 435,195 |
| Mode M0 | |||
|---|---|---|---|
| Quadrant | BADHDUFLAG | Total packets | Discarded packets |
| A | 0 | 14224 | 2 |
| B | 0 | 16606 | 2 |
| C | 0 | 14100 | 2 |
| D | 0 | 15777 | 2 |
| Mode SS | |||
|---|---|---|---|
| Quadrant | BADHDUFLAG | Total packets | Discarded packets |
| A | 0 | 124 | 0 |
| B | 0 | 124 | 0 |
| C | 0 | 124 | 0 |
| D | 0 | 124 | 0 |
| Mode M9 | |||
|---|---|---|---|
| Quadrant | BADHDUFLAG | Total packets | Discarded packets |
| A | 0 | 21 | 0 |
| B | 0 | 22 | 0 |
| C | 0 | 22 | 0 |
| D | 0 | 22 | 0 |
| Quadrant | Total seconds | Saturated seconds | Saturation percentage |
|---|---|---|---|
| A | 6120 | 97 | 1.584967% |
| B | 6119 | 327 | 5.344010% |
| C | 6119 | 124 | 2.026475% |
| D | 6119 | 214 | 3.497303% |
Noise dominated data is calculated using 1-second bins in cleaned event files. If a bin has >2000 counts, and if more than 50% of those come from <1% of pixels, then it is considered to be noise-dominated and hence unusable.
| Quadrant | # 1 sec bins | Bins with >0 counts | Bins with >2000 counts | High rate bins dominated by noise | Noise dominated (total time) | Noise dominated (detector-on time) | Marked lightcurve |
|---|---|---|---|---|---|---|---|
| A | 7450 | 6120 | 0 | 0 | 0.00% | 0.00% | 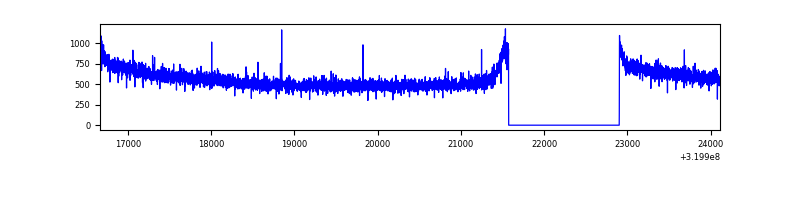 |
| B | 7449 | 6119 | 202 | 202 | 2.71% | 3.30% | 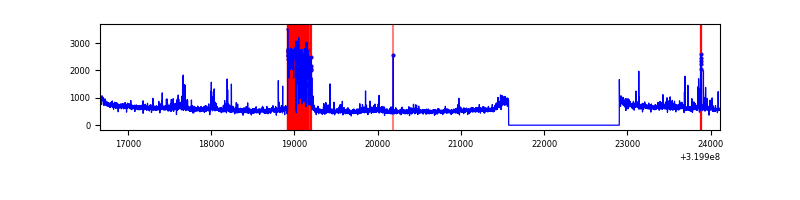 |
| C | 7449 | 6119 | 0 | 0 | 0.00% | 0.00% | 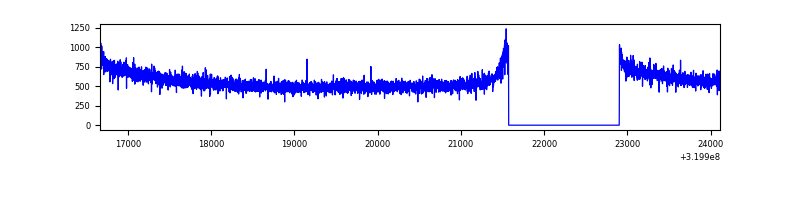 |
| D | 7449 | 6119 | 107 | 107 | 1.44% | 1.75% | 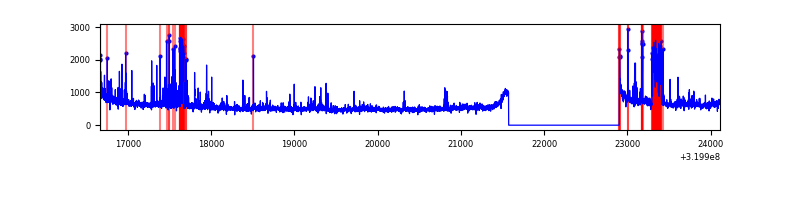 |
Top three noisy pixels from each quadrant. If the there are fewer than three noisy pixels in the level2.evt file, extra rows are filled as -1
| Pixel properties | Quadrant properties | ||||||
|---|---|---|---|---|---|---|---|
| Quadrant | DetID | PixID | Counts | Sigma | Mean | Median | Sigma |
| A | 13 | 254 | 11267 | 59.14 | 893 | 879 | 175.6 |
| A | 0 | 226 | 8066 | 40.91 | 893 | 879 | 175.6 |
| A | 3 | 137 | 7031 | 35.02 | 893 | 879 | 175.6 |
| B | 3 | 64 | 692847 | 4283.46 | 872 | 855 | 161.5 |
| B | 0 | 189 | 40777 | 247.12 | 872 | 855 | 161.5 |
| B | 0 | 245 | 29463 | 177.08 | 872 | 855 | 161.5 |
| C | 14 | 238 | 137413 | 707.86 | 840 | 849 | 192.9 |
| C | 4 | 175 | 26992 | 135.51 | 840 | 849 | 192.9 |
| C | 13 | 61 | 5851 | 25.93 | 840 | 849 | 192.9 |
| D | 5 | 222 | 239809 | 1173.82 | 848 | 827 | 203.6 |
| D | 12 | 233 | 161643 | 789.89 | 848 | 827 | 203.6 |
| D | 1 | 52 | 140407 | 685.58 | 848 | 827 | 203.6 |
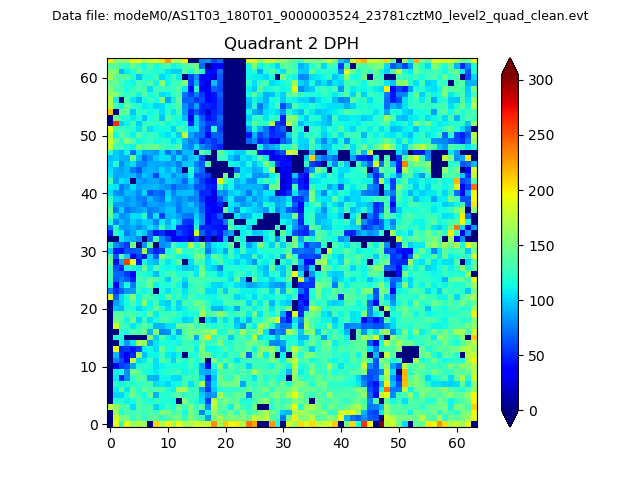
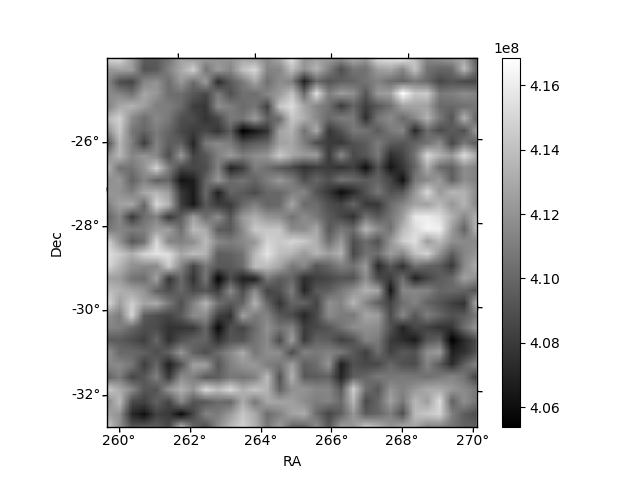
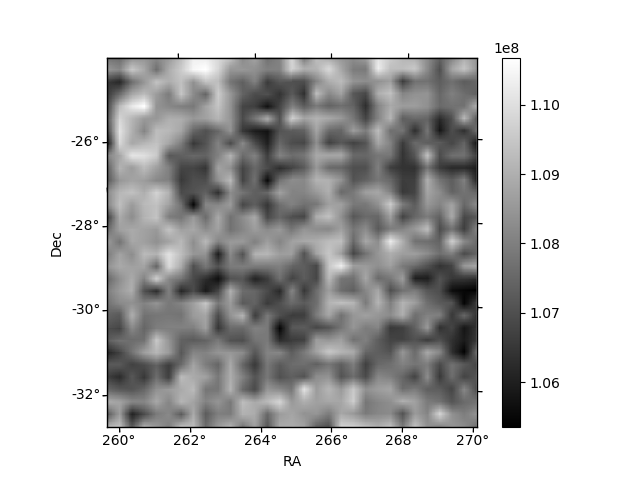
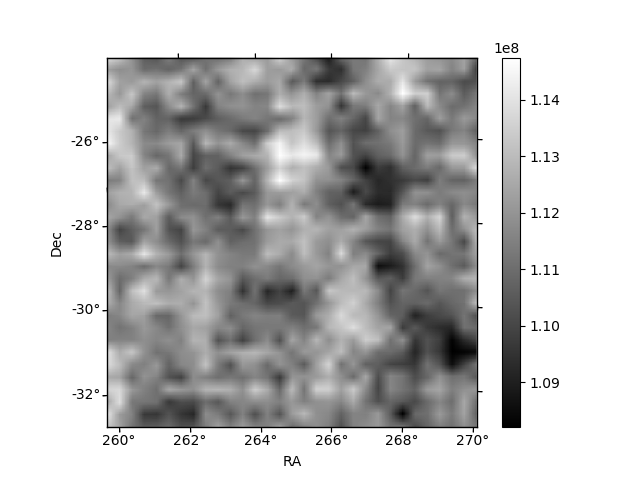
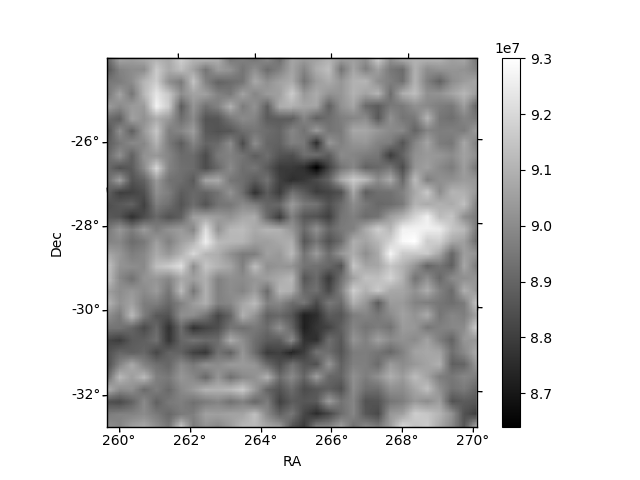
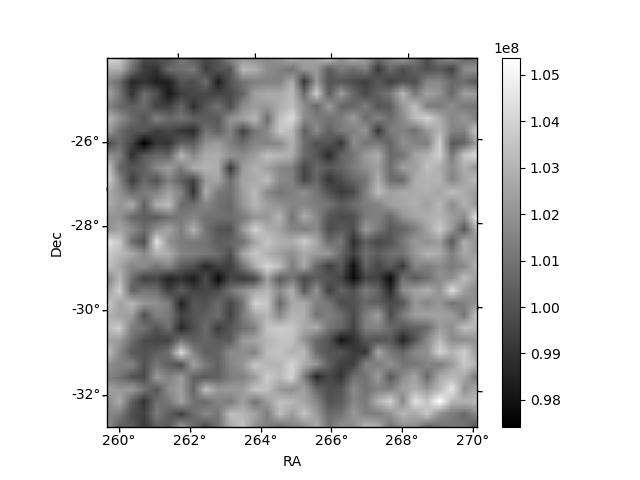
Histogram calculated using DETX and DETY for each event in the final _common_clean file
| Quadrant A | 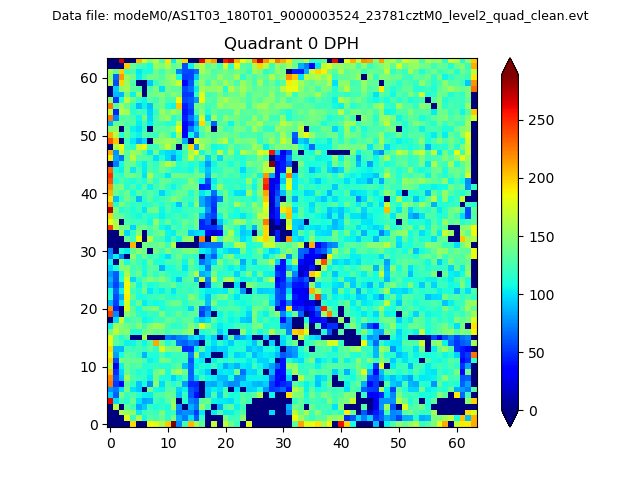 |
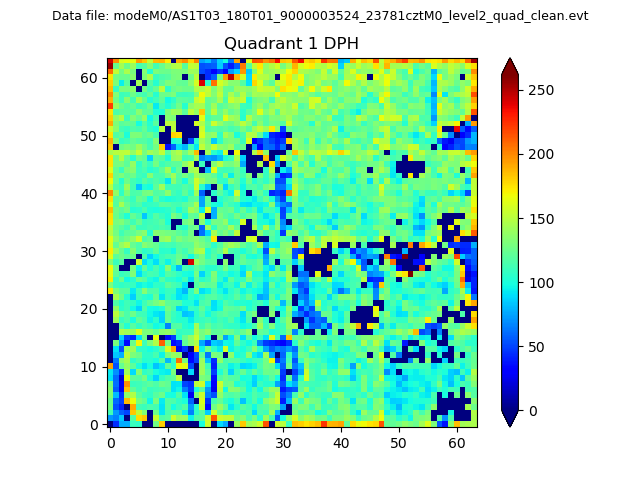 |
Quadrant B |
|---|---|---|---|
| Quadrant D | 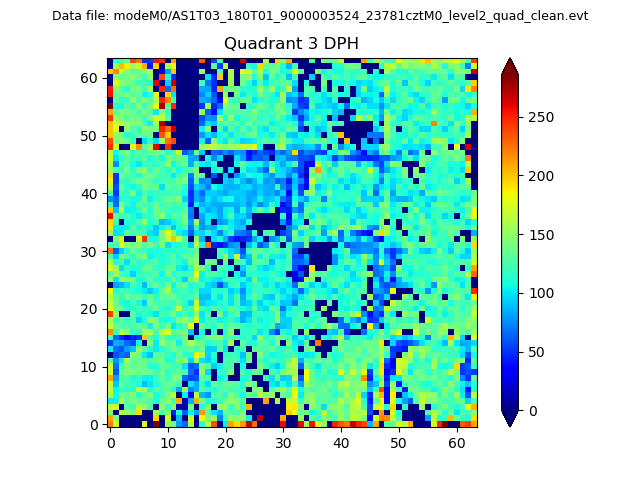 |
 |
Quadrant C |
| Plot type | Count rate plots | Images |
|---|---|---|
| Comparison with Poisson distribution Blue bars denote a histogram of data divided into 1 sec bins. Red curve is a Poisson curve with rate = median count rate of data. |
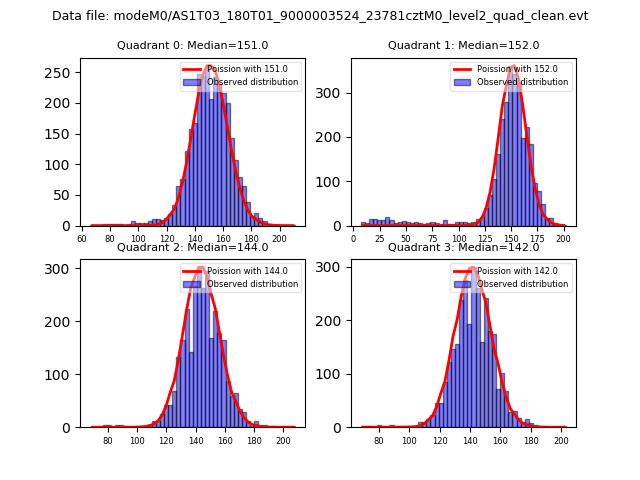 |
 |
| Quadrant-wise count rates Data is divided into 100 sec bins |
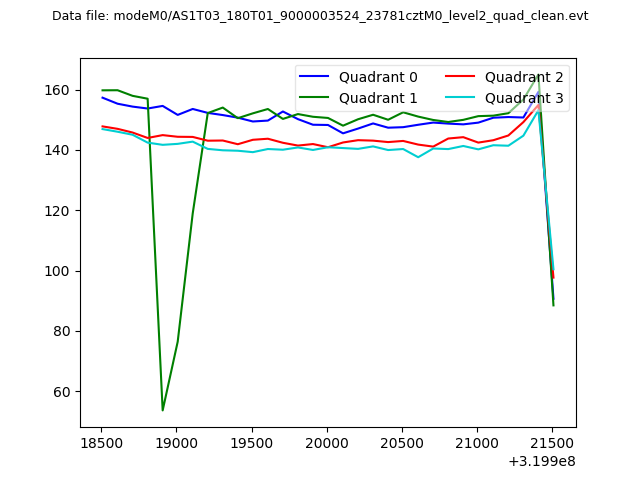 |
|
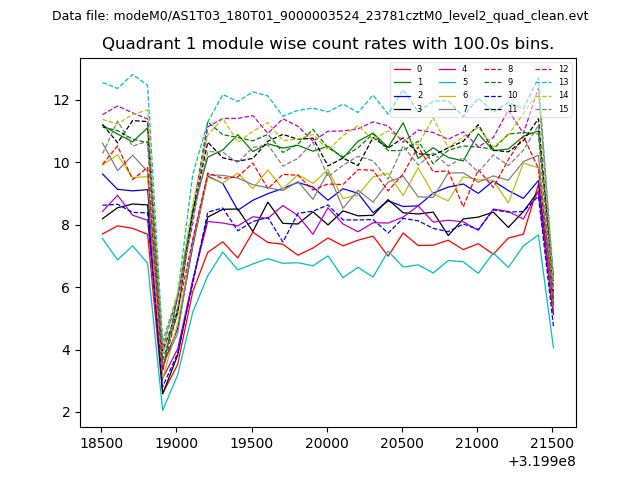
| Module-wise count rates for Quadrant A Data is divided into 100 sec bins |
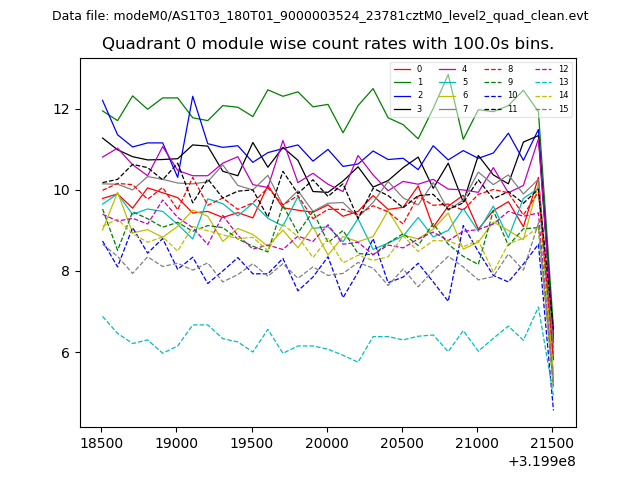 |
 |
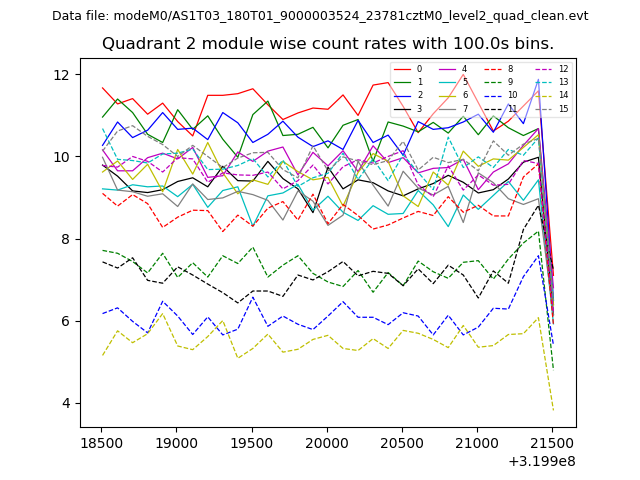
| Module-wise count rates for Quadrant B Data is divided into 100 sec bins |
 |
 |
| Module-wise count rates for Quadrant C Data is divided into 100 sec bins |
 |
 |
| Module-wise count rates for Quadrant D Data is divided into 100 sec bins |
 |
 |
| Parameter | Plot |
|---|---|
| CZT HV Monitor | 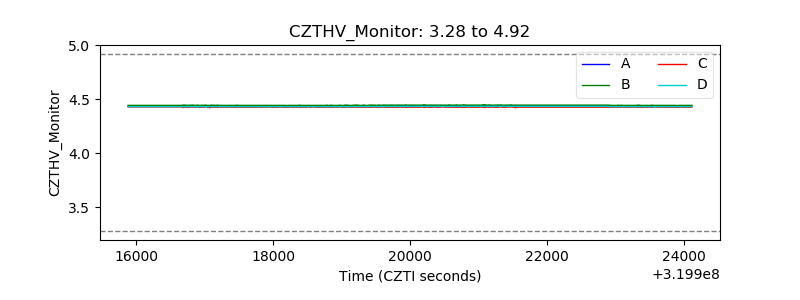 |
| D_VDD | 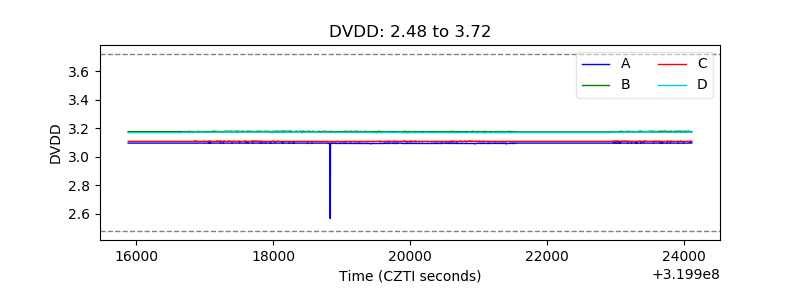 |
| Temperature 1 | 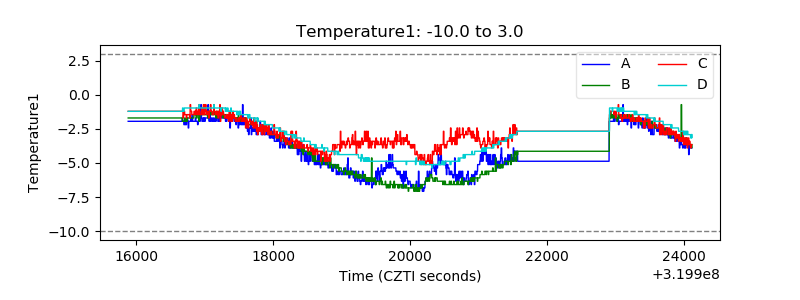 |
| Veto HV Monitor | 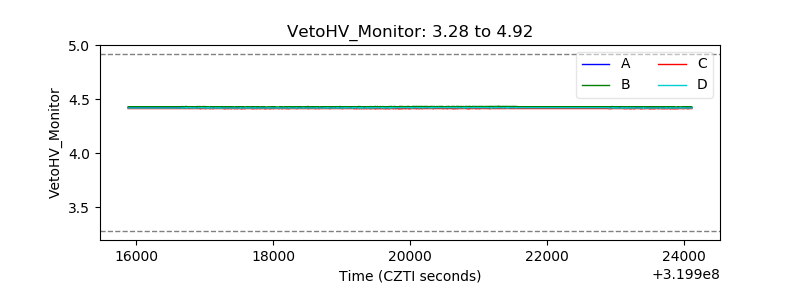 |
| Veto LLD | 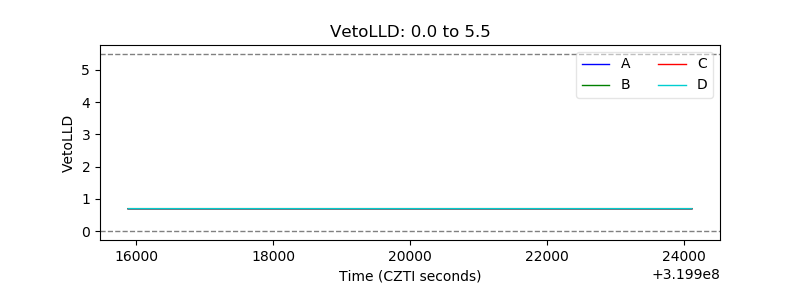 |
| Alpha Counter | 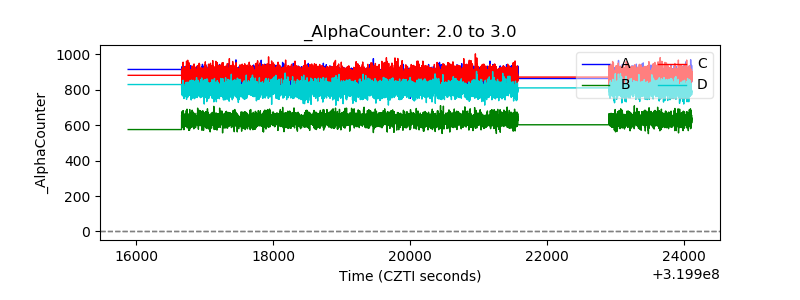 |
| _CPM_Rate | 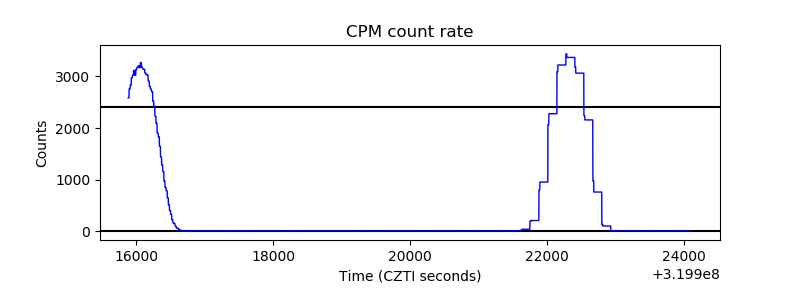 |
| CZT Counter | 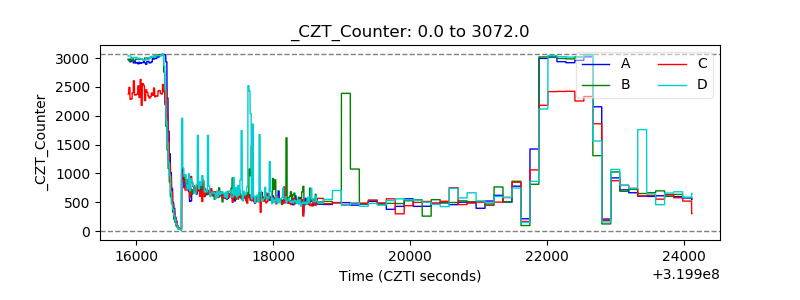 |
| +2.5 Volts monitor |  |
| +5 Volts monitor |  |
| _ROLL_ROT |  |
| _Roll_DEC | 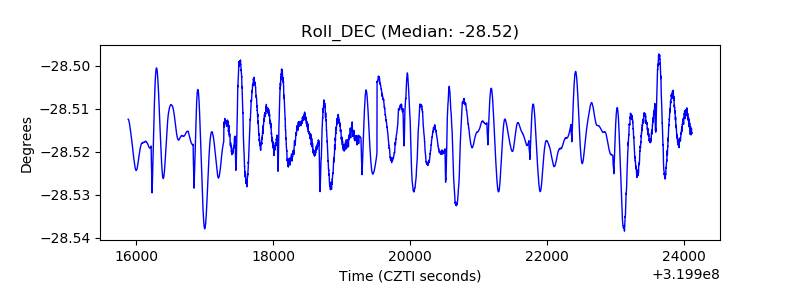 |
| _Roll_RA |  |
| Veto Counter | 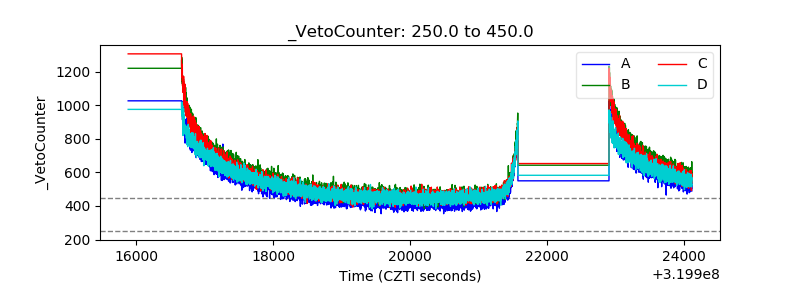 |