| Param | Original file | Final file |
|---|---|---|
| Filename | modeM0/AS1T03_180T01_9000003524_23782cztM0_level2.evt | modeM0/AS1T03_180T01_9000003524_23782cztM0_level2_quad_clean.evt |
| Size (bytes) | 494,591,040 | 87,678,720 |
| Size | 471.7 MB | 83.6 MB |
| Events in quadrant A | 3,406,077 | 567,223 |
| Events in quadrant B | 3,685,176 | 580,255 |
| Events in quadrant C | 3,423,376 | 543,158 |
| Events in quadrant D | 4,045,289 | 533,581 |
| Mode M0 | |||
|---|---|---|---|
| Quadrant | BADHDUFLAG | Total packets | Discarded packets |
| A | 0 | 14029 | 2 |
| B | 0 | 14891 | 2 |
| C | 0 | 13922 | 2 |
| D | 0 | 15973 | 2 |
| Mode SS | |||
|---|---|---|---|
| Quadrant | BADHDUFLAG | Total packets | Discarded packets |
| A | 0 | 124 | 0 |
| B | 0 | 124 | 0 |
| C | 0 | 124 | 0 |
| D | 0 | 124 | 0 |
| Mode M9 | |||
|---|---|---|---|
| Quadrant | BADHDUFLAG | Total packets | Discarded packets |
| A | 0 | 21 | 0 |
| B | 0 | 22 | 0 |
| C | 0 | 22 | 0 |
| D | 0 | 22 | 0 |
| Quadrant | Total seconds | Saturated seconds | Saturation percentage |
|---|---|---|---|
| A | 6173 | 85 | 1.376964% |
| B | 6173 | 142 | 2.300340% |
| C | 6173 | 106 | 1.717155% |
| D | 6173 | 257 | 4.163292% |
Noise dominated data is calculated using 1-second bins in cleaned event files. If a bin has >2000 counts, and if more than 50% of those come from <1% of pixels, then it is considered to be noise-dominated and hence unusable.
| Quadrant | # 1 sec bins | Bins with >0 counts | Bins with >2000 counts | High rate bins dominated by noise | Noise dominated (total time) | Noise dominated (detector-on time) | Marked lightcurve |
|---|---|---|---|---|---|---|---|
| A | 7548 | 6173 | 0 | 0 | 0.00% | 0.00% | 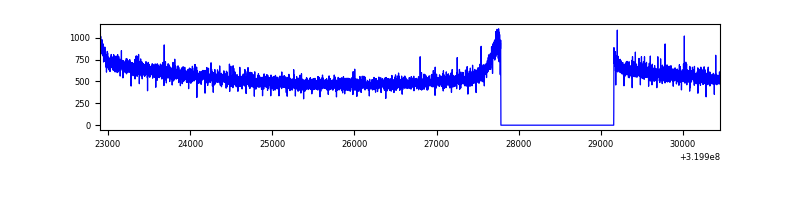 |
| B | 7548 | 6173 | 29 | 29 | 0.38% | 0.47% | 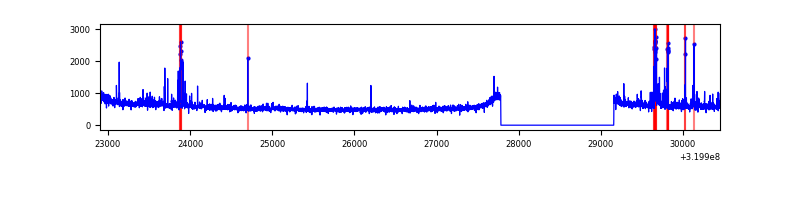 |
| C | 7548 | 6173 | 0 | 0 | 0.00% | 0.00% | 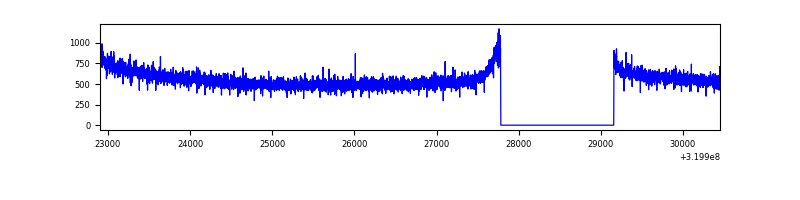 |
| D | 7548 | 6174 | 170 | 170 | 2.25% | 2.75% | 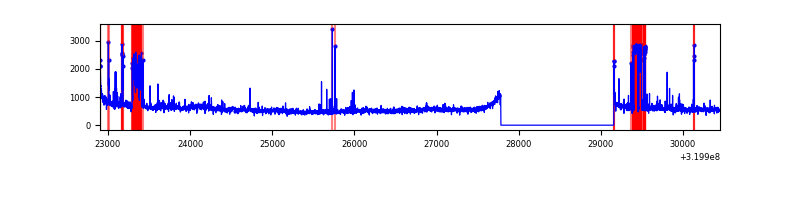 |
Top three noisy pixels from each quadrant. If the there are fewer than three noisy pixels in the level2.evt file, extra rows are filled as -1
| Pixel properties | Quadrant properties | ||||||
|---|---|---|---|---|---|---|---|
| Quadrant | DetID | PixID | Counts | Sigma | Mean | Median | Sigma |
| A | 13 | 254 | 11308 | 59.98 | 884 | 869 | 174.0 |
| A | 0 | 226 | 7979 | 40.85 | 884 | 869 | 174.0 |
| A | 3 | 137 | 7021 | 35.35 | 884 | 869 | 174.0 |
| B | 3 | 64 | 170695 | 1047.16 | 880 | 865 | 162.2 |
| B | 0 | 189 | 36911 | 222.26 | 880 | 865 | 162.2 |
| B | 12 | 111 | 17989 | 105.59 | 880 | 865 | 162.2 |
| C | 14 | 238 | 136345 | 706.61 | 837 | 847 | 191.8 |
| C | 4 | 175 | 12589 | 61.23 | 837 | 847 | 191.8 |
| C | 7 | 247 | 9418 | 44.7 | 837 | 847 | 191.8 |
| D | 1 | 52 | 429334 | 2169.82 | 829 | 808 | 197.5 |
| D | 5 | 222 | 237868 | 1200.34 | 829 | 808 | 197.5 |
| D | 8 | 195 | 81290 | 407.52 | 829 | 808 | 197.5 |
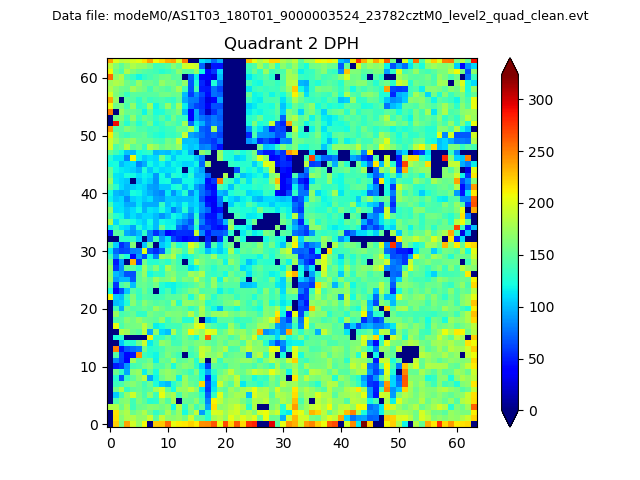
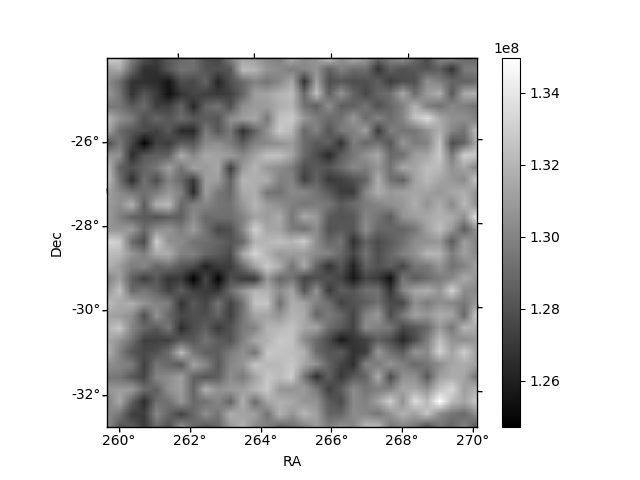
Histogram calculated using DETX and DETY for each event in the final _common_clean file
| Quadrant A | 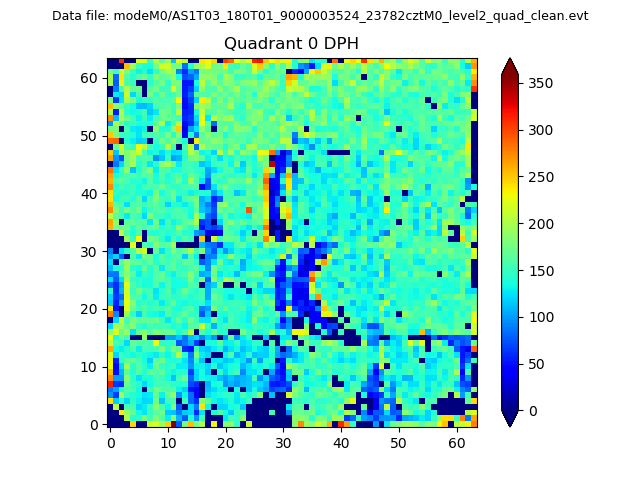 |
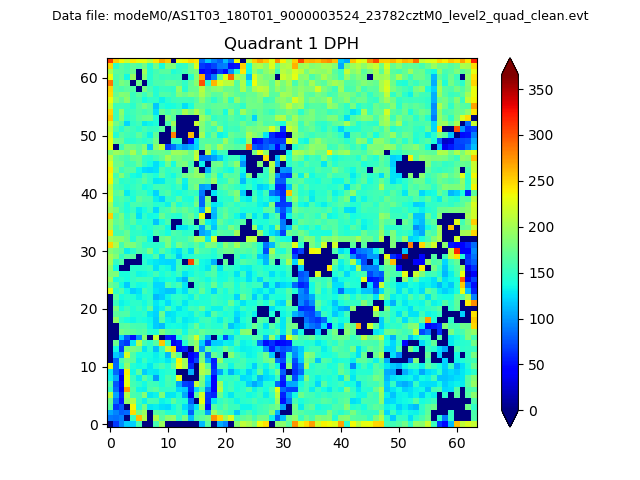 |
Quadrant B |
|---|---|---|---|
| Quadrant D | 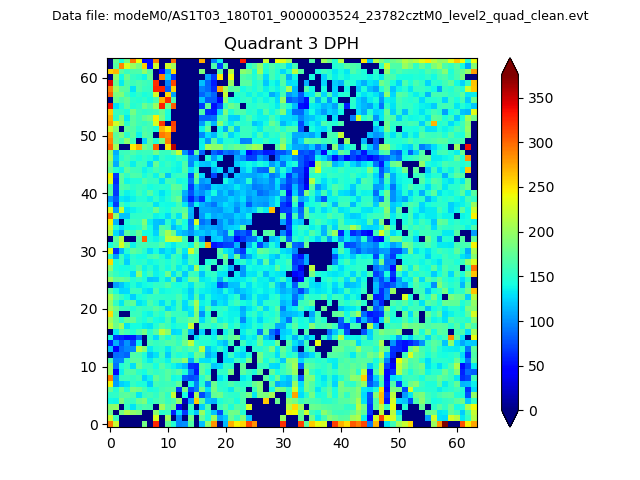 |
 |
Quadrant C |
| Plot type | Count rate plots | Images |
|---|---|---|
| Comparison with Poisson distribution Blue bars denote a histogram of data divided into 1 sec bins. Red curve is a Poisson curve with rate = median count rate of data. |
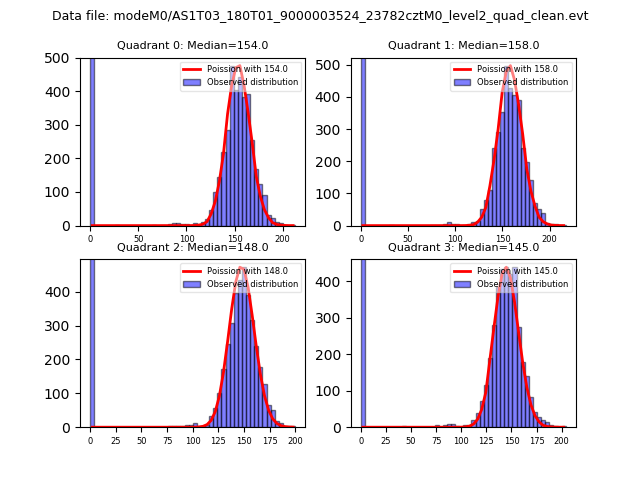 |
 |
| Quadrant-wise count rates Data is divided into 100 sec bins |
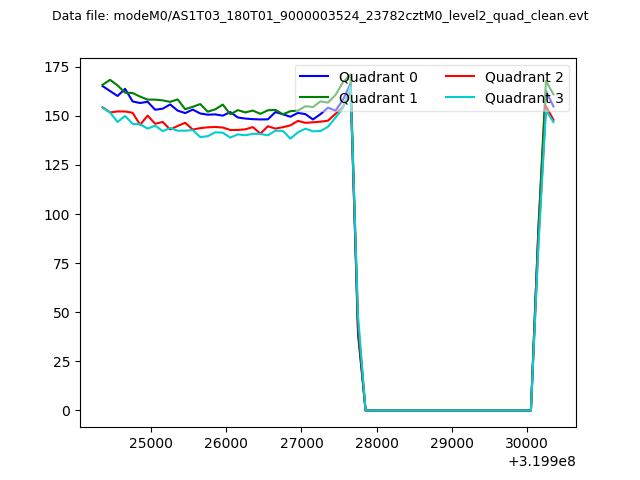 |
|
| Module-wise count rates for Quadrant A Data is divided into 100 sec bins |
 |
 |
| Module-wise count rates for Quadrant B Data is divided into 100 sec bins |
 |
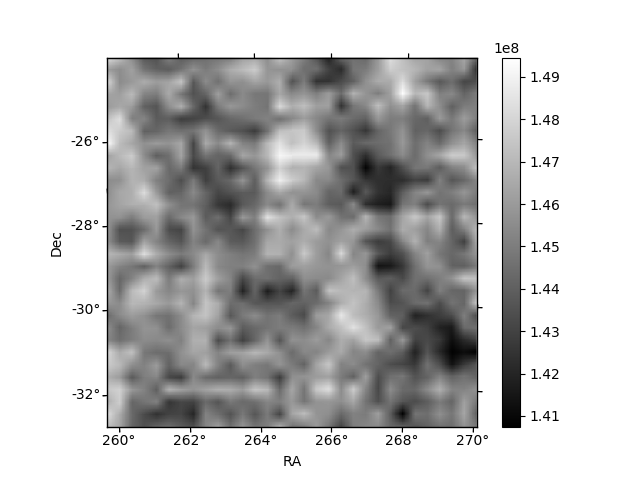 |
| Module-wise count rates for Quadrant C Data is divided into 100 sec bins |
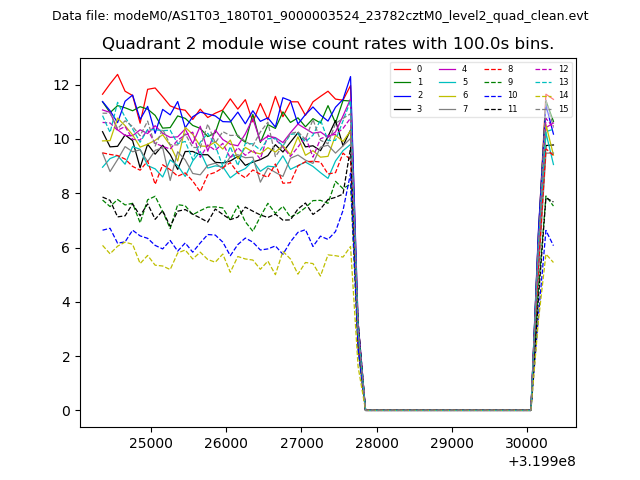 |
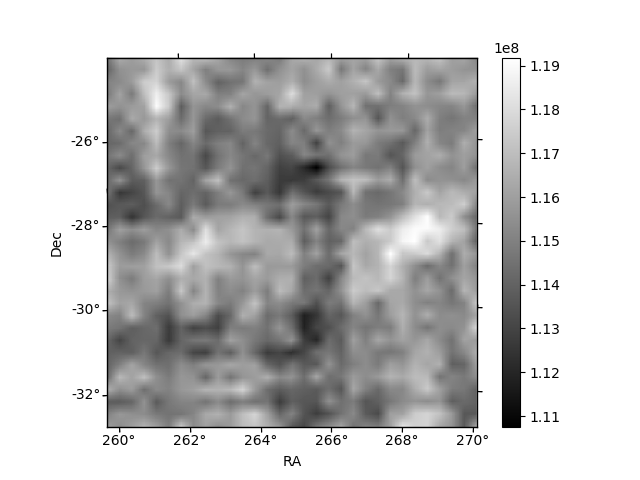 |
| Module-wise count rates for Quadrant D Data is divided into 100 sec bins |
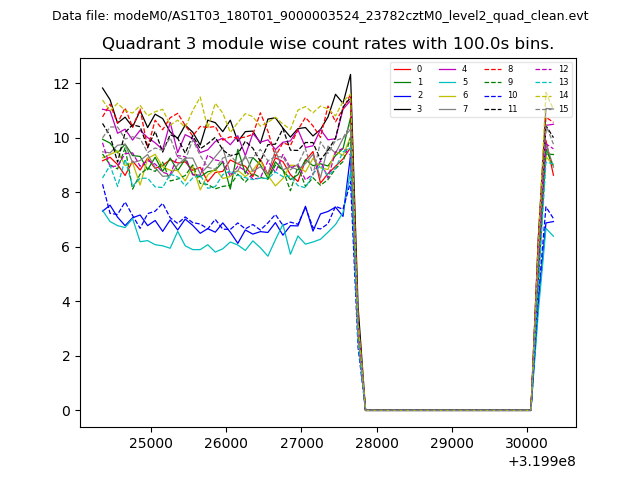 |
 |
| Parameter | Plot |
|---|---|
| CZT HV Monitor |  |
| D_VDD | 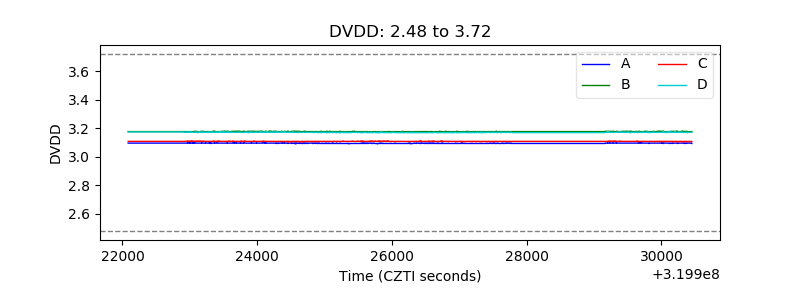 |
| Temperature 1 | 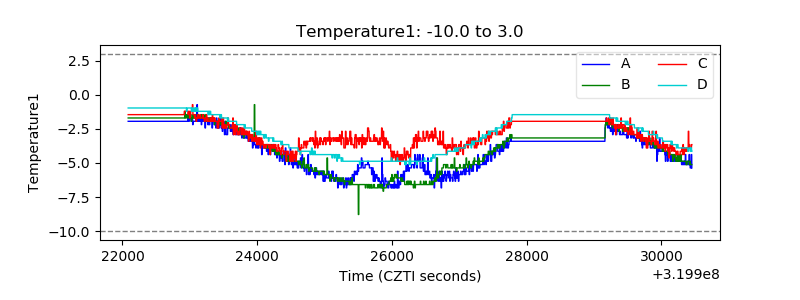 |
| Veto HV Monitor | 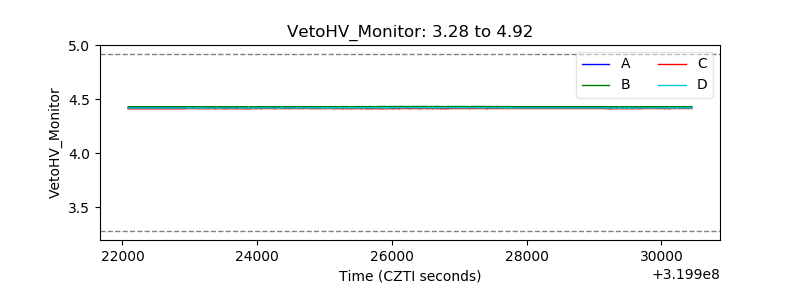 |
| Veto LLD | 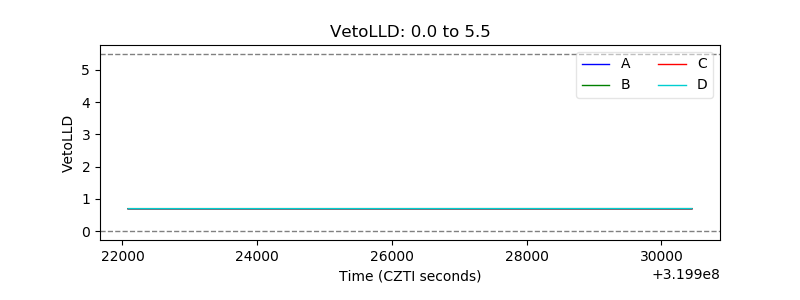 |
| Alpha Counter | 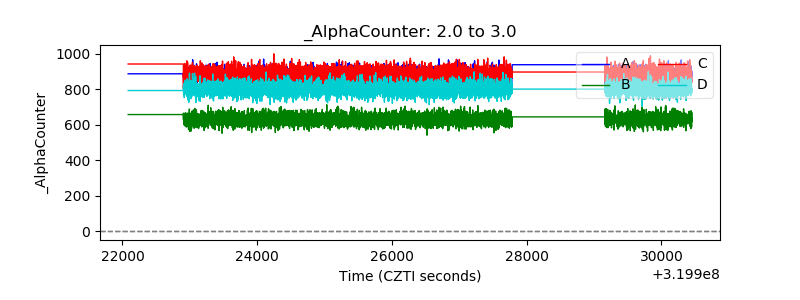 |
| _CPM_Rate | 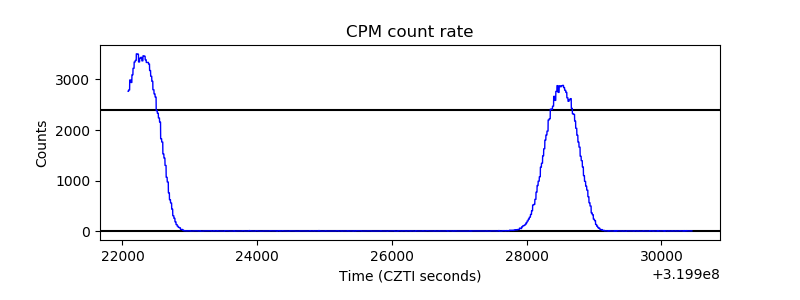 |
| CZT Counter | 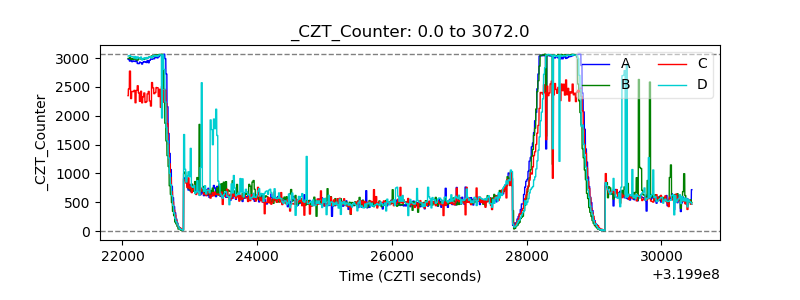 |
| +2.5 Volts monitor |  |
| +5 Volts monitor |  |
| _ROLL_ROT | 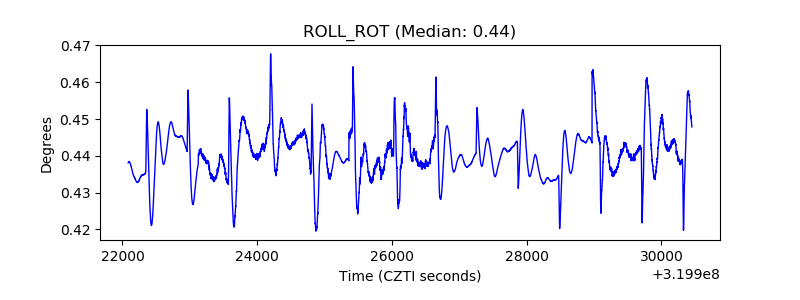 |
| _Roll_DEC | 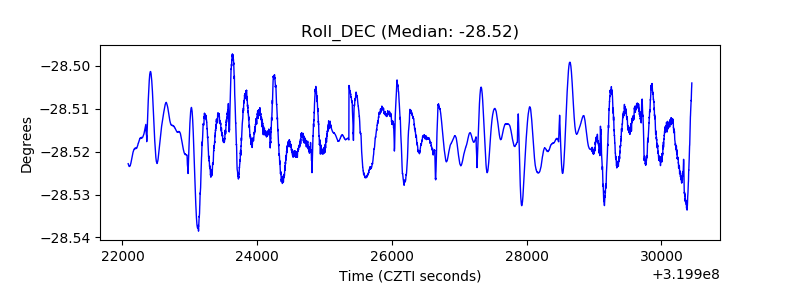 |
| _Roll_RA | 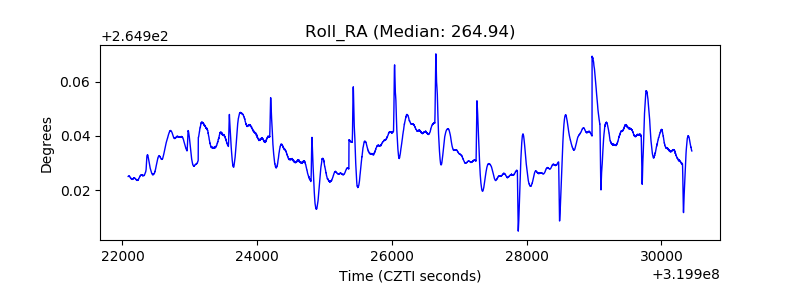 |
| Veto Counter | 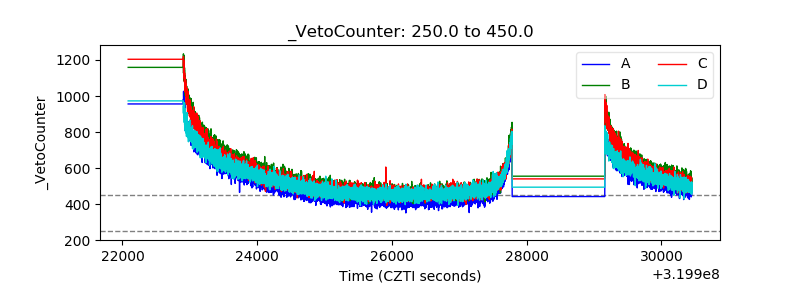 |