| Param | Original file | Final file |
|---|---|---|
| Filename | modeM0/AS1A07_113T01_9000003526cztM0_level2.fits | modeM0/AS1A07_113T01_9000003526cztM0_level2_quad_clean.evt |
| Size (bytes) | 2,300,981,760 | 2,052,290,880 |
| Size | 2.1 GB | 1.9 GB |
| Events in quadrant A | 14,535,386 | 12,464,031 |
| Events in quadrant B | 13,816,776 | 12,428,743 |
| Events in quadrant C | 14,331,304 | 12,186,683 |
| Events in quadrant D | 10,934,812 | 9,035,662 |
| Mode M9 | |||
|---|---|---|---|
| Quadrant | BADHDUFLAG | Total packets | Discarded packets |
| A | 0 | 340 | 0 |
| B | 0 | 340 | 0 |
| C | 0 | 340 | 0 |
| D | 0 | 340 | 0 |
| Mode SS | |||
|---|---|---|---|
| Quadrant | BADHDUFLAG | Total packets | Discarded packets |
| A | 0 | 4834 | 0 |
| B | 0 | 4834 | 0 |
| C | 0 | 4838 | 0 |
| D | 0 | 4834 | 0 |
| Mode M0 | |||
|---|---|---|---|
| Quadrant | BADHDUFLAG | Total packets | Discarded packets |
| A | 0 | 489583 | 0 |
| B | 0 | 542977 | 0 |
| C | 0 | 498590 | 0 |
| D | 0 | 1102708 | 0 |
| Quadrant | Total seconds | Saturated seconds | Saturation percentage |
|---|---|---|---|
| A | 233957 | 2453 | 1.048483% |
| B | 233991 | 8000 | 3.418935% |
| C | 233968 | 4290 | 1.833584% |
| D | 233699 | 62545 | 26.763058% |
Noise dominated data is calculated using 1-second bins in cleaned event files. If a bin has >2000 counts, and if more than 50% of those come from <1% of pixels, then it is considered to be noise-dominated and hence unusable.
| Quadrant | # 1 sec bins | Bins with >0 counts | Bins with >2000 counts | High rate bins dominated by noise | Noise dominated (total time) | Noise dominated (detector-on time) | Marked lightcurve |
|---|---|---|---|---|---|---|---|
| A | 314643 | 234071 | 0 | 0 | 0.00% | 0.00% | 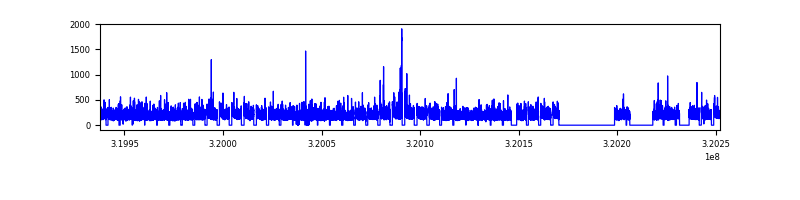 |
| B | 314643 | 234018 | 0 | 0 | 0.00% | 0.00% |  |
| C | 314643 | 234068 | 0 | 0 | 0.00% | 0.00% |  |
| D | 314643 | 233573 | 0 | 0 | 0.00% | 0.00% |  |
Top three noisy pixels from each quadrant. If the there are fewer than three noisy pixels in the level2.evt file, extra rows are filled as -1
| Pixel properties | Quadrant properties | ||||||
|---|---|---|---|---|---|---|---|
| Quadrant | DetID | PixID | Counts | Sigma | Mean | Median | Sigma |
| A | 0 | 29 | 13922 | 11.22 | 3783 | 3553 | 923.9 |
| A | 7 | 110 | 11701 | 8.82 | 3783 | 3553 | 923.9 |
| A | 9 | 19 | 10967 | 8.02 | 3783 | 3553 | 923.9 |
| B | 2 | 9 | 11129 | 10.79 | 3655 | 3490 | 708.2 |
| B | 2 | 8 | 9199 | 8.06 | 3655 | 3490 | 708.2 |
| B | 5 | 232 | 8989 | 7.76 | 3655 | 3490 | 708.2 |
| C | 3 | 126 | 9684 | 6.4 | 3793 | 3559 | 956.4 |
| C | 12 | 241 | 9668 | 6.39 | 3793 | 3559 | 956.4 |
| C | 9 | 209 | 9500 | 6.21 | 3793 | 3559 | 956.4 |
| D | 3 | 14 | 7777 | 6.02 | 3122 | 2853 | 817.9 |
| D | 6 | 231 | 7726 | 5.96 | 3122 | 2853 | 817.9 |
| D | 15 | 46 | 7667 | 5.89 | 3122 | 2853 | 817.9 |
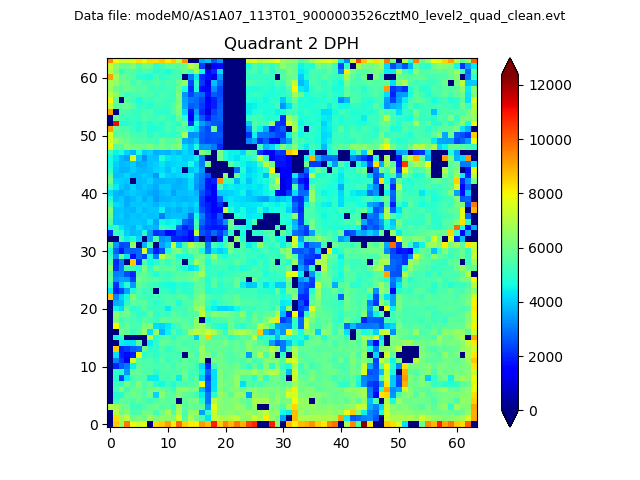
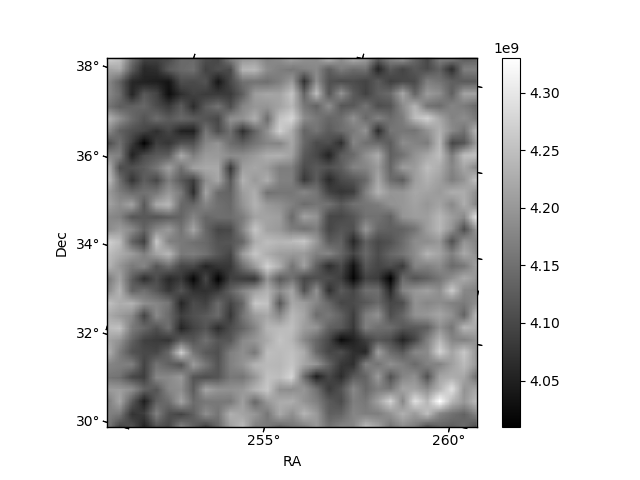
Histogram calculated using DETX and DETY for each event in the final _common_clean file
| Quadrant A | 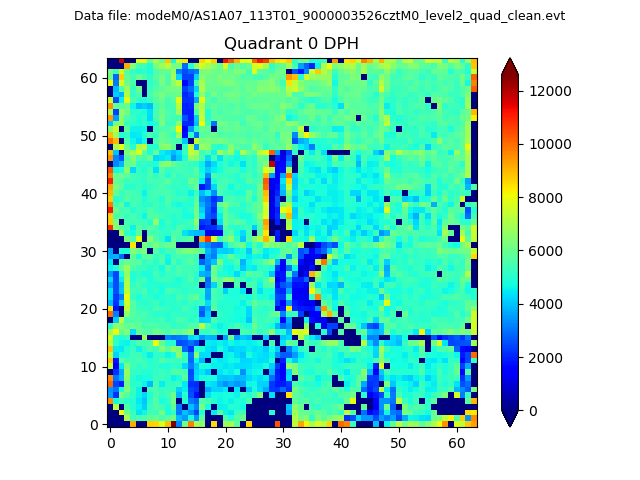 |
 |
Quadrant B |
|---|---|---|---|
| Quadrant D | 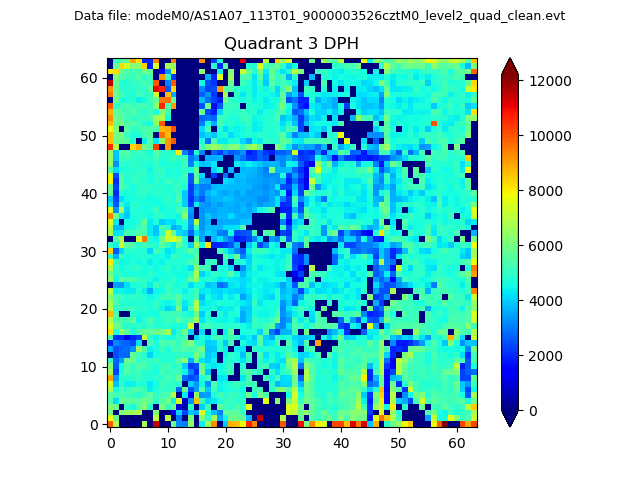 |
 |
Quadrant C |
| Plot type | Count rate plots | Images |
|---|---|---|
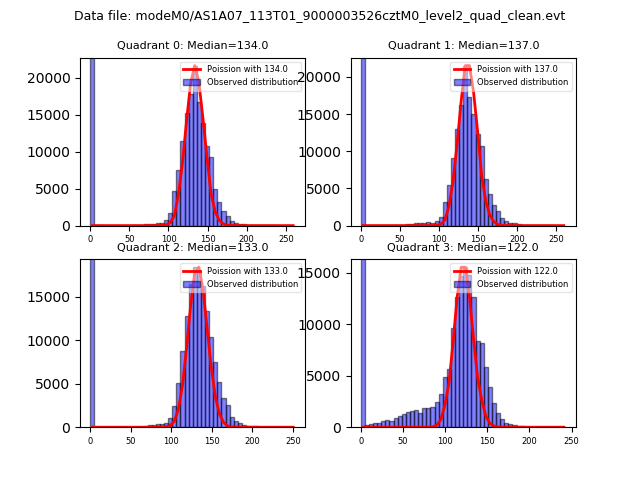
| Comparison with Poisson distribution Blue bars denote a histogram of data divided into 1 sec bins. Red curve is a Poisson curve with rate = median count rate of data. |
 |
 |
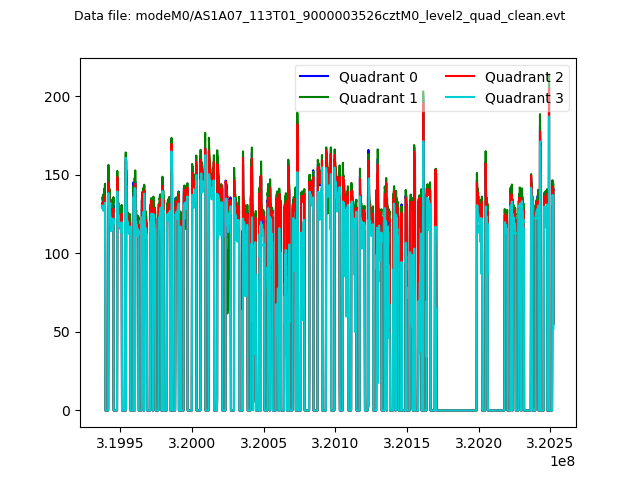
| Quadrant-wise count rates Data is divided into 100 sec bins |
 |
|
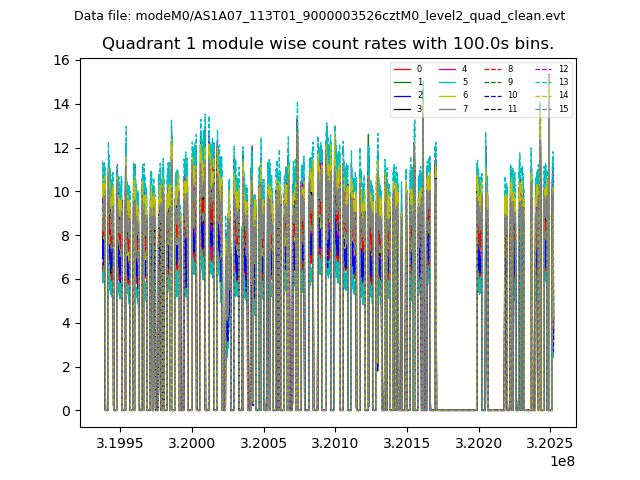
| Module-wise count rates for Quadrant A Data is divided into 100 sec bins |
 |
 |
| Module-wise count rates for Quadrant B Data is divided into 100 sec bins |
 |
 |
| Module-wise count rates for Quadrant C Data is divided into 100 sec bins |
 |
 |
| Module-wise count rates for Quadrant D Data is divided into 100 sec bins |
 |
 |
| Parameter | Plot |
|---|---|
| CZT HV Monitor |  |
| D_VDD | 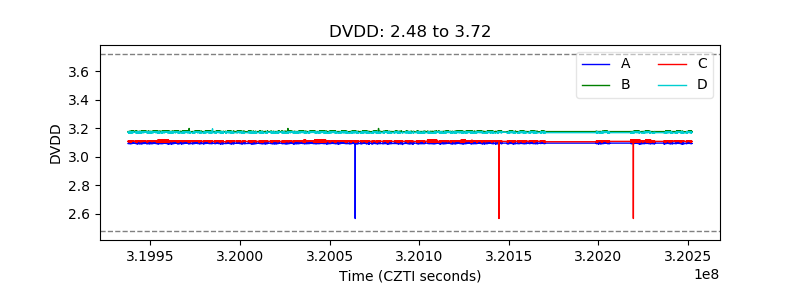 |
| Temperature 1 |  |
| Veto HV Monitor |  |
| Veto LLD |  |
| Alpha Counter |  |
| _CPM_Rate |  |
| CZT Counter |  |
| +2.5 Volts monitor | 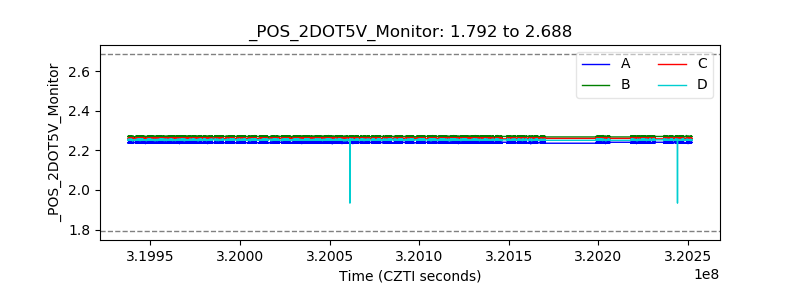 |
| +5 Volts monitor | 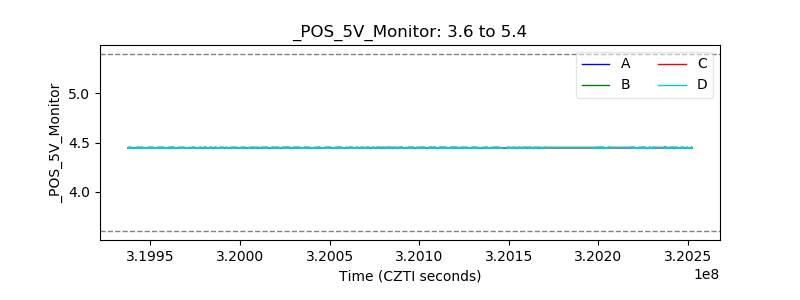 |
| _ROLL_ROT |  |
| _Roll_DEC | 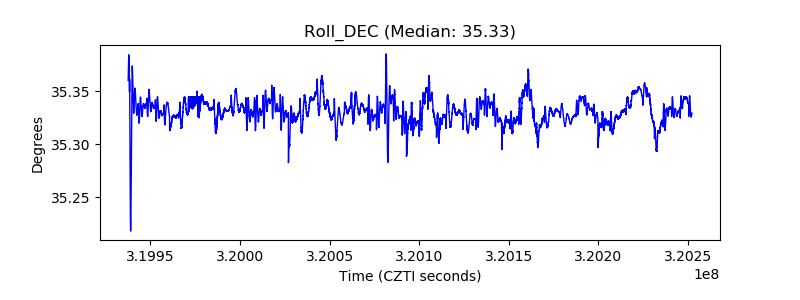 |
| _Roll_RA |  |
| Veto Counter | 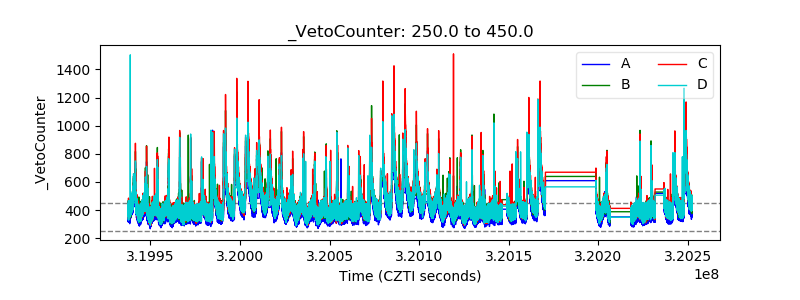 |