| Param | Original file | Final file |
|---|---|---|
| Filename | modeM0/AS1A07_113T01_9000003526_23784cztM0_level2.evt | modeM0/AS1A07_113T01_9000003526_23784cztM0_level2_quad_clean.evt |
| Size (bytes) | 312,264,000 | 68,716,800 |
| Size | 297.8 MB | 65.5 MB |
| Events in quadrant A | 2,166,903 | 445,555 |
| Events in quadrant B | 2,330,618 | 457,571 |
| Events in quadrant C | 2,213,875 | 439,052 |
| Events in quadrant D | 2,442,635 | 426,234 |
| Mode M9 | |||
|---|---|---|---|
| Quadrant | BADHDUFLAG | Total packets | Discarded packets |
| A | 0 | 10 | 0 |
| B | 0 | 10 | 0 |
| C | 0 | 10 | 0 |
| D | 0 | 10 | 0 |
| Mode SS | |||
|---|---|---|---|
| Quadrant | BADHDUFLAG | Total packets | Discarded packets |
| A | 0 | 92 | 0 |
| B | 0 | 92 | 0 |
| C | 0 | 92 | 0 |
| D | 0 | 92 | 0 |
| Mode M0 | |||
|---|---|---|---|
| Quadrant | BADHDUFLAG | Total packets | Discarded packets |
| A | 0 | 9276 | 1 |
| B | 0 | 9736 | 1 |
| C | 0 | 9331 | 1 |
| D | 0 | 10226 | 1 |
| Quadrant | Total seconds | Saturated seconds | Saturation percentage |
|---|---|---|---|
| A | 4437 | 18 | 0.405680% |
| B | 4437 | 64 | 1.442416% |
| C | 4437 | 55 | 1.239576% |
| D | 4437 | 30 | 0.676133% |
Noise dominated data is calculated using 1-second bins in cleaned event files. If a bin has >2000 counts, and if more than 50% of those come from <1% of pixels, then it is considered to be noise-dominated and hence unusable.
| Quadrant | # 1 sec bins | Bins with >0 counts | Bins with >2000 counts | High rate bins dominated by noise | Noise dominated (total time) | Noise dominated (detector-on time) | Marked lightcurve |
|---|---|---|---|---|---|---|---|
| A | 5452 | 4438 | 0 | 0 | 0.00% | 0.00% | 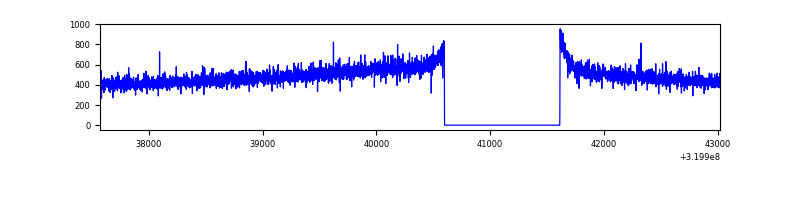 |
| B | 5452 | 4437 | 20 | 20 | 0.37% | 0.45% | 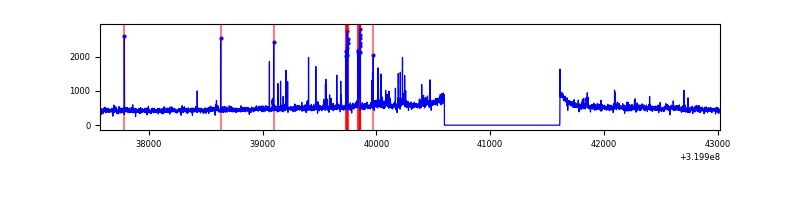 |
| C | 5452 | 4438 | 0 | 0 | 0.00% | 0.00% | 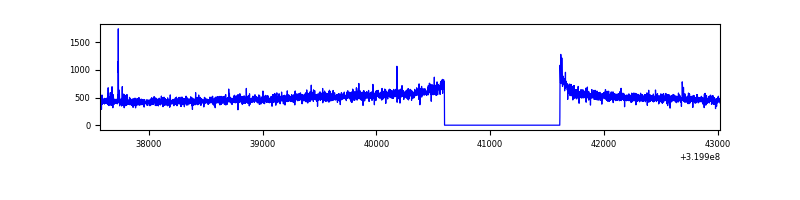 |
| D | 5452 | 4437 | 11 | 11 | 0.20% | 0.25% | 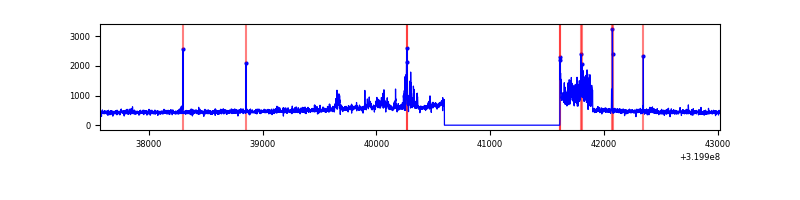 |
Top three noisy pixels from each quadrant. If the there are fewer than three noisy pixels in the level2.evt file, extra rows are filled as -1
| Pixel properties | Quadrant properties | ||||||
|---|---|---|---|---|---|---|---|
| Quadrant | DetID | PixID | Counts | Sigma | Mean | Median | Sigma |
| A | 13 | 254 | 7277 | 59.43 | 561 | 551 | 113.2 |
| A | 3 | 137 | 4885 | 38.3 | 561 | 551 | 113.2 |
| A | 0 | 226 | 4835 | 37.85 | 561 | 551 | 113.2 |
| B | 3 | 64 | 105383 | 972.04 | 558 | 547 | 107.9 |
| B | 0 | 189 | 14971 | 133.74 | 558 | 547 | 107.9 |
| B | 12 | 111 | 12834 | 113.93 | 558 | 547 | 107.9 |
| C | 14 | 238 | 86031 | 675.67 | 538 | 542 | 126.5 |
| C | 7 | 247 | 15031 | 114.52 | 538 | 542 | 126.5 |
| C | 3 | 233 | 11421 | 85.98 | 538 | 542 | 126.5 |
| D | 8 | 195 | 179732 | 1353.35 | 542 | 529 | 132.4 |
| D | 12 | 6 | 86865 | 652.02 | 542 | 529 | 132.4 |
| D | 7 | 238 | 47259 | 352.91 | 542 | 529 | 132.4 |
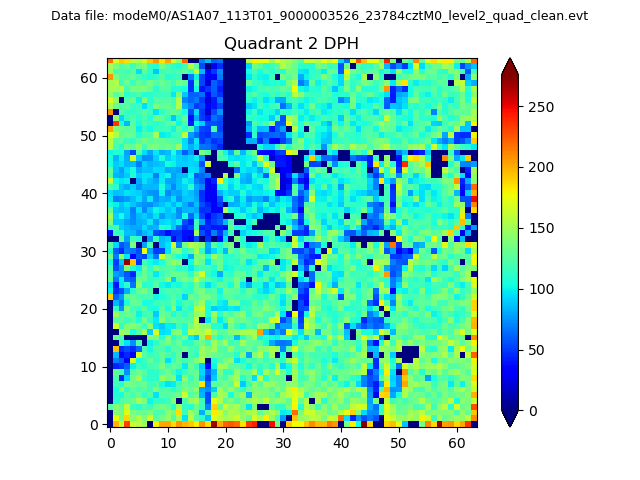
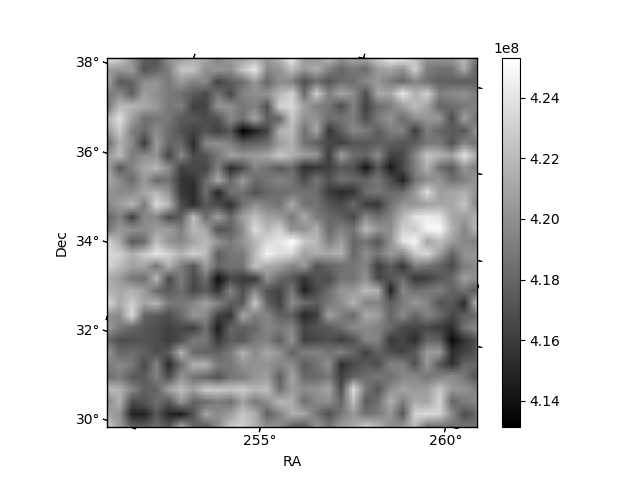
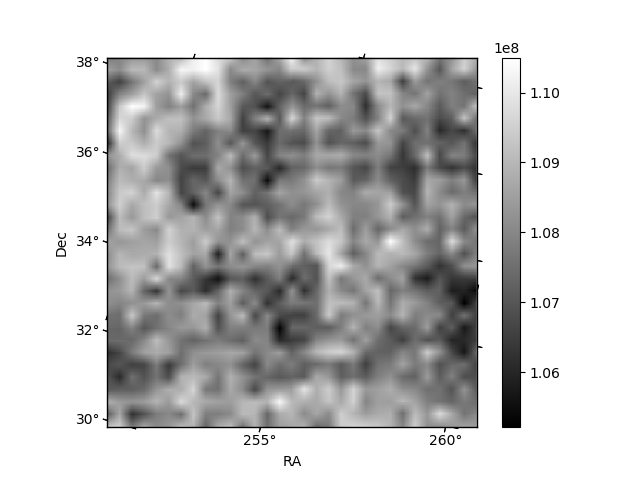
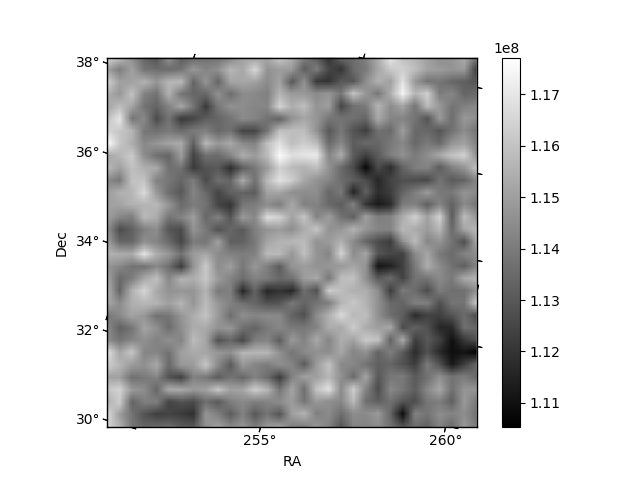
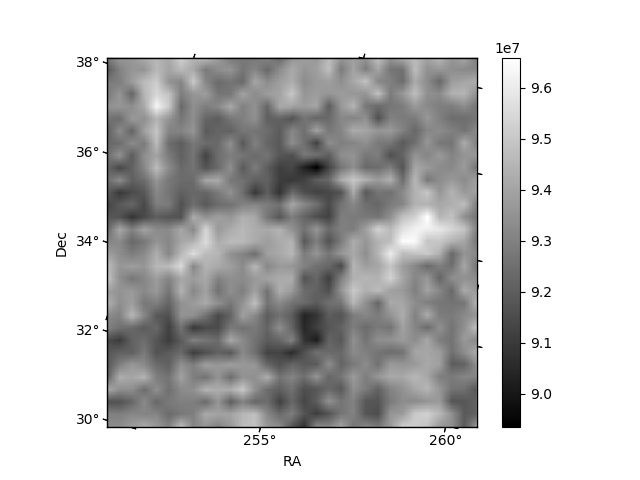
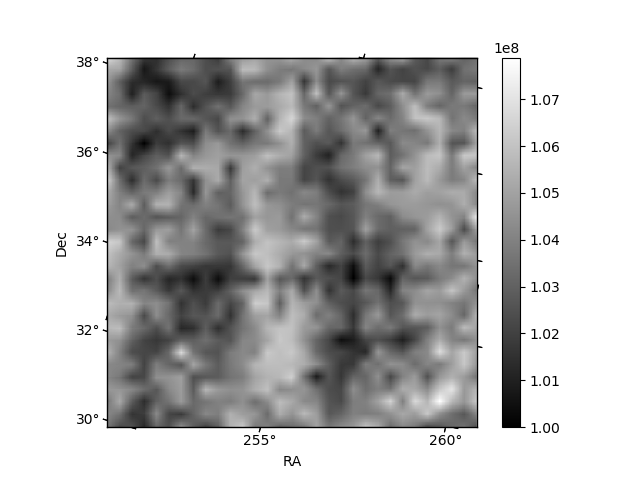
Histogram calculated using DETX and DETY for each event in the final _common_clean file
| Quadrant A | 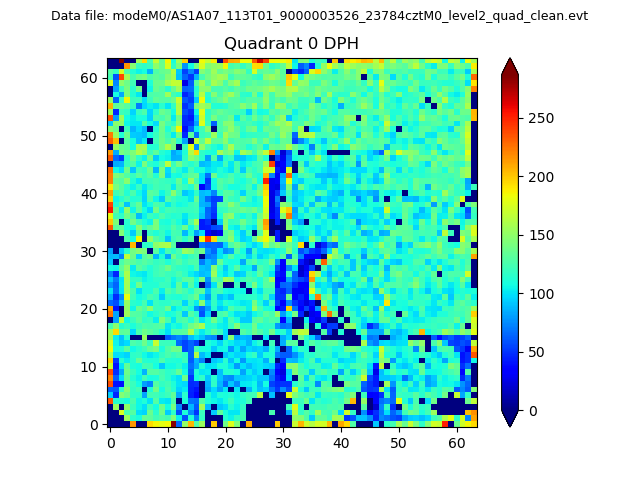 |
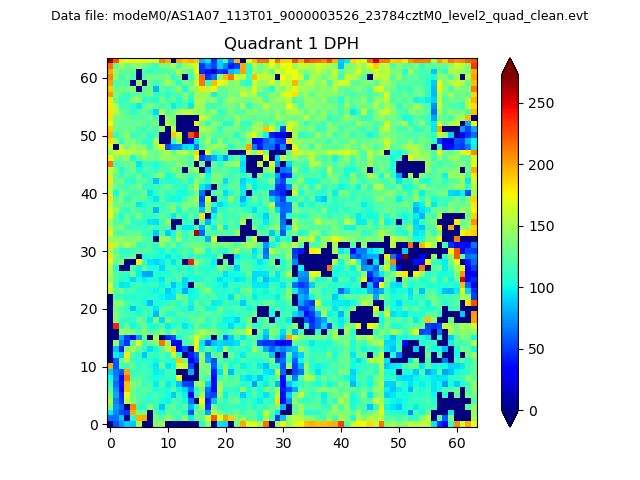 |
Quadrant B |
|---|---|---|---|
| Quadrant D | 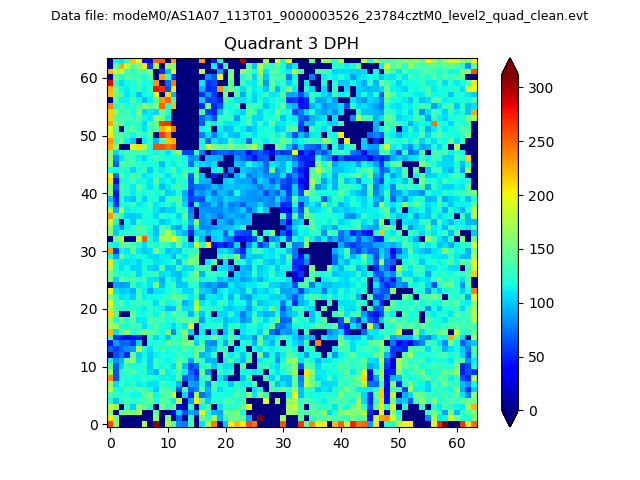 |
 |
Quadrant C |
| Plot type | Count rate plots | Images |
|---|---|---|
| Comparison with Poisson distribution Blue bars denote a histogram of data divided into 1 sec bins. Red curve is a Poisson curve with rate = median count rate of data. |
 |
 |
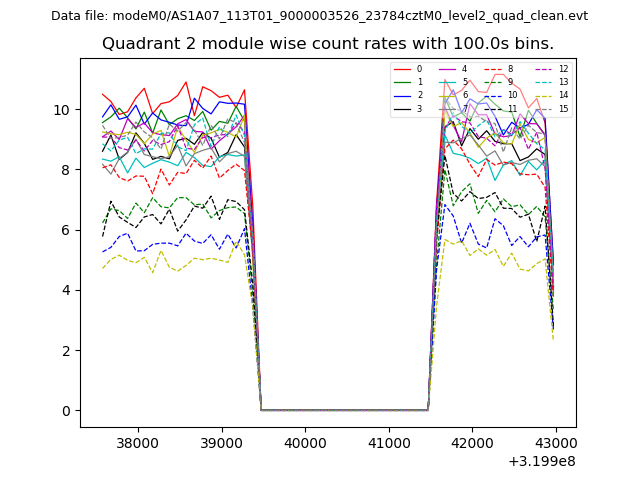
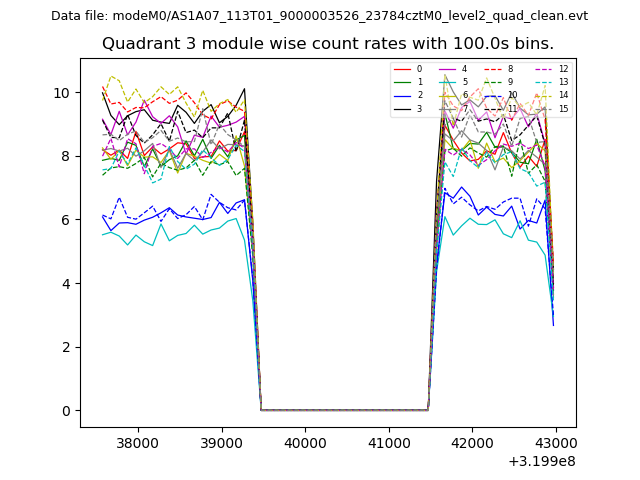
| Quadrant-wise count rates Data is divided into 100 sec bins |
 |
|
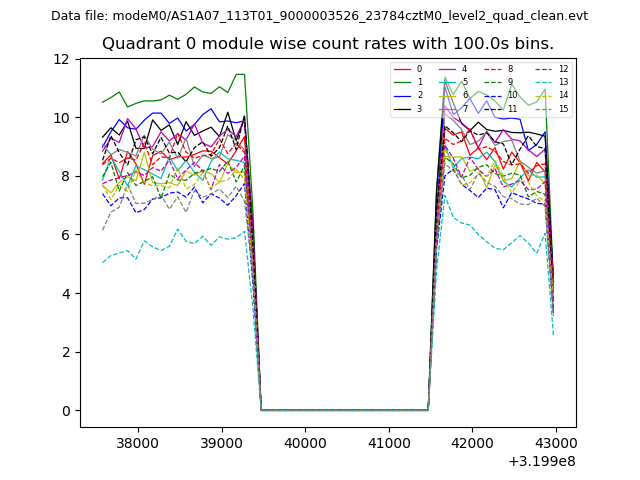
| Module-wise count rates for Quadrant A Data is divided into 100 sec bins |
 |
 |
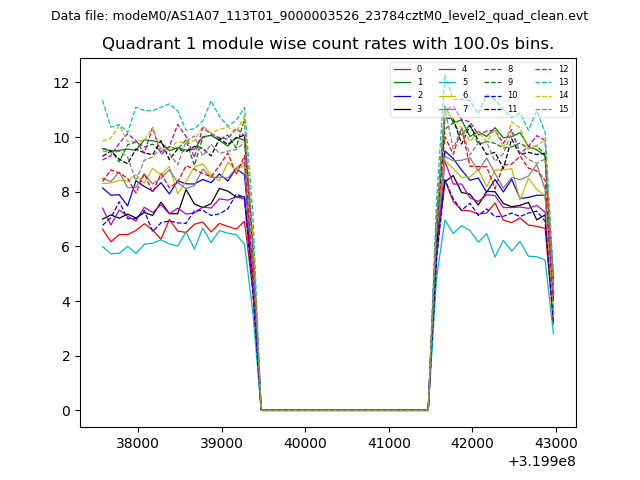
| Module-wise count rates for Quadrant B Data is divided into 100 sec bins |
 |
 |
| Module-wise count rates for Quadrant C Data is divided into 100 sec bins |
 |
 |
| Module-wise count rates for Quadrant D Data is divided into 100 sec bins |
 |
 |
| Parameter | Plot |
|---|---|
| CZT HV Monitor | 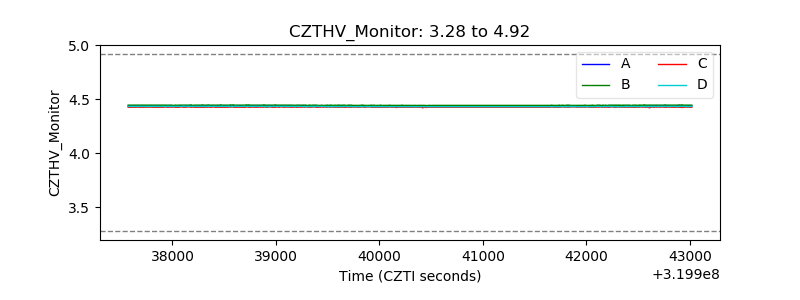 |
| D_VDD | 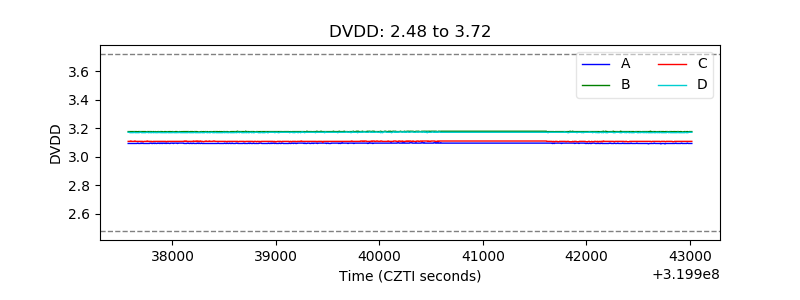 |
| Temperature 1 | 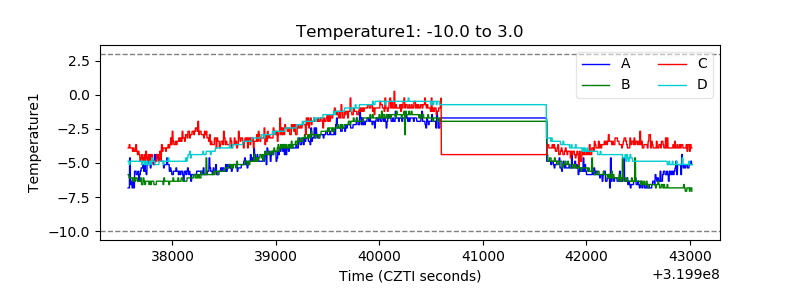 |
| Veto HV Monitor |  |
| Veto LLD | 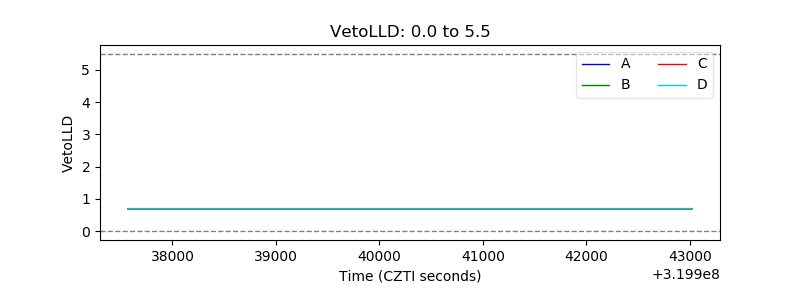 |
| Alpha Counter | 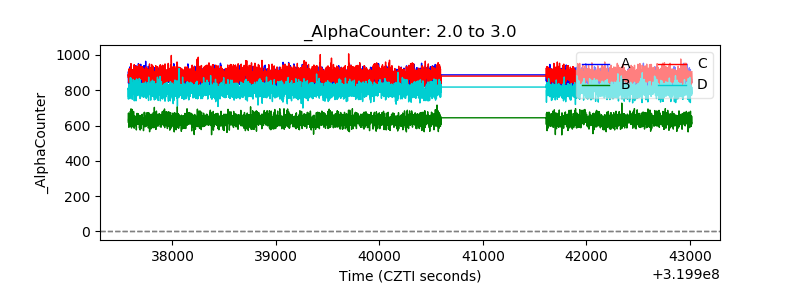 |
| _CPM_Rate |  |
| CZT Counter | 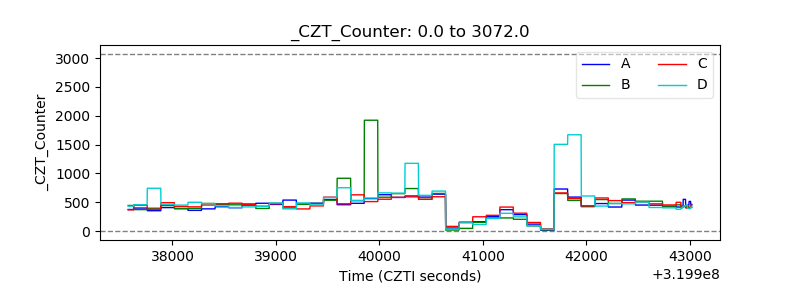 |
| +2.5 Volts monitor | 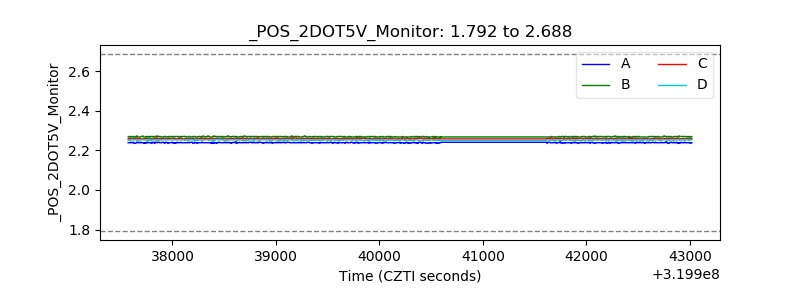 |
| +5 Volts monitor |  |
| _ROLL_ROT | 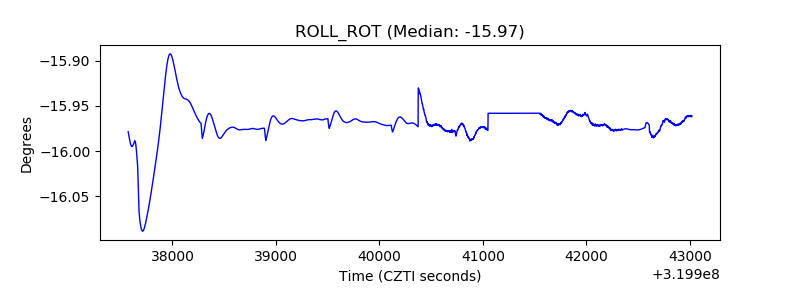 |
| _Roll_DEC | 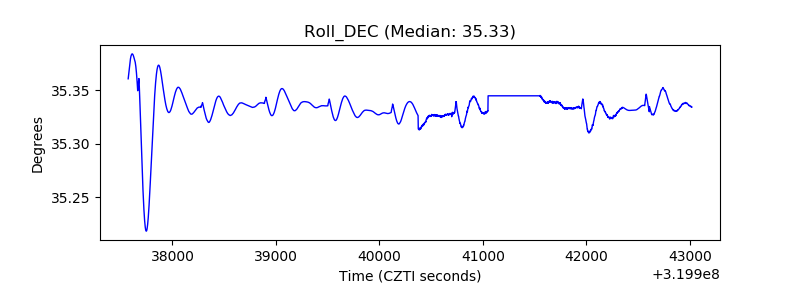 |
| _Roll_RA | 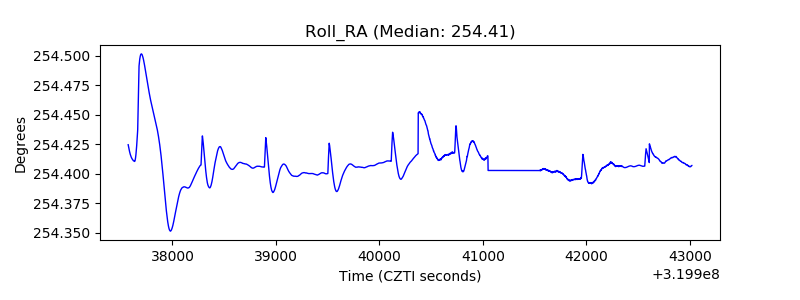 |
| Veto Counter | 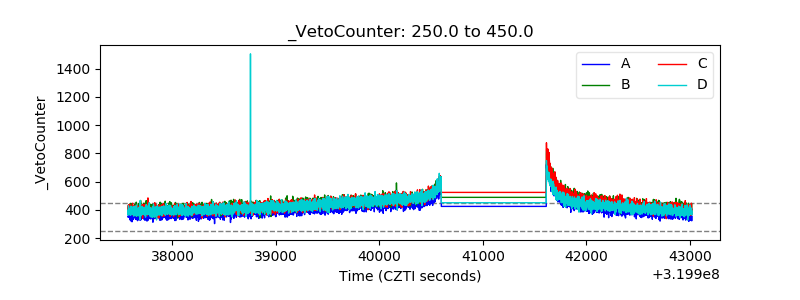 |