| Param | Original file | Final file |
|---|---|---|
| Filename | modeM0/AS1A07_113T01_9000003526_23785cztM0_level2.evt | modeM0/AS1A07_113T01_9000003526_23785cztM0_level2_quad_clean.evt |
| Size (bytes) | 557,573,760 | 105,099,840 |
| Size | 531.7 MB | 100.2 MB |
| Events in quadrant A | 3,569,231 | 673,070 |
| Events in quadrant B | 4,179,075 | 690,938 |
| Events in quadrant C | 3,662,675 | 664,320 |
| Events in quadrant D | 4,972,518 | 638,968 |
| Mode M9 | |||
|---|---|---|---|
| Quadrant | BADHDUFLAG | Total packets | Discarded packets |
| A | 0 | 16 | 0 |
| B | 0 | 16 | 0 |
| C | 0 | 16 | 0 |
| D | 0 | 16 | 0 |
| Mode SS | |||
|---|---|---|---|
| Quadrant | BADHDUFLAG | Total packets | Discarded packets |
| A | 0 | 152 | 0 |
| B | 0 | 152 | 0 |
| C | 0 | 152 | 0 |
| D | 0 | 152 | 0 |
| Mode M0 | |||
|---|---|---|---|
| Quadrant | BADHDUFLAG | Total packets | Discarded packets |
| A | 0 | 15496 | 2 |
| B | 0 | 17315 | 2 |
| C | 0 | 15586 | 2 |
| D | 0 | 19830 | 3 |
| Quadrant | Total seconds | Saturated seconds | Saturation percentage |
|---|---|---|---|
| A | 7412 | 42 | 0.566649% |
| B | 7412 | 223 | 3.008635% |
| C | 7412 | 120 | 1.618996% |
| D | 7412 | 117 | 1.578521% |
Noise dominated data is calculated using 1-second bins in cleaned event files. If a bin has >2000 counts, and if more than 50% of those come from <1% of pixels, then it is considered to be noise-dominated and hence unusable.
| Quadrant | # 1 sec bins | Bins with >0 counts | Bins with >2000 counts | High rate bins dominated by noise | Noise dominated (total time) | Noise dominated (detector-on time) | Marked lightcurve |
|---|---|---|---|---|---|---|---|
| A | 9047 | 7414 | 0 | 0 | 0.00% | 0.00% | 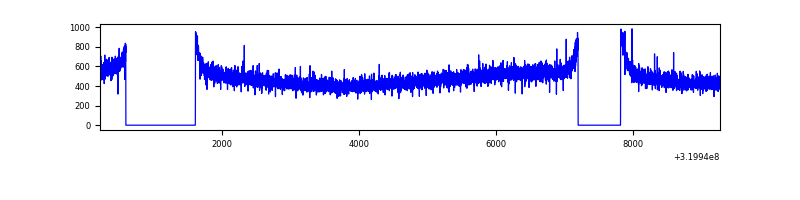 |
| B | 9047 | 7412 | 53 | 53 | 0.59% | 0.72% | 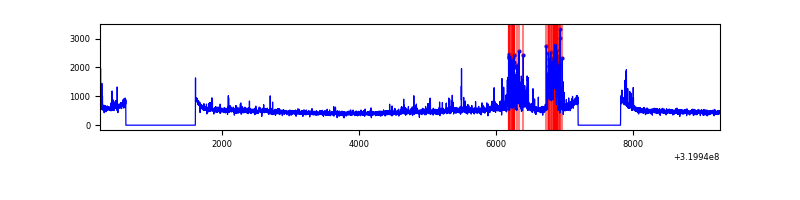 |
| C | 9047 | 7414 | 0 | 0 | 0.00% | 0.00% | 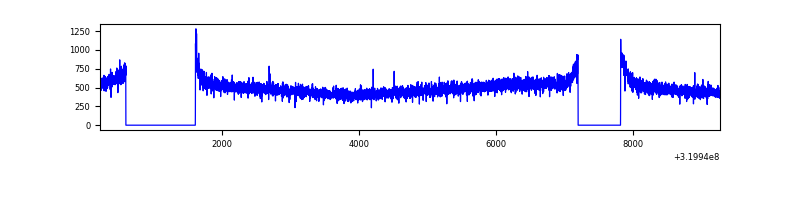 |
| D | 9047 | 7413 | 46 | 46 | 0.51% | 0.62% | 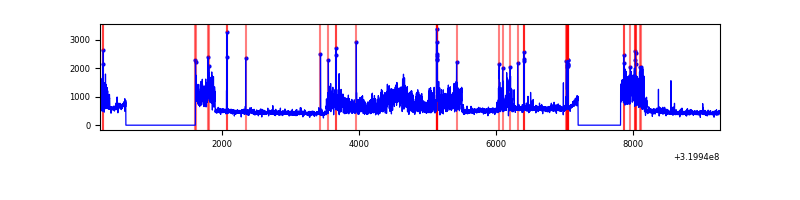 |
Top three noisy pixels from each quadrant. If the there are fewer than three noisy pixels in the level2.evt file, extra rows are filled as -1
| Pixel properties | Quadrant properties | ||||||
|---|---|---|---|---|---|---|---|
| Quadrant | DetID | PixID | Counts | Sigma | Mean | Median | Sigma |
| A | 13 | 254 | 12771 | 63.4 | 925 | 908 | 187.1 |
| A | 3 | 137 | 8264 | 39.31 | 925 | 908 | 187.1 |
| A | 0 | 226 | 7962 | 37.7 | 925 | 908 | 187.1 |
| B | 3 | 64 | 437519 | 2470.91 | 924 | 902 | 176.7 |
| B | 15 | 33 | 71934 | 401.99 | 924 | 902 | 176.7 |
| B | 0 | 189 | 30360 | 166.71 | 924 | 902 | 176.7 |
| C | 14 | 238 | 142407 | 676.32 | 893 | 899 | 209.2 |
| C | 3 | 233 | 23828 | 109.59 | 893 | 899 | 209.2 |
| C | 7 | 247 | 9974 | 43.37 | 893 | 899 | 209.2 |
| D | 8 | 195 | 1278158 | 5893.44 | 895 | 870 | 216.7 |
| D | 12 | 233 | 96666 | 442.01 | 895 | 870 | 216.7 |
| D | 12 | 6 | 50181 | 227.52 | 895 | 870 | 216.7 |
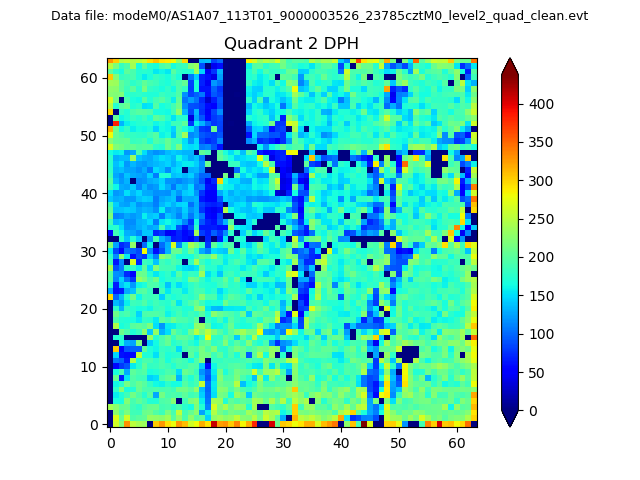
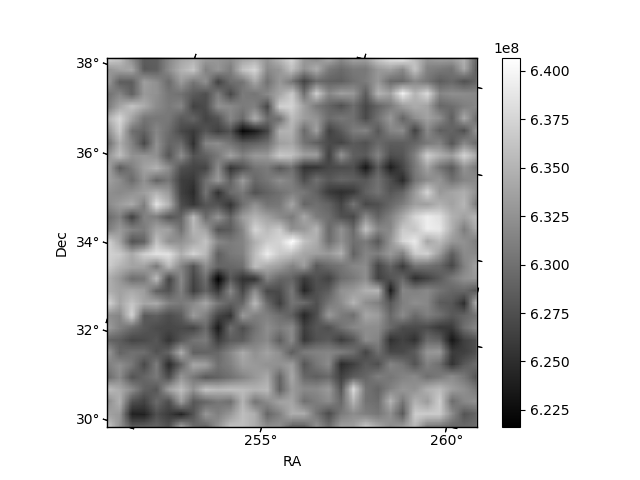
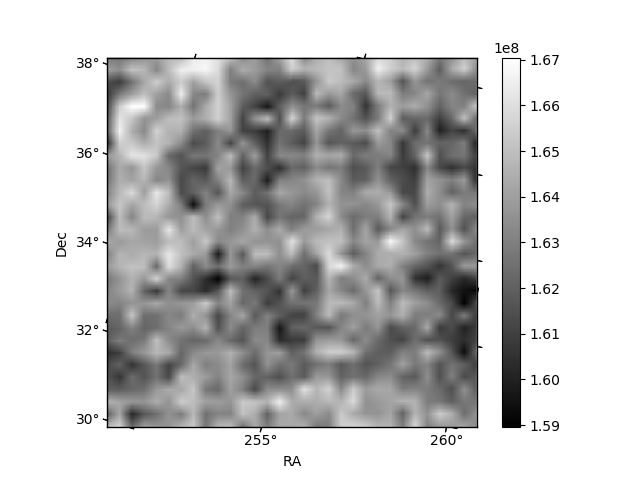
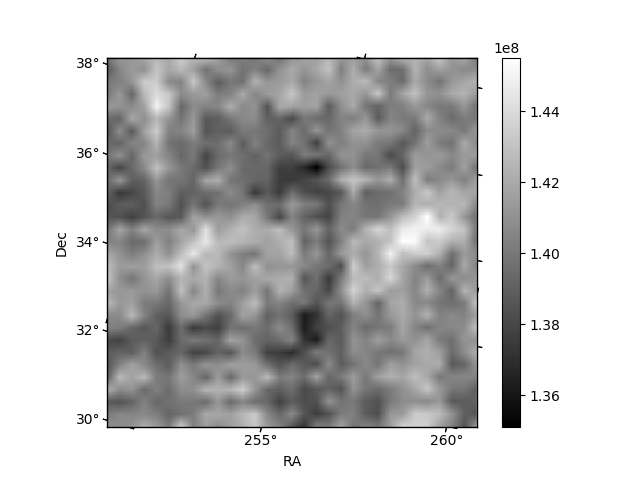
Histogram calculated using DETX and DETY for each event in the final _common_clean file
| Quadrant A | 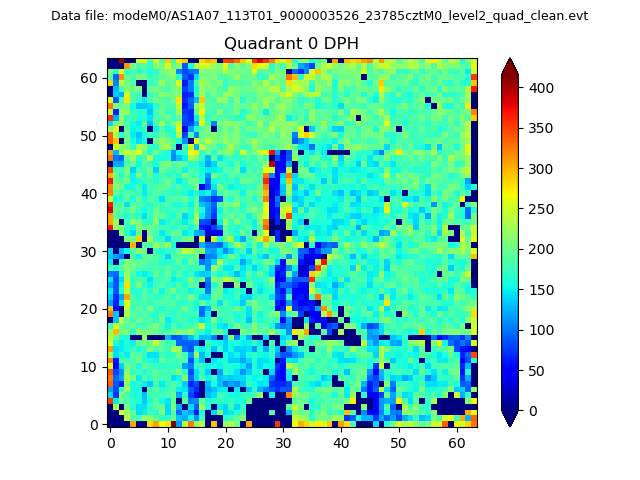 |
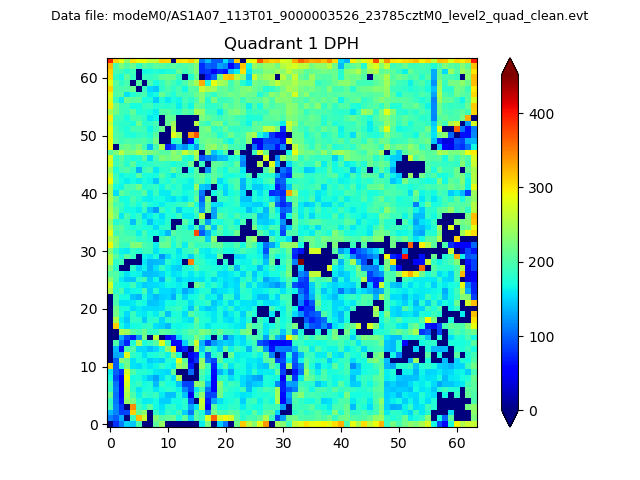 |
Quadrant B |
|---|---|---|---|
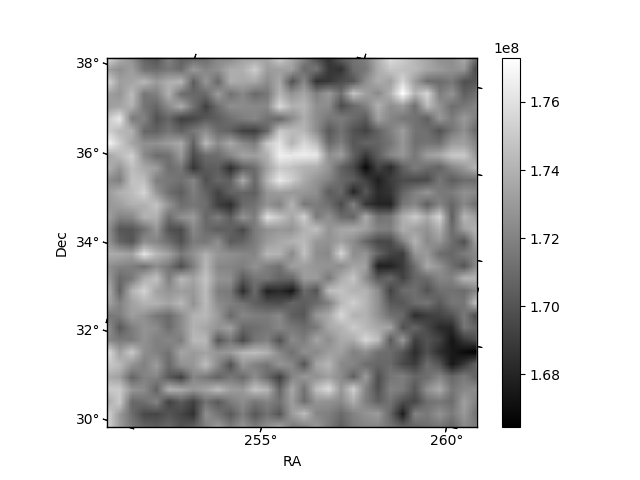
| Quadrant D | 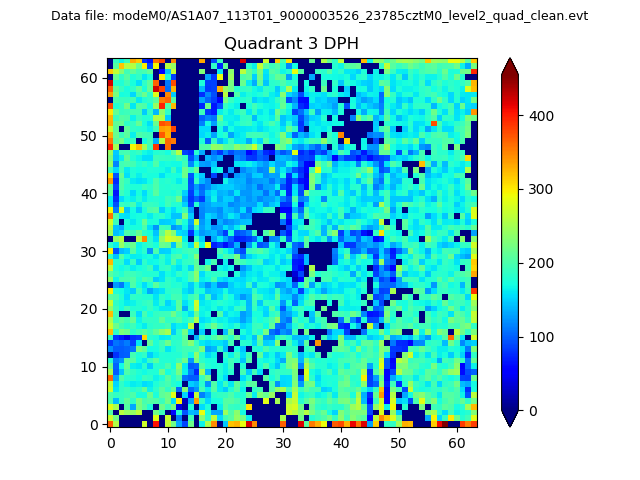 |
 |
Quadrant C |
| Plot type | Count rate plots | Images |
|---|---|---|
| Comparison with Poisson distribution Blue bars denote a histogram of data divided into 1 sec bins. Red curve is a Poisson curve with rate = median count rate of data. |
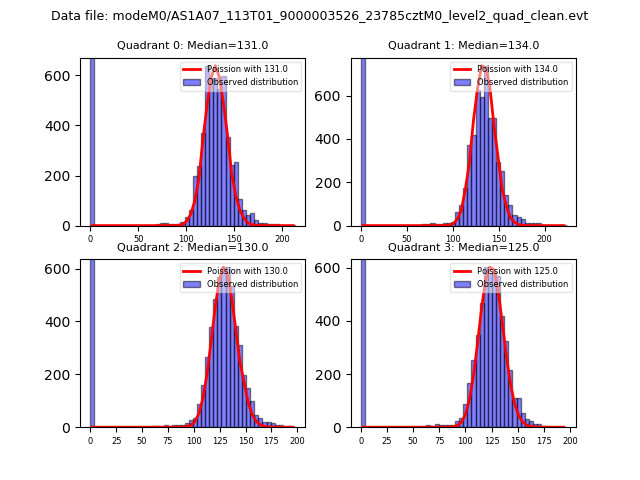 |
 |
| Quadrant-wise count rates Data is divided into 100 sec bins |
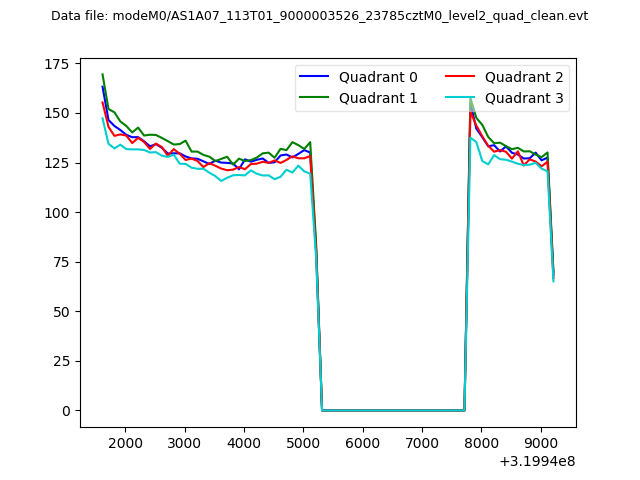 |
|
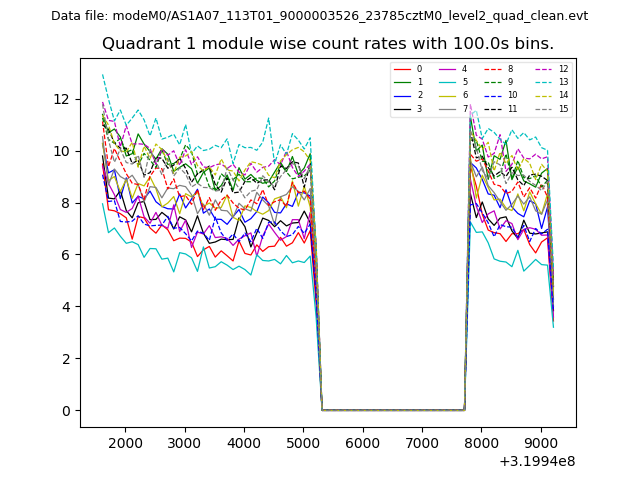
| Module-wise count rates for Quadrant A Data is divided into 100 sec bins |
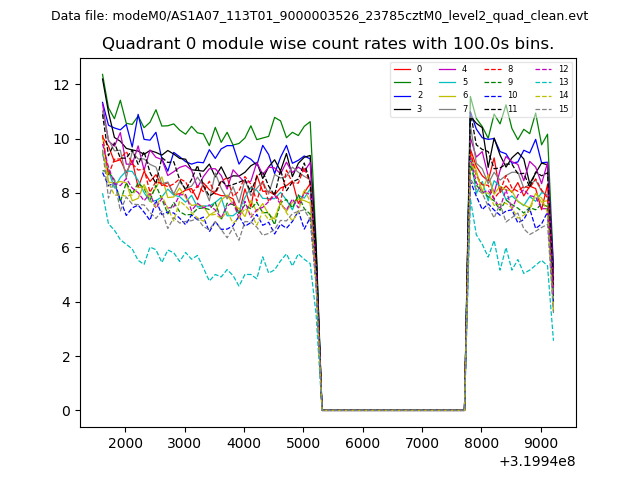 |
 |
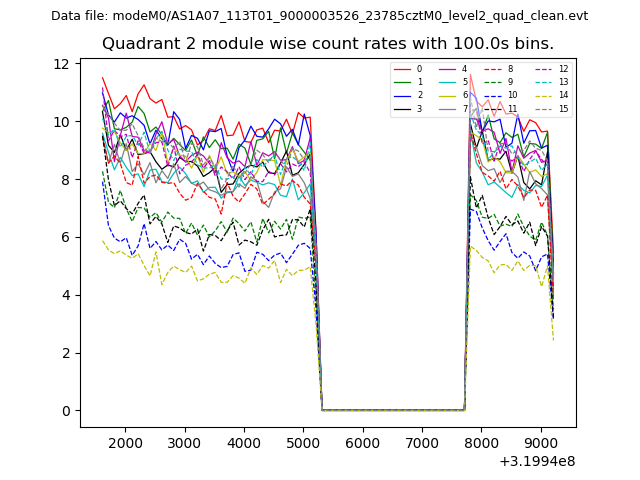
| Module-wise count rates for Quadrant B Data is divided into 100 sec bins |
 |
 |
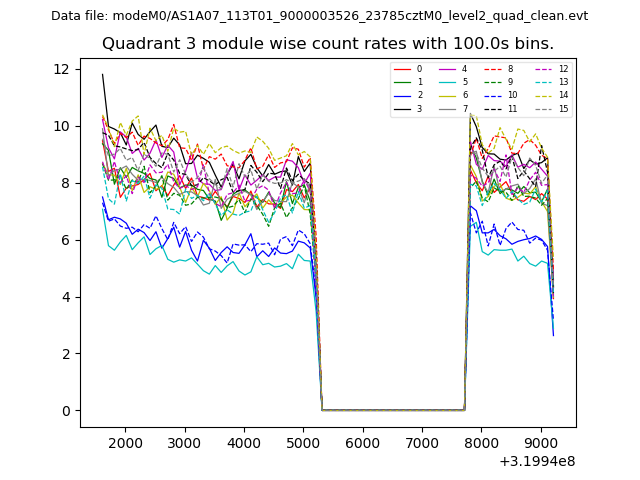
| Module-wise count rates for Quadrant C Data is divided into 100 sec bins |
 |
 |
| Module-wise count rates for Quadrant D Data is divided into 100 sec bins |
 |
 |
| Parameter | Plot |
|---|---|
| CZT HV Monitor | 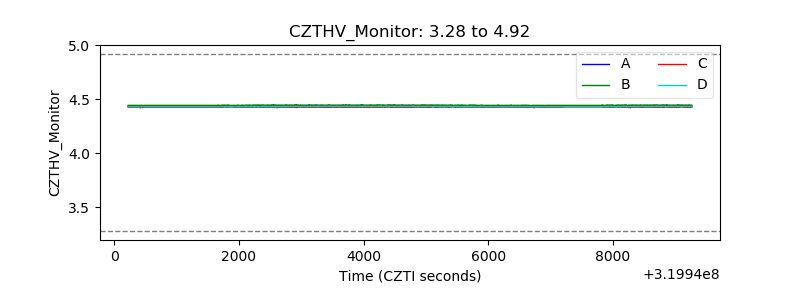 |
| D_VDD | 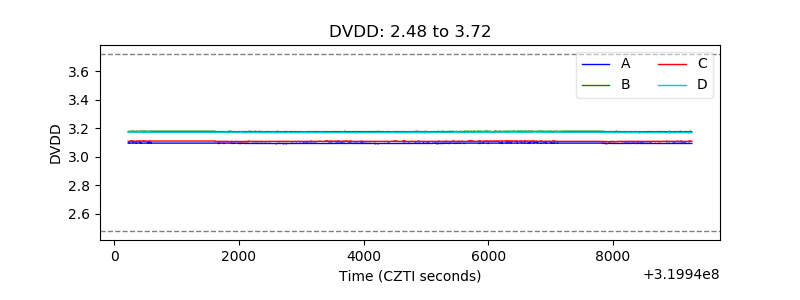 |
| Temperature 1 | 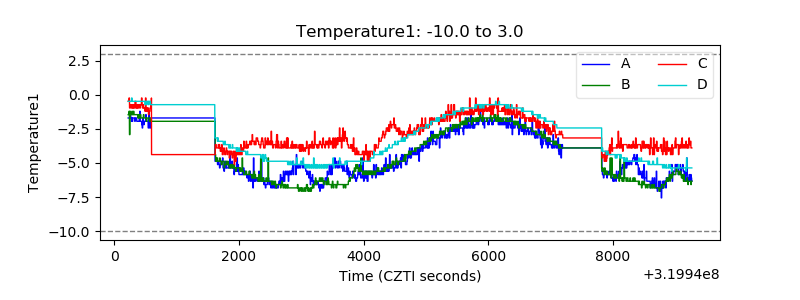 |
| Veto HV Monitor | 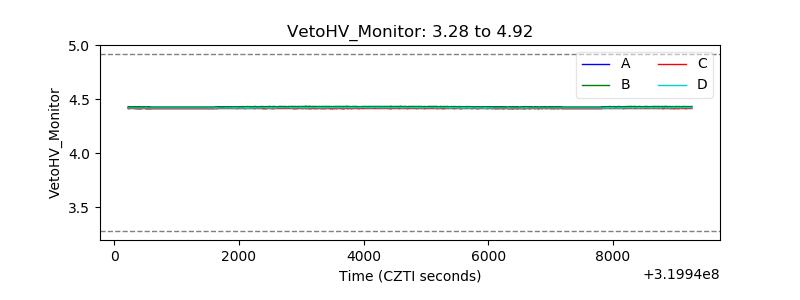 |
| Veto LLD | 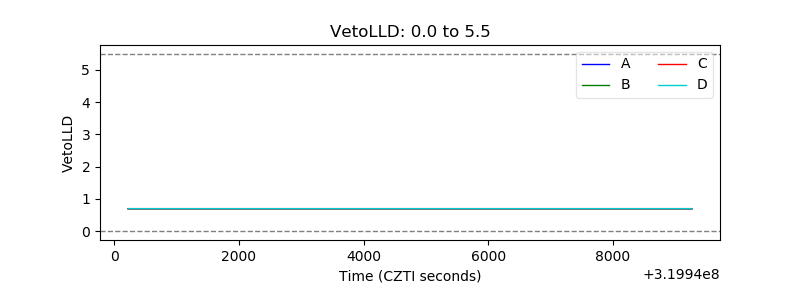 |
| Alpha Counter | 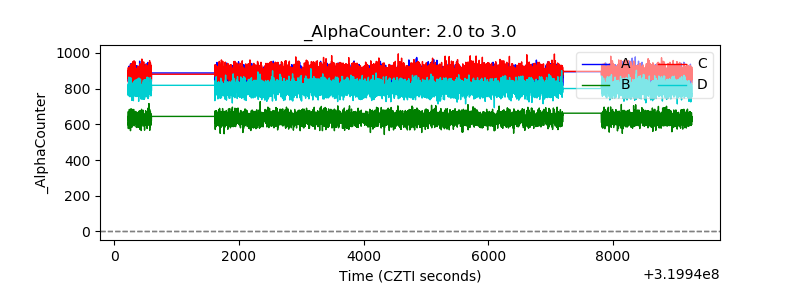 |
| _CPM_Rate | 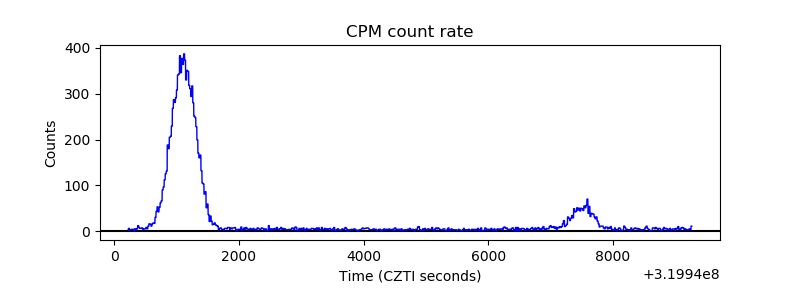 |
| CZT Counter | 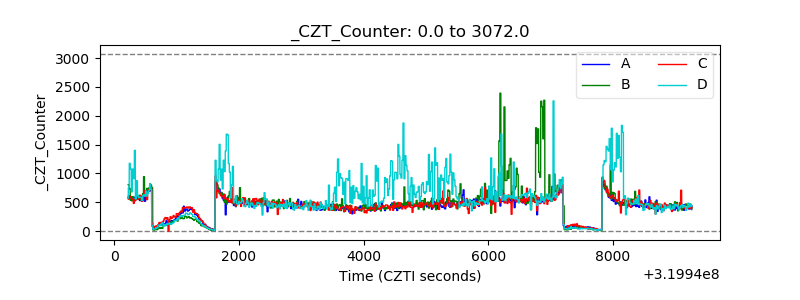 |
| +2.5 Volts monitor |  |
| +5 Volts monitor |  |
| _ROLL_ROT | 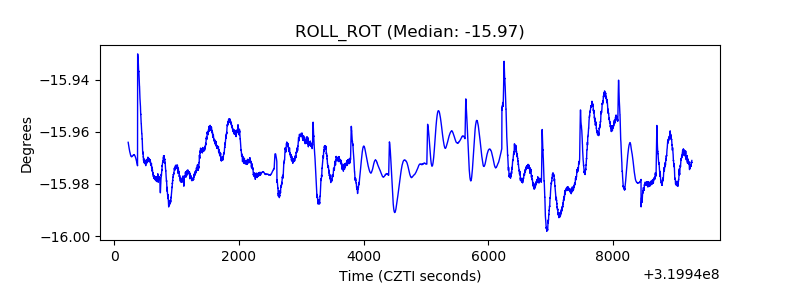 |
| _Roll_DEC | 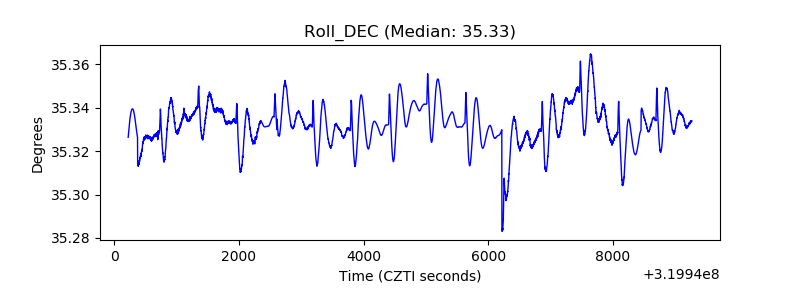 |
| _Roll_RA | 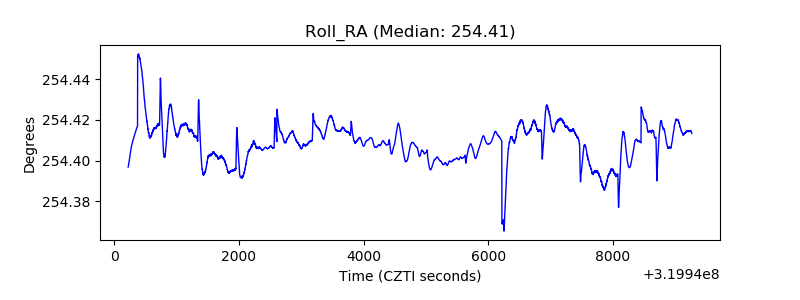 |
| Veto Counter | 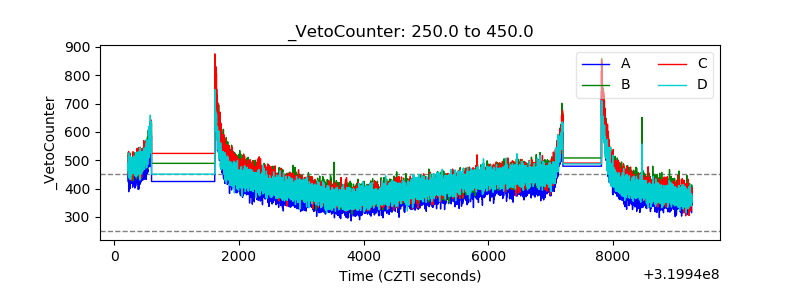 |