| Param | Original file | Final file |
|---|---|---|
| Filename | modeM0/AS1A07_113T01_9000003526_23786cztM0_level2.evt | modeM0/AS1A07_113T01_9000003526_23786cztM0_level2_quad_clean.evt |
| Size (bytes) | 634,861,440 | 113,212,800 |
| Size | 605.5 MB | 108.0 MB |
| Events in quadrant A | 3,989,802 | 718,082 |
| Events in quadrant B | 4,412,433 | 738,422 |
| Events in quadrant C | 4,119,324 | 710,018 |
| Events in quadrant D | 6,146,380 | 689,138 |
| Mode M9 | |||
|---|---|---|---|
| Quadrant | BADHDUFLAG | Total packets | Discarded packets |
| A | 0 | 8 | 0 |
| B | 0 | 8 | 0 |
| C | 0 | 8 | 0 |
| D | 0 | 8 | 0 |
| Mode SS | |||
|---|---|---|---|
| Quadrant | BADHDUFLAG | Total packets | Discarded packets |
| A | 0 | 168 | 2 |
| B | 0 | 168 | 0 |
| C | 0 | 168 | 0 |
| D | 0 | 168 | 2 |
| Mode M0 | |||
|---|---|---|---|
| Quadrant | BADHDUFLAG | Total packets | Discarded packets |
| A | 0 | 17456 | 124 |
| B | 0 | 18659 | 100 |
| C | 0 | 17634 | 79 |
| D | 0 | 24119 | 92 |
| Quadrant | Total seconds | Saturated seconds | Saturation percentage |
|---|---|---|---|
| A | 8236 | 109 | 1.323458% |
| B | 8248 | 279 | 3.382638% |
| C | 8258 | 195 | 2.361347% |
| D | 8253 | 467 | 5.658548% |
Noise dominated data is calculated using 1-second bins in cleaned event files. If a bin has >2000 counts, and if more than 50% of those come from <1% of pixels, then it is considered to be noise-dominated and hence unusable.
| Quadrant | # 1 sec bins | Bins with >0 counts | Bins with >2000 counts | High rate bins dominated by noise | Noise dominated (total time) | Noise dominated (detector-on time) | Marked lightcurve |
|---|---|---|---|---|---|---|---|
| A | 9057 | 8291 | 0 | 0 | 0.00% | 0.00% | 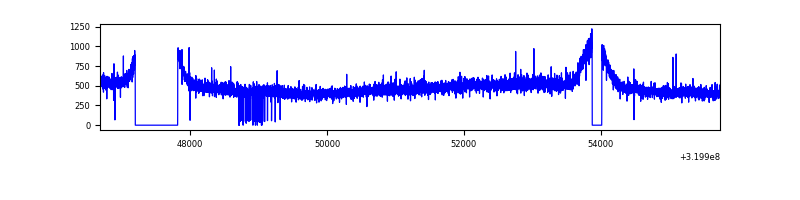 |
| B | 9057 | 8291 | 41 | 41 | 0.45% | 0.49% | 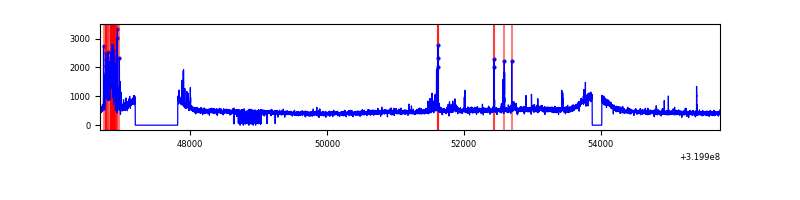 |
| C | 9057 | 8293 | 0 | 0 | 0.00% | 0.00% | 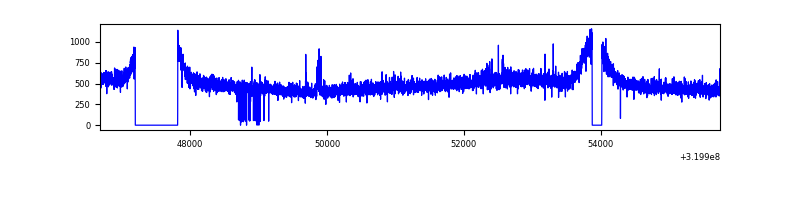 |
| D | 9057 | 8298 | 248 | 248 | 2.74% | 2.99% | 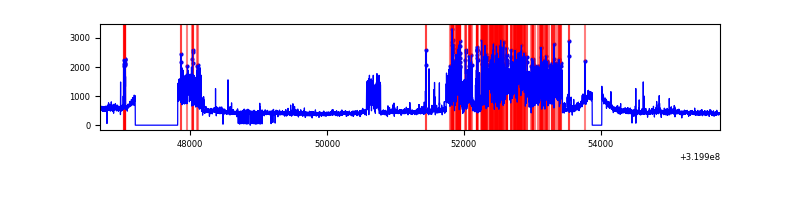 |
Top three noisy pixels from each quadrant. If the there are fewer than three noisy pixels in the level2.evt file, extra rows are filled as -1
| Pixel properties | Quadrant properties | ||||||
|---|---|---|---|---|---|---|---|
| Quadrant | DetID | PixID | Counts | Sigma | Mean | Median | Sigma |
| A | 13 | 254 | 14583 | 64.55 | 1034 | 1012 | 210.2 |
| A | 3 | 137 | 9374 | 39.77 | 1034 | 1012 | 210.2 |
| A | 0 | 226 | 8878 | 37.41 | 1034 | 1012 | 210.2 |
| B | 3 | 64 | 271428 | 1343.26 | 1036 | 1010 | 201.3 |
| B | 12 | 17 | 36024 | 173.93 | 1036 | 1010 | 201.3 |
| B | 12 | 111 | 24544 | 116.9 | 1036 | 1010 | 201.3 |
| C | 14 | 238 | 157291 | 661.68 | 997 | 1002 | 236.2 |
| C | 7 | 247 | 58517 | 243.5 | 997 | 1002 | 236.2 |
| C | 13 | 61 | 7049 | 25.6 | 997 | 1002 | 236.2 |
| D | 8 | 195 | 1695681 | 6930.64 | 992 | 962 | 244.5 |
| D | 1 | 52 | 353605 | 1442.15 | 992 | 962 | 244.5 |
| D | 12 | 233 | 241203 | 982.48 | 992 | 962 | 244.5 |
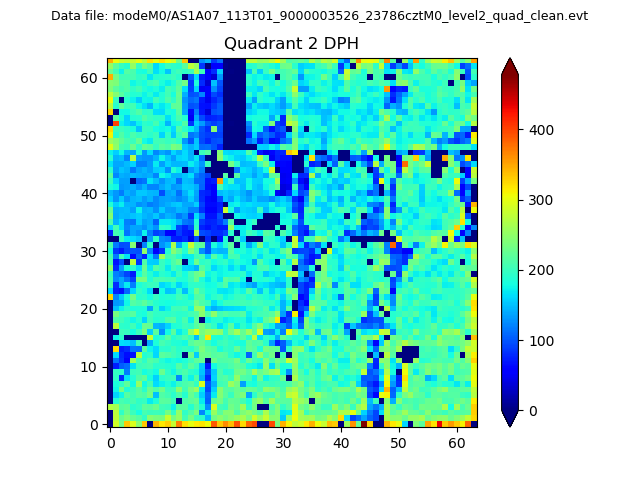
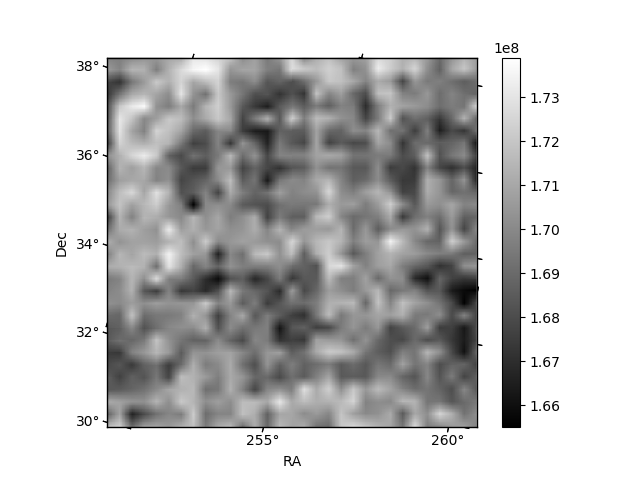
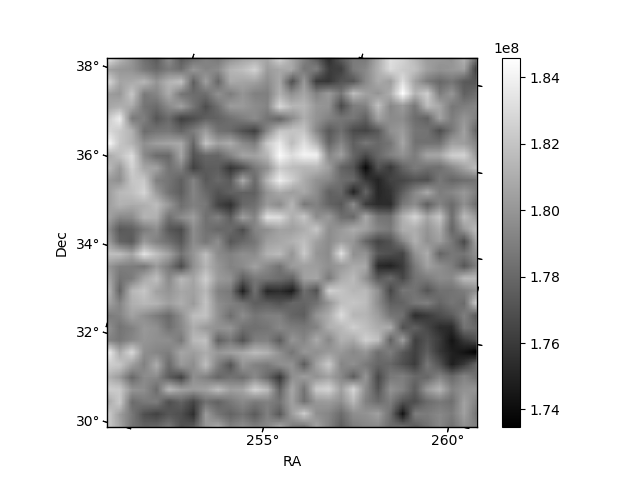
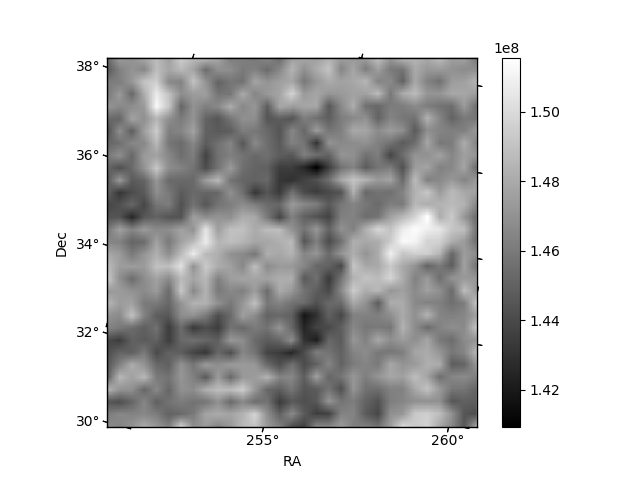
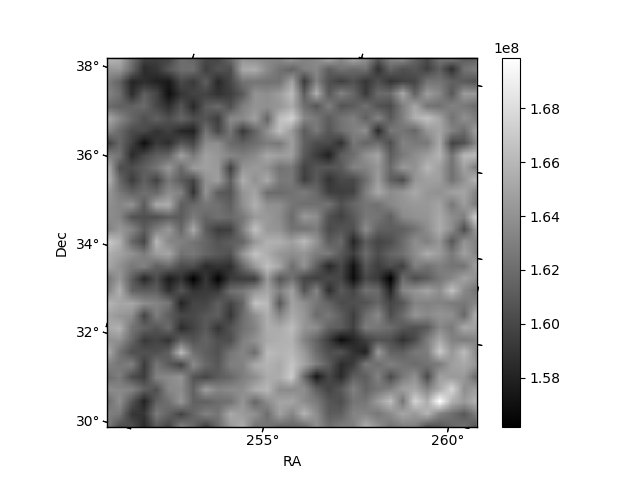
Histogram calculated using DETX and DETY for each event in the final _common_clean file
| Quadrant A | 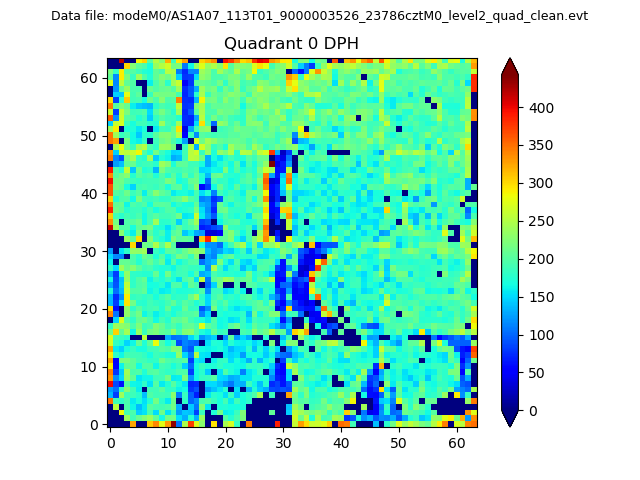 |
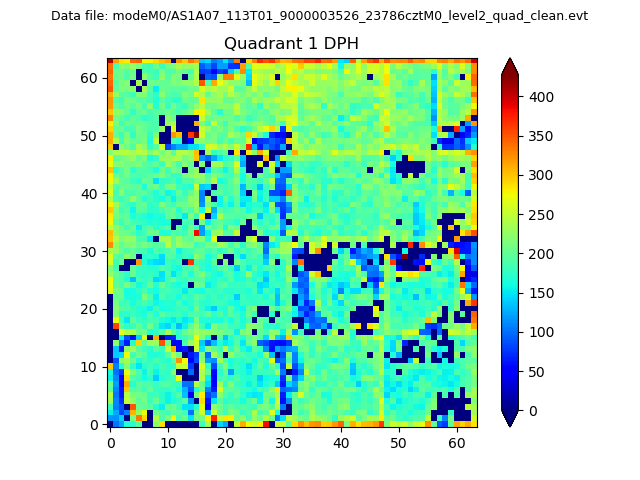 |
Quadrant B |
|---|---|---|---|
| Quadrant D | 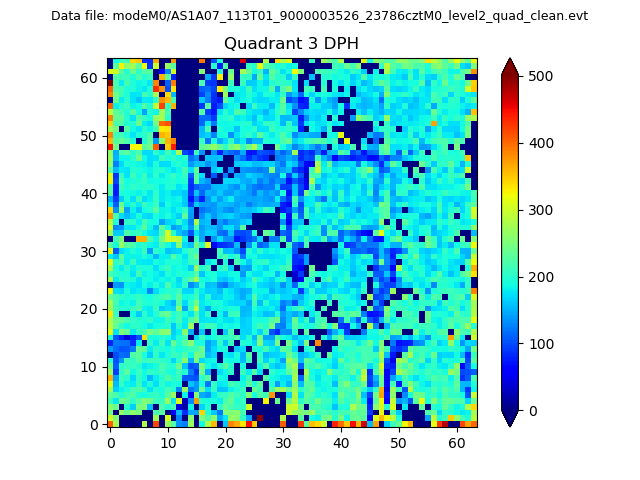 |
 |
Quadrant C |
| Plot type | Count rate plots | Images |
|---|---|---|
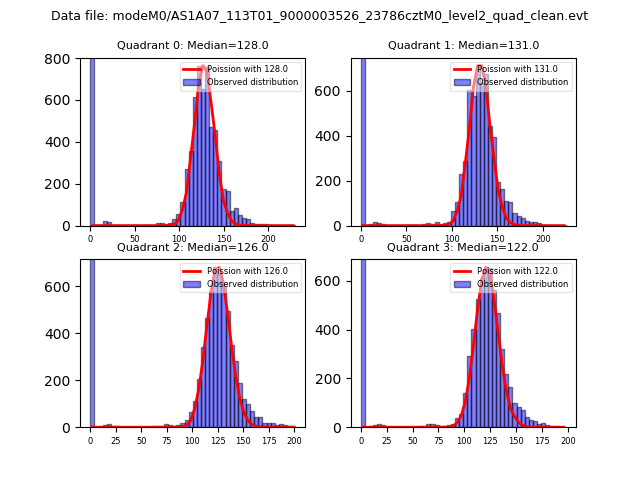
| Comparison with Poisson distribution Blue bars denote a histogram of data divided into 1 sec bins. Red curve is a Poisson curve with rate = median count rate of data. |
 |
 |
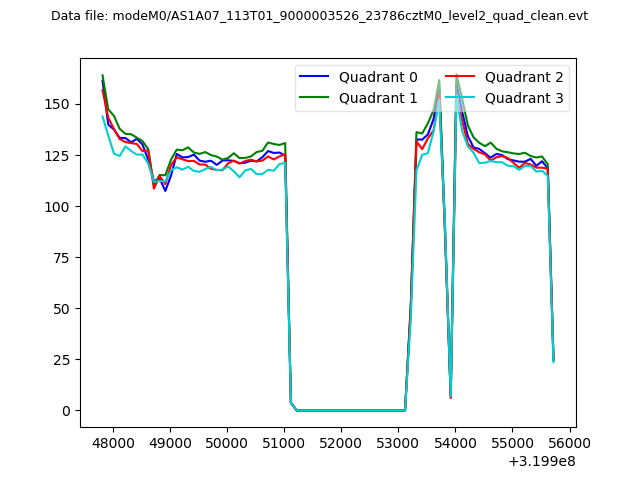
| Quadrant-wise count rates Data is divided into 100 sec bins |
 |
|
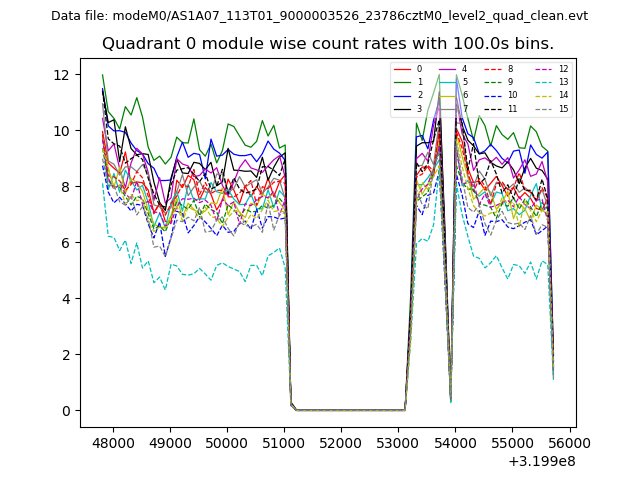
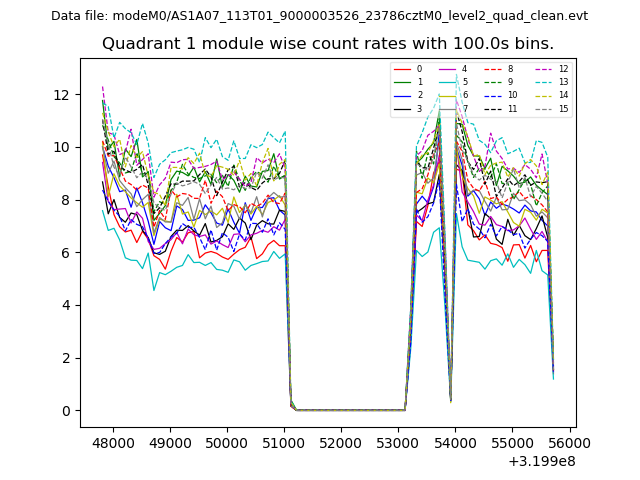
| Module-wise count rates for Quadrant A Data is divided into 100 sec bins |
 |
 |
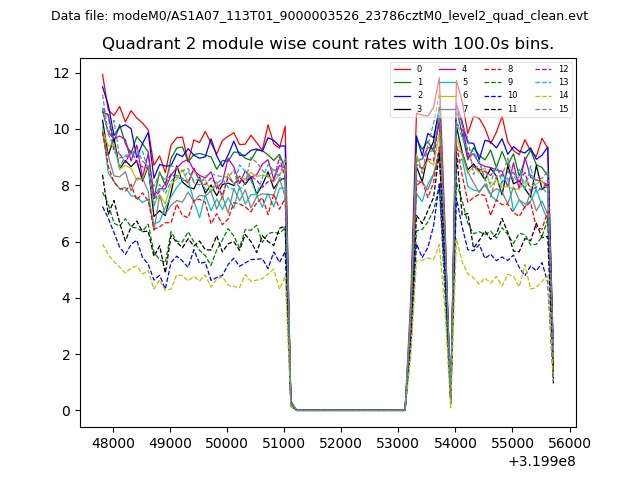
| Module-wise count rates for Quadrant B Data is divided into 100 sec bins |
 |
 |
| Module-wise count rates for Quadrant C Data is divided into 100 sec bins |
 |
 |
| Module-wise count rates for Quadrant D Data is divided into 100 sec bins |
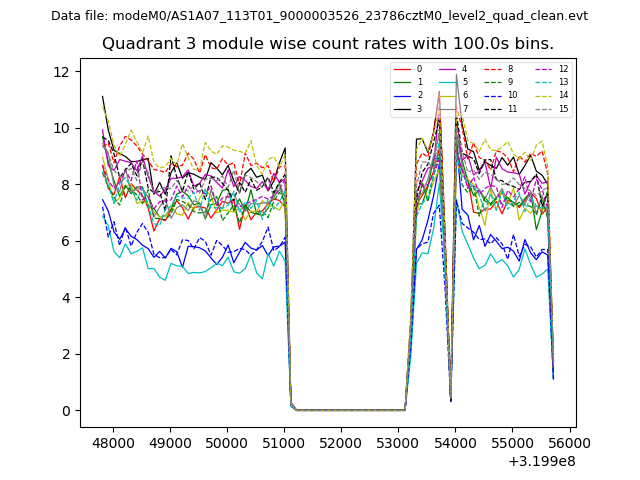 |
 |
| Parameter | Plot |
|---|---|
| CZT HV Monitor |  |
| D_VDD | 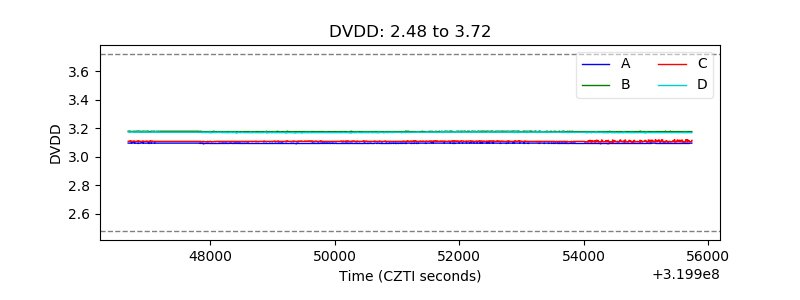 |
| Temperature 1 | 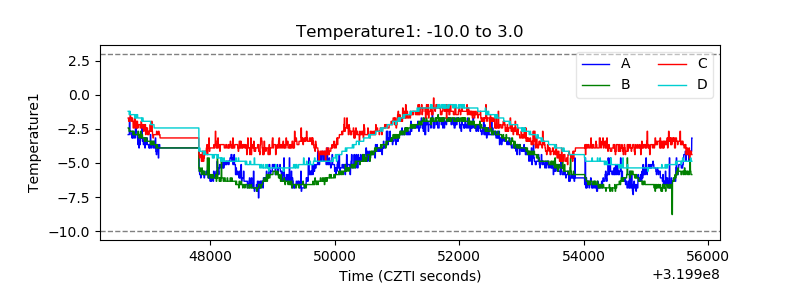 |
| Veto HV Monitor | 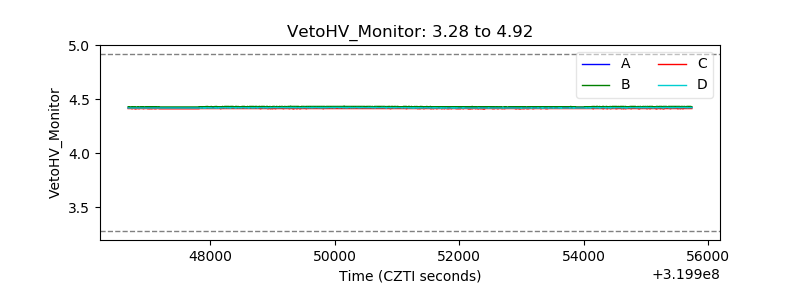 |
| Veto LLD | 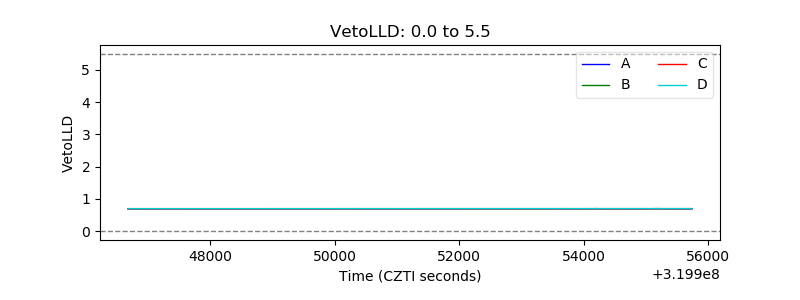 |
| Alpha Counter | 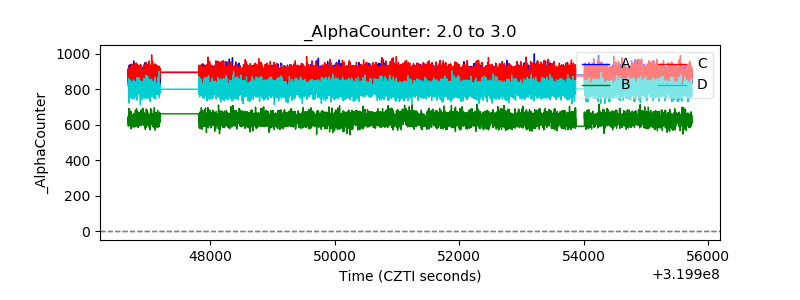 |
| _CPM_Rate | 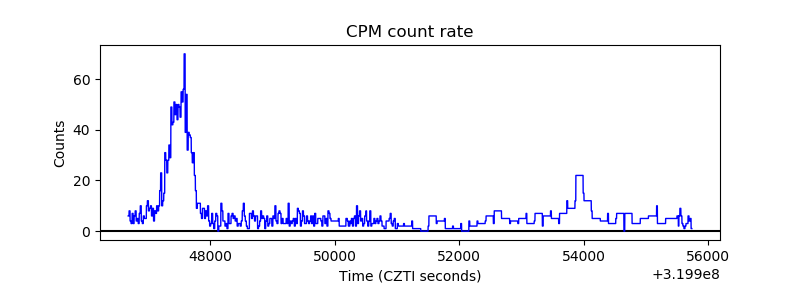 |
| CZT Counter | 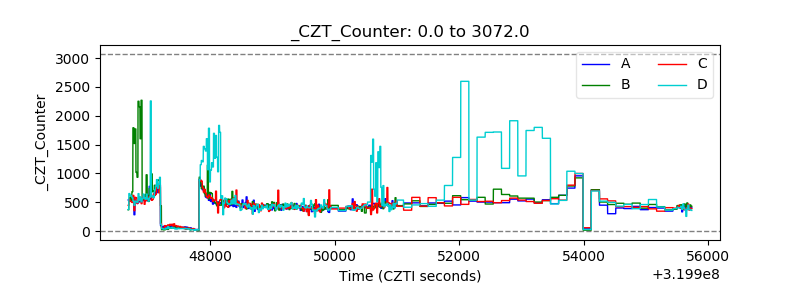 |
| +2.5 Volts monitor |  |
| +5 Volts monitor | 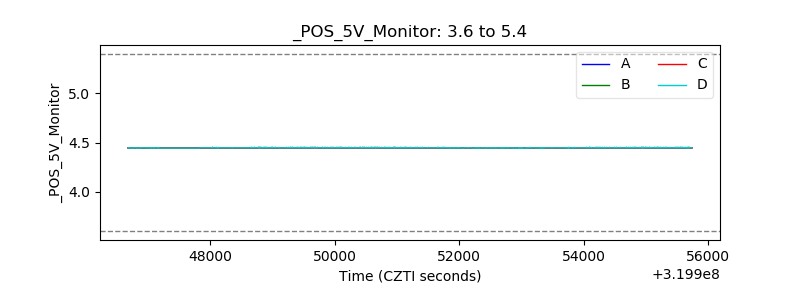 |
| _ROLL_ROT | 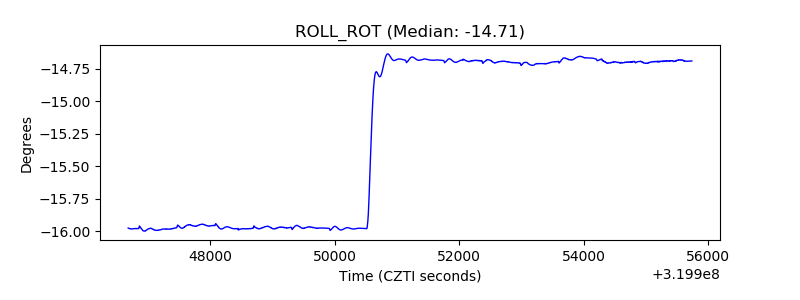 |
| _Roll_DEC | 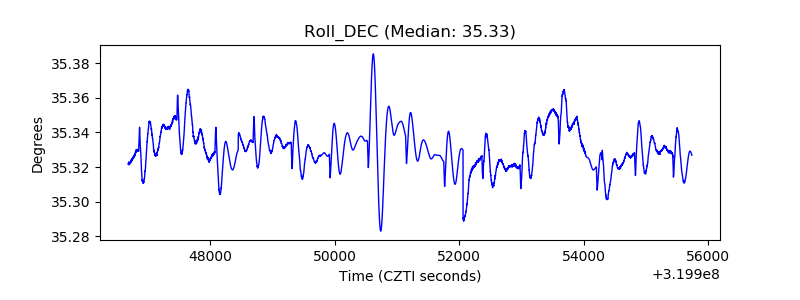 |
| _Roll_RA | 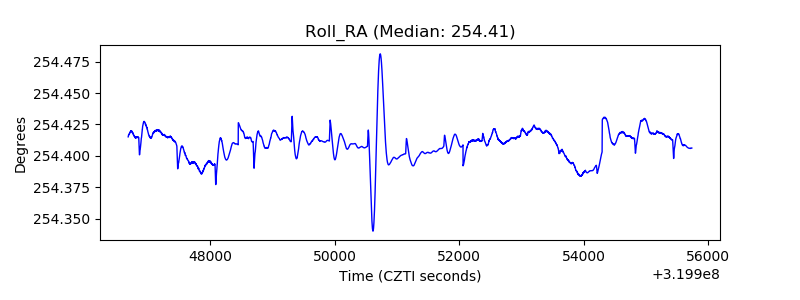 |
| Veto Counter | 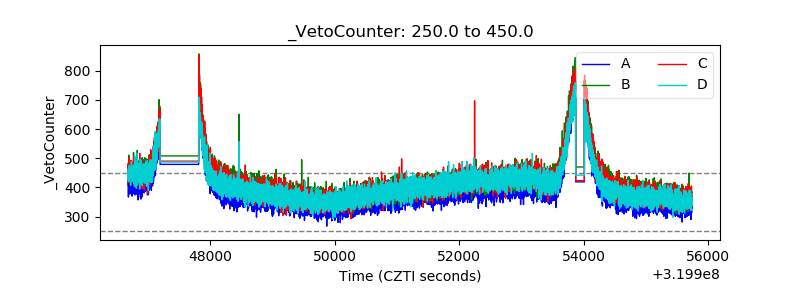 |