| Param | Original file | Final file |
|---|---|---|
| Filename | modeM0/AS1A07_113T01_9000003526_23787cztM0_level2.evt | modeM0/AS1A07_113T01_9000003526_23787cztM0_level2_quad_clean.evt |
| Size (bytes) | 478,382,400 | 98,717,760 |
| Size | 456.2 MB | 94.1 MB |
| Events in quadrant A | 3,332,139 | 625,178 |
| Events in quadrant B | 3,481,396 | 642,584 |
| Events in quadrant C | 3,402,660 | 617,480 |
| Events in quadrant D | 3,784,545 | 605,376 |
| Mode M9 | |||
|---|---|---|---|
| Quadrant | BADHDUFLAG | Total packets | Discarded packets |
| A | 0 | 1 | 0 |
| B | 0 | 1 | 0 |
| C | 0 | 1 | 0 |
| D | 0 | 1 | 0 |
| Mode SS | |||
|---|---|---|---|
| Quadrant | BADHDUFLAG | Total packets | Discarded packets |
| A | 0 | 146 | 0 |
| B | 0 | 146 | 0 |
| C | 0 | 146 | 0 |
| D | 0 | 146 | 0 |
| Mode M0 | |||
|---|---|---|---|
| Quadrant | BADHDUFLAG | Total packets | Discarded packets |
| A | 0 | 14760 | 2 |
| B | 0 | 15108 | 2 |
| C | 0 | 14820 | 2 |
| D | 0 | 16034 | 3 |
| Quadrant | Total seconds | Saturated seconds | Saturation percentage |
|---|---|---|---|
| A | 7162 | 101 | 1.410221% |
| B | 7163 | 151 | 2.108055% |
| C | 7163 | 137 | 1.912606% |
| D | 7162 | 119 | 1.661547% |
Noise dominated data is calculated using 1-second bins in cleaned event files. If a bin has >2000 counts, and if more than 50% of those come from <1% of pixels, then it is considered to be noise-dominated and hence unusable.
| Quadrant | # 1 sec bins | Bins with >0 counts | Bins with >2000 counts | High rate bins dominated by noise | Noise dominated (total time) | Noise dominated (detector-on time) | Marked lightcurve |
|---|---|---|---|---|---|---|---|
| A | 7307 | 7163 | 0 | 0 | 0.00% | 0.00% | 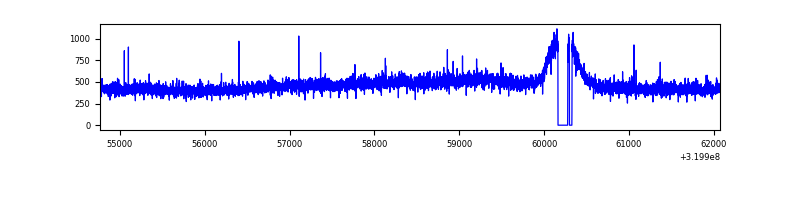 |
| B | 7308 | 7163 | 6 | 6 | 0.08% | 0.08% | 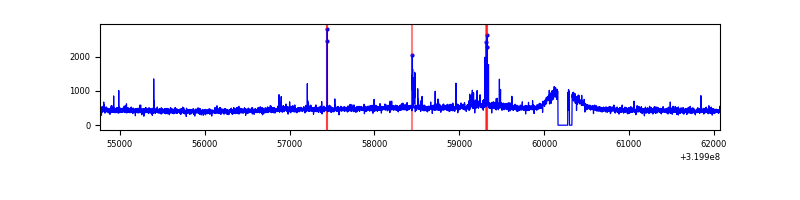 |
| C | 7308 | 7164 | 0 | 0 | 0.00% | 0.00% | 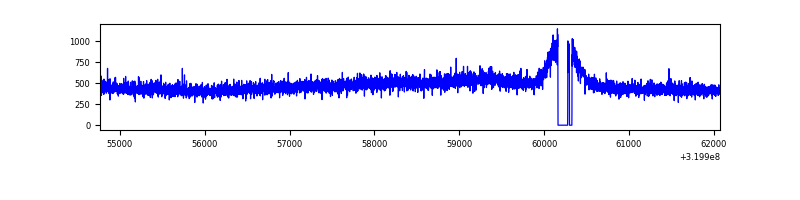 |
| D | 7307 | 7164 | 61 | 61 | 0.83% | 0.85% | 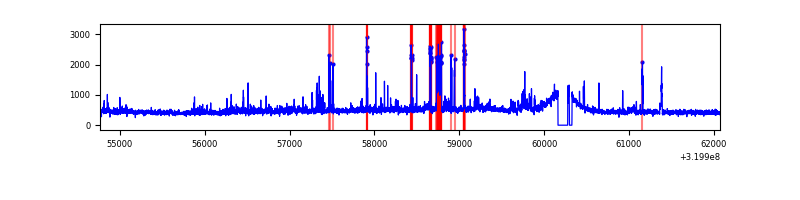 |
Top three noisy pixels from each quadrant. If the there are fewer than three noisy pixels in the level2.evt file, extra rows are filled as -1
| Pixel properties | Quadrant properties | ||||||
|---|---|---|---|---|---|---|---|
| Quadrant | DetID | PixID | Counts | Sigma | Mean | Median | Sigma |
| A | 13 | 254 | 12887 | 68.81 | 863 | 845 | 175.0 |
| A | 3 | 137 | 7874 | 40.17 | 863 | 845 | 175.0 |
| A | 0 | 226 | 7464 | 37.82 | 863 | 845 | 175.0 |
| B | 3 | 64 | 71212 | 424.79 | 861 | 838 | 165.7 |
| B | 12 | 111 | 20280 | 117.35 | 861 | 838 | 165.7 |
| B | 11 | 111 | 18214 | 104.88 | 861 | 838 | 165.7 |
| C | 14 | 238 | 130353 | 662.0 | 828 | 835 | 195.6 |
| C | 7 | 247 | 25516 | 126.15 | 828 | 835 | 195.6 |
| C | 8 | 128 | 10241 | 48.08 | 828 | 835 | 195.6 |
| D | 8 | 195 | 293496 | 1417.78 | 836 | 809 | 206.4 |
| D | 1 | 52 | 136967 | 659.55 | 836 | 809 | 206.4 |
| D | 13 | 174 | 111362 | 535.52 | 836 | 809 | 206.4 |
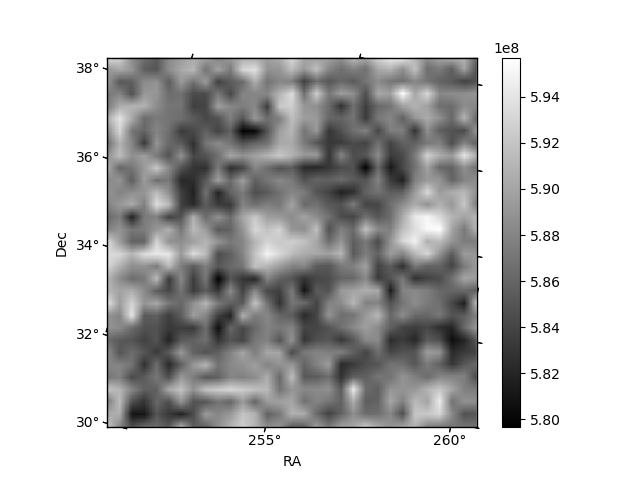
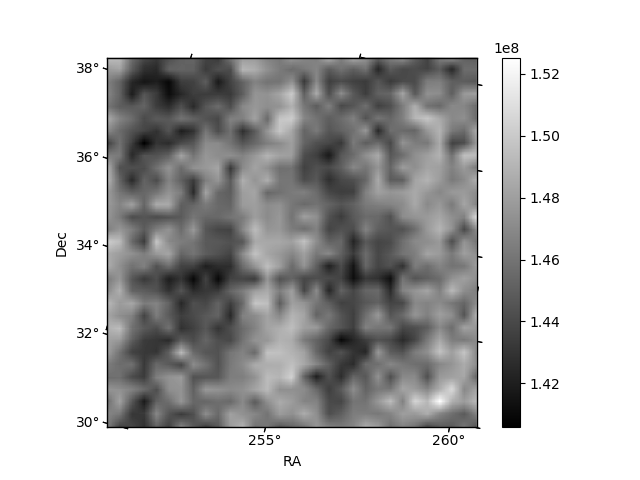
Histogram calculated using DETX and DETY for each event in the final _common_clean file
| Quadrant A | 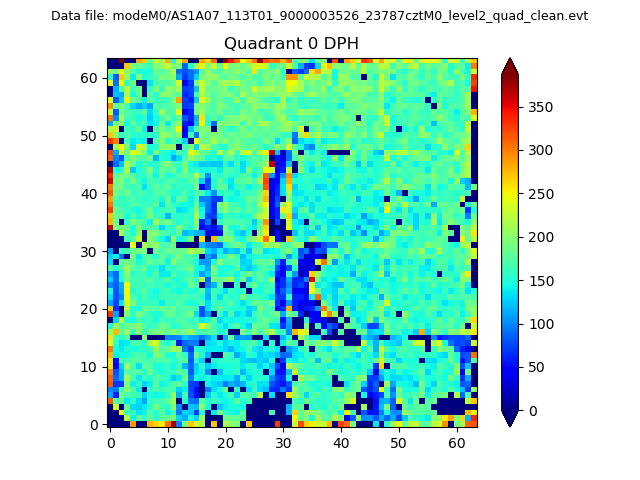 |
 |
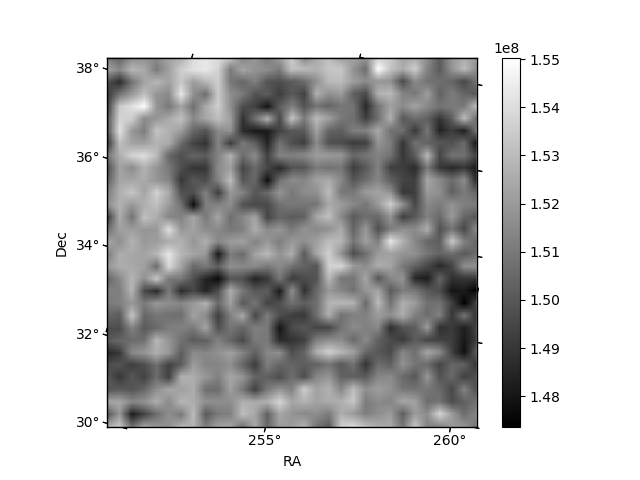
Quadrant B |
|---|---|---|---|
| Quadrant D | 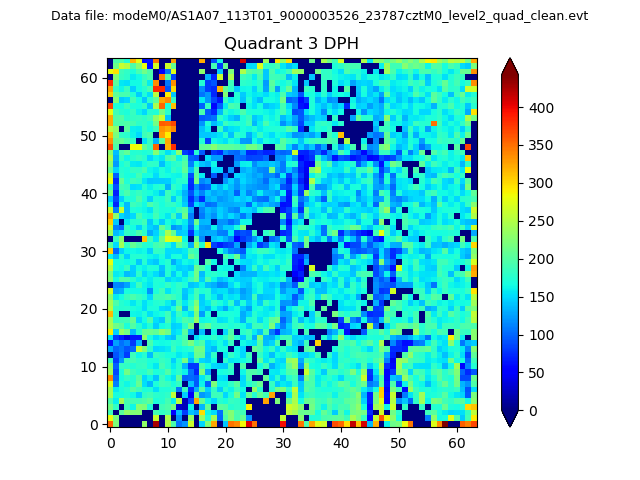 |
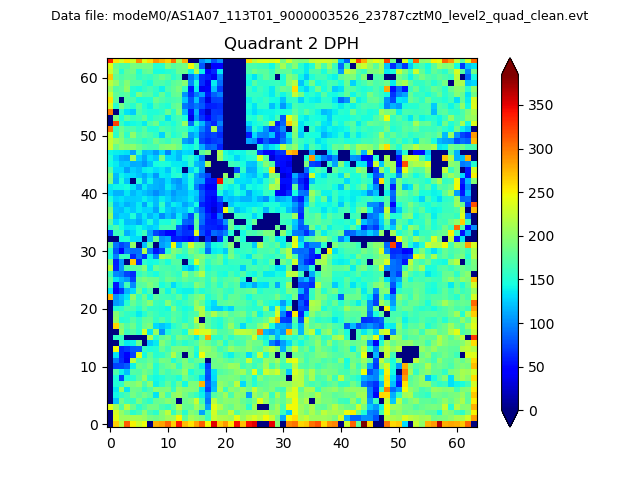 |
Quadrant C |
| Plot type | Count rate plots | Images |
|---|---|---|
| Comparison with Poisson distribution Blue bars denote a histogram of data divided into 1 sec bins. Red curve is a Poisson curve with rate = median count rate of data. |
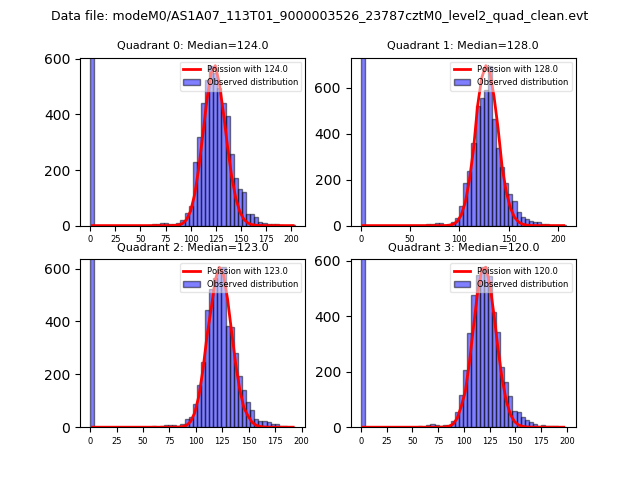 |
 |
| Quadrant-wise count rates Data is divided into 100 sec bins |
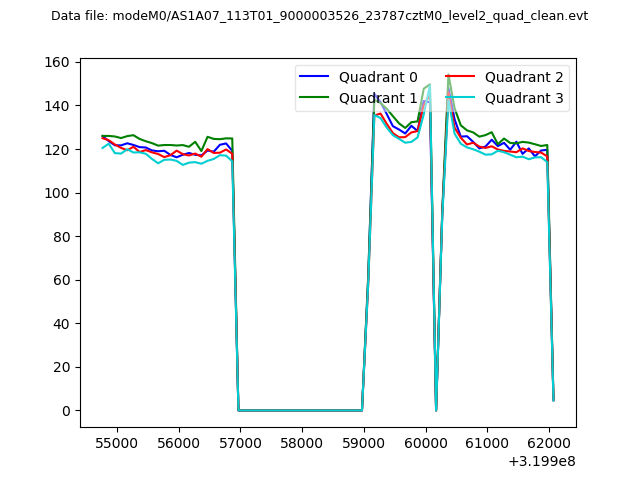 |
|
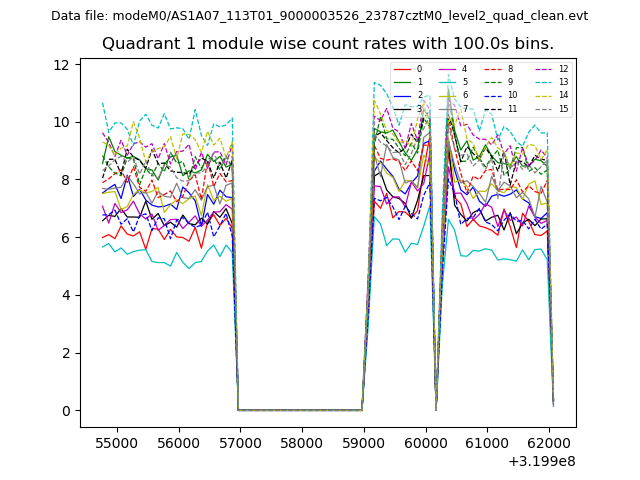
| Module-wise count rates for Quadrant A Data is divided into 100 sec bins |
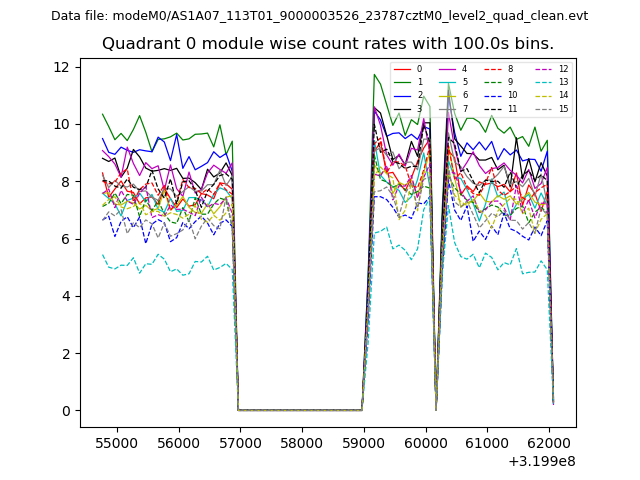 |
 |
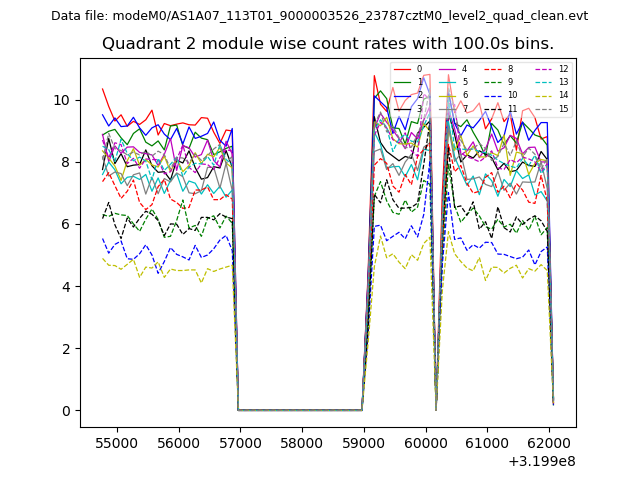
| Module-wise count rates for Quadrant B Data is divided into 100 sec bins |
 |
 |
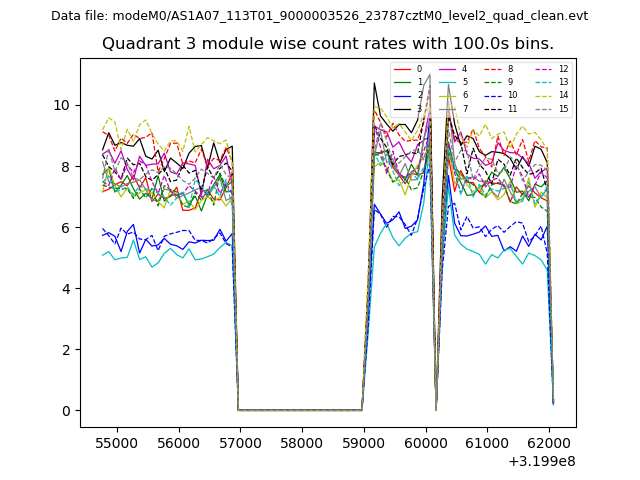
| Module-wise count rates for Quadrant C Data is divided into 100 sec bins |
 |
 |
| Module-wise count rates for Quadrant D Data is divided into 100 sec bins |
 |
 |
| Parameter | Plot |
|---|---|
| CZT HV Monitor | 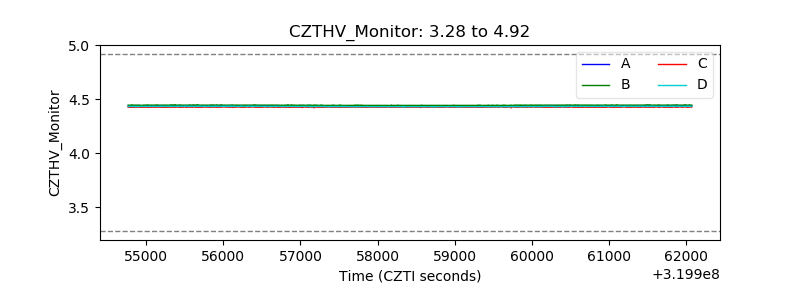 |
| D_VDD | 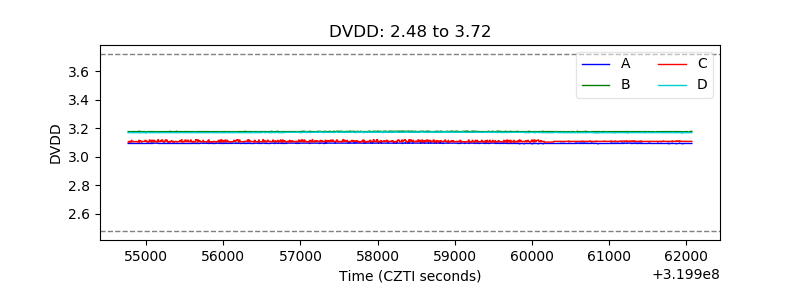 |
| Temperature 1 | 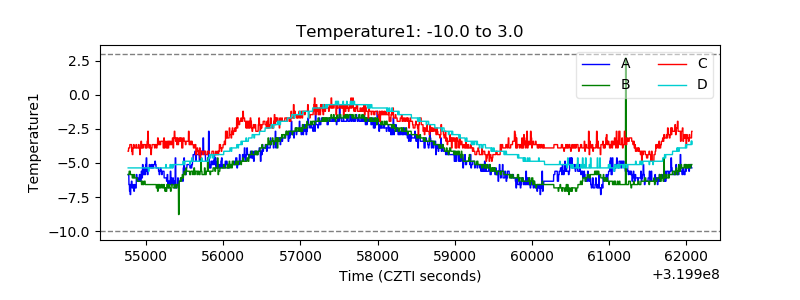 |
| Veto HV Monitor | 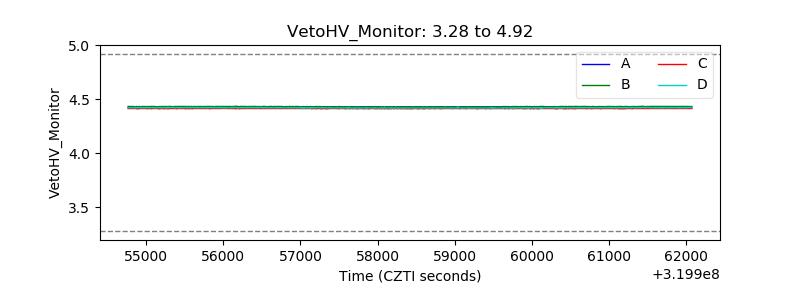 |
| Veto LLD | 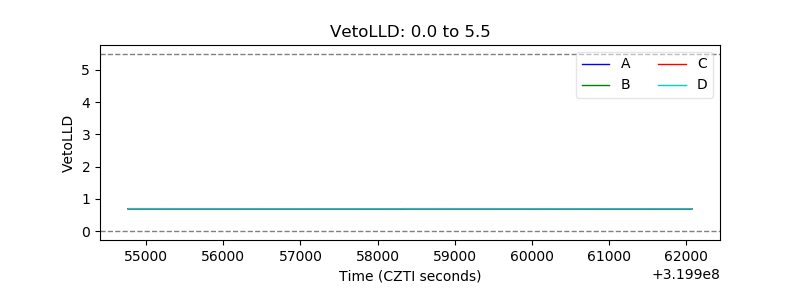 |
| Alpha Counter | 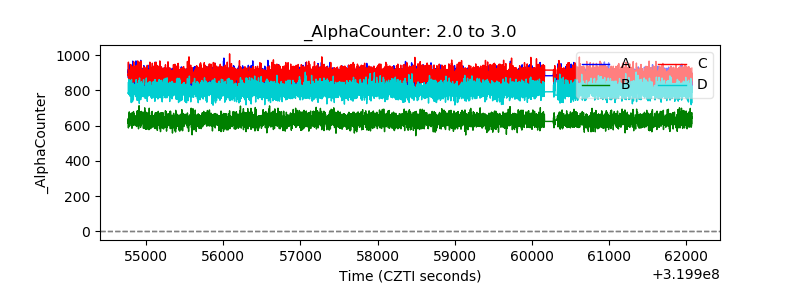 |
| _CPM_Rate | 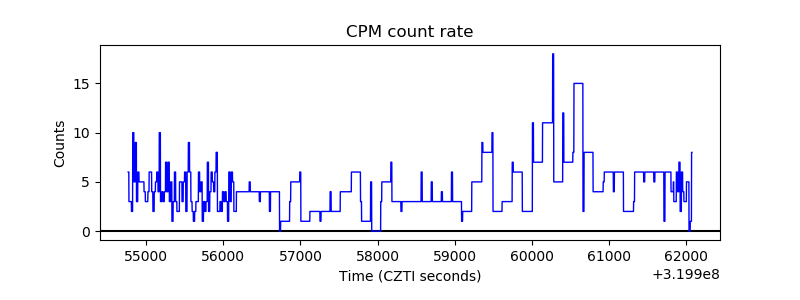 |
| CZT Counter | 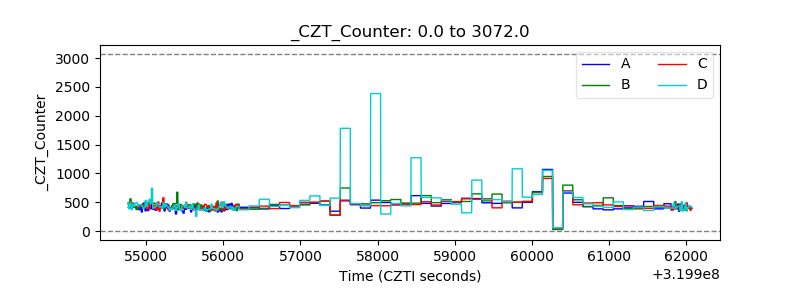 |
| +2.5 Volts monitor |  |
| +5 Volts monitor |  |
| _ROLL_ROT | 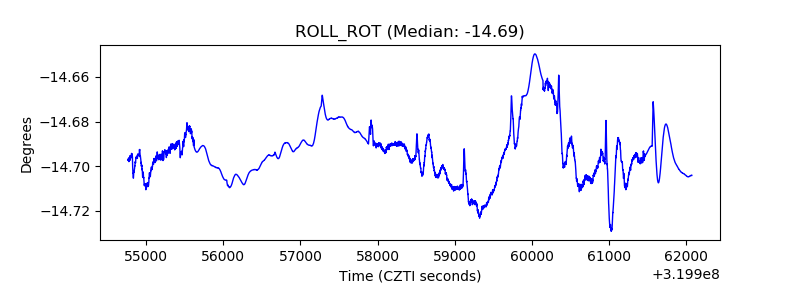 |
| _Roll_DEC | 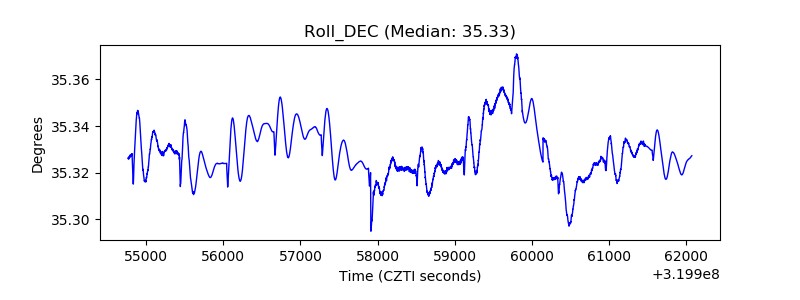 |
| _Roll_RA | 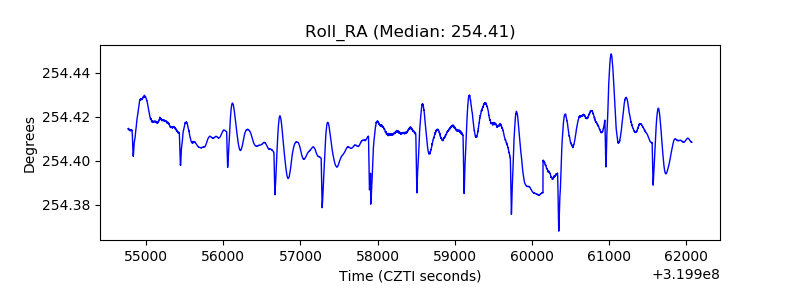 |
| Veto Counter | 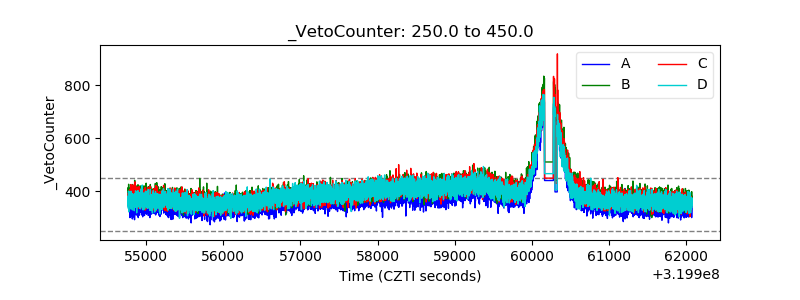 |