| Param | Original file | Final file |
|---|---|---|
| Filename | modeM0/AS1A07_113T01_9000003526_23788cztM0_level2.evt | modeM0/AS1A07_113T01_9000003526_23788cztM0_level2_quad_clean.evt |
| Size (bytes) | 414,794,880 | 57,945,600 |
| Size | 395.6 MB | 55.3 MB |
| Events in quadrant A | 2,280,445 | 355,216 |
| Events in quadrant B | 2,433,985 | 364,249 |
| Events in quadrant C | 2,327,682 | 350,468 |
| Events in quadrant D | 5,178,762 | 332,532 |
| Mode SS | |||
|---|---|---|---|
| Quadrant | BADHDUFLAG | Total packets | Discarded packets |
| A | 0 | 100 | 0 |
| B | 0 | 100 | 0 |
| C | 0 | 100 | 0 |
| D | 0 | 100 | 0 |
| Mode M0 | |||
|---|---|---|---|
| Quadrant | BADHDUFLAG | Total packets | Discarded packets |
| A | 0 | 10075 | 0 |
| B | 0 | 10395 | 0 |
| C | 0 | 10120 | 0 |
| D | 0 | 18957 | 0 |
| Quadrant | Total seconds | Saturated seconds | Saturation percentage |
|---|---|---|---|
| A | 5017 | 4 | 0.079729% |
| B | 5018 | 17 | 0.338780% |
| C | 5018 | 31 | 0.617776% |
| D | 5018 | 777 | 15.484257% |
Noise dominated data is calculated using 1-second bins in cleaned event files. If a bin has >2000 counts, and if more than 50% of those come from <1% of pixels, then it is considered to be noise-dominated and hence unusable.
| Quadrant | # 1 sec bins | Bins with >0 counts | Bins with >2000 counts | High rate bins dominated by noise | Noise dominated (total time) | Noise dominated (detector-on time) | Marked lightcurve |
|---|---|---|---|---|---|---|---|
| A | 5017 | 5017 | 0 | 0 | 0.00% | 0.00% | 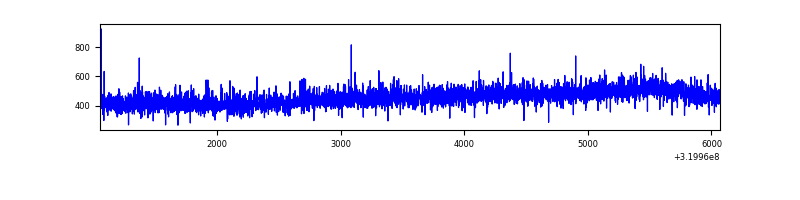 |
| B | 5018 | 5018 | 4 | 4 | 0.08% | 0.08% | 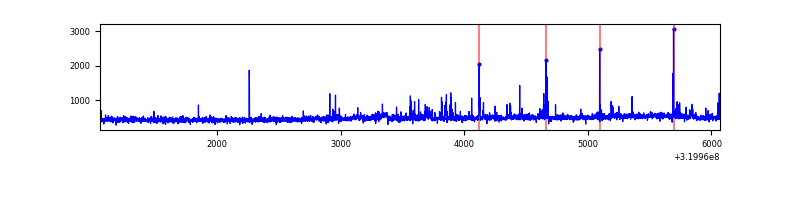 |
| C | 5018 | 5018 | 0 | 0 | 0.00% | 0.00% | 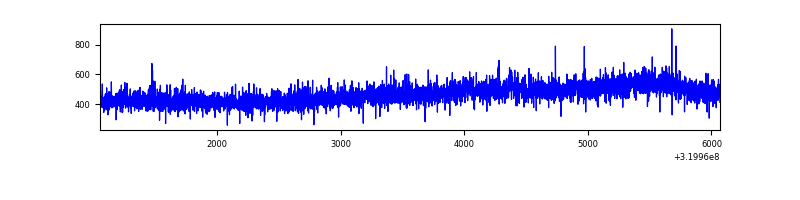 |
| D | 5018 | 5018 | 668 | 668 | 13.31% | 13.31% | 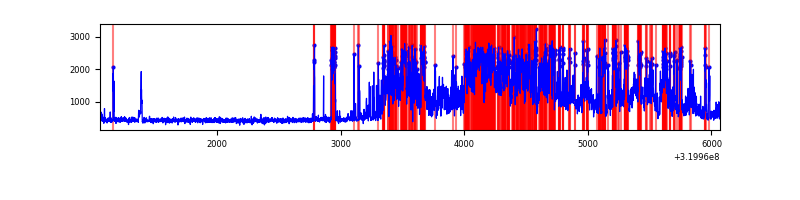 |
Top three noisy pixels from each quadrant. If the there are fewer than three noisy pixels in the level2.evt file, extra rows are filled as -1
| Pixel properties | Quadrant properties | ||||||
|---|---|---|---|---|---|---|---|
| Quadrant | DetID | PixID | Counts | Sigma | Mean | Median | Sigma |
| A | 13 | 254 | 8702 | 66.9 | 591 | 579 | 121.4 |
| A | 3 | 137 | 5347 | 39.27 | 591 | 579 | 121.4 |
| A | 0 | 226 | 4964 | 36.12 | 591 | 579 | 121.4 |
| B | 3 | 64 | 69046 | 592.36 | 591 | 576 | 115.6 |
| B | 0 | 189 | 16228 | 135.41 | 591 | 576 | 115.6 |
| B | 12 | 111 | 13759 | 114.05 | 591 | 576 | 115.6 |
| C | 14 | 238 | 90363 | 668.45 | 568 | 572 | 134.3 |
| C | 7 | 247 | 16120 | 115.75 | 568 | 572 | 134.3 |
| C | 10 | 91 | 4916 | 32.34 | 568 | 572 | 134.3 |
| D | 8 | 195 | 2606871 | 19461.75 | 545 | 528 | 133.9 |
| D | 1 | 52 | 304718 | 2271.41 | 545 | 528 | 133.9 |
| D | 9 | 35 | 58014 | 429.25 | 545 | 528 | 133.9 |
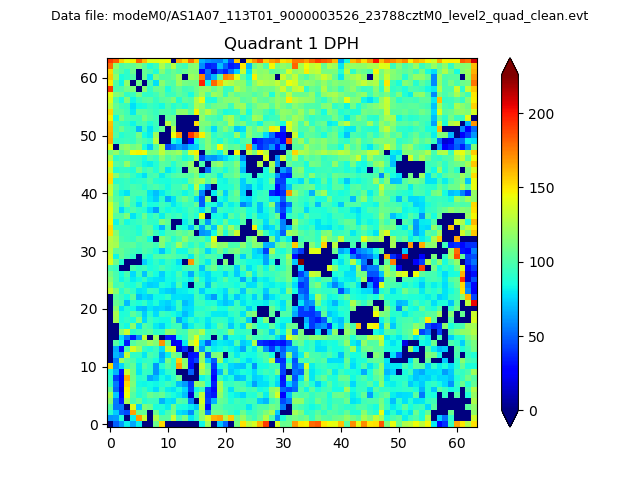
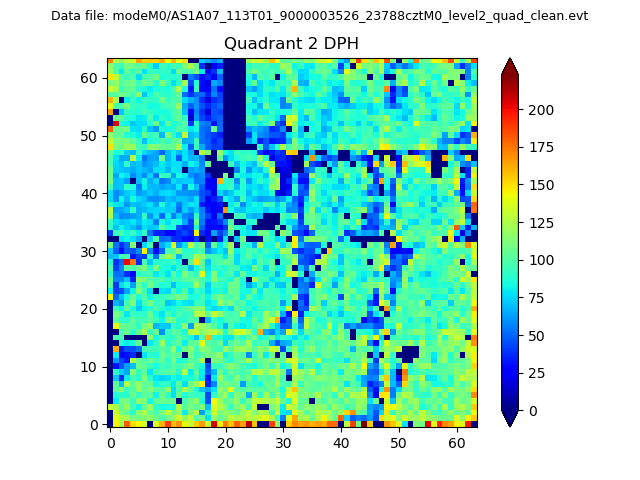
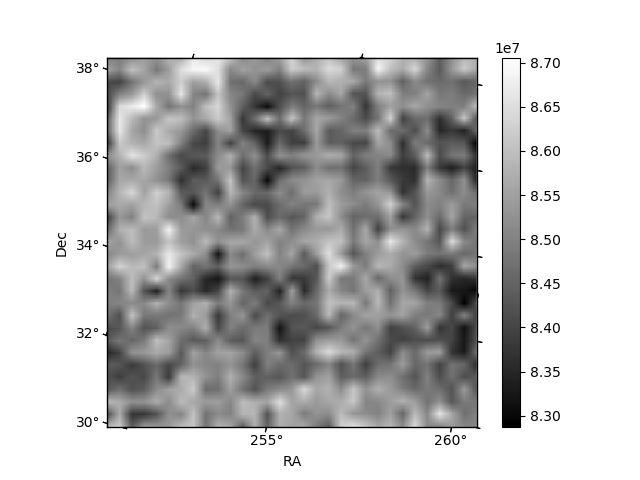
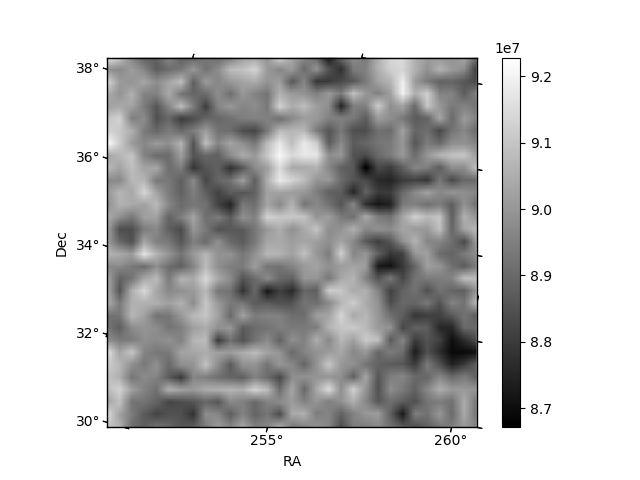
Histogram calculated using DETX and DETY for each event in the final _common_clean file
| Quadrant A |  |
 |
Quadrant B |
|---|---|---|---|
| Quadrant D |  |
 |
Quadrant C |
| Plot type | Count rate plots | Images |
|---|---|---|
| Comparison with Poisson distribution Blue bars denote a histogram of data divided into 1 sec bins. Red curve is a Poisson curve with rate = median count rate of data. |
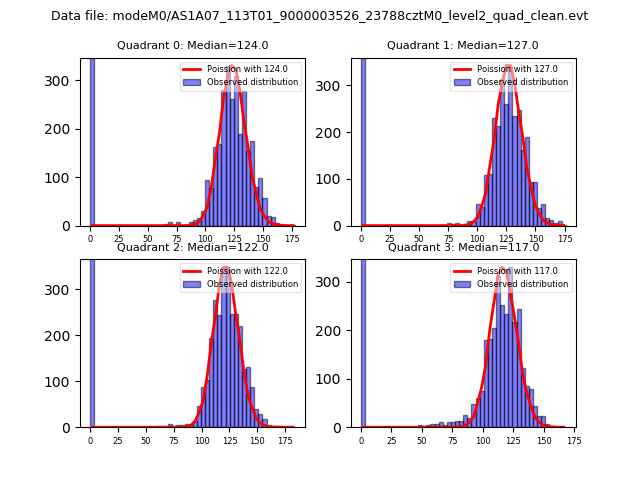 |
 |
| Quadrant-wise count rates Data is divided into 100 sec bins |
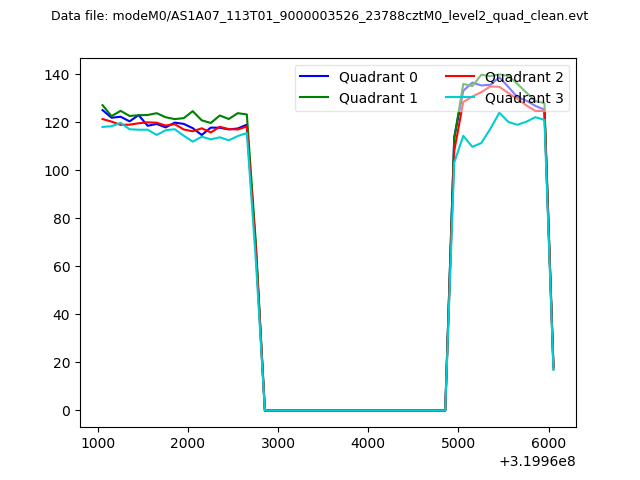 |
|
| Module-wise count rates for Quadrant A Data is divided into 100 sec bins |
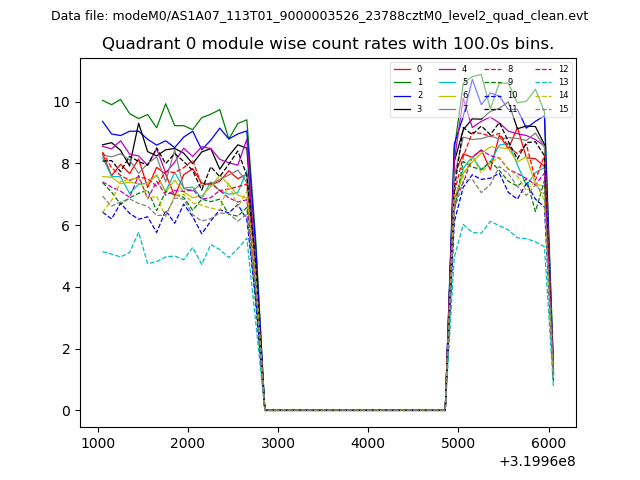 |
 |
| Module-wise count rates for Quadrant B Data is divided into 100 sec bins |
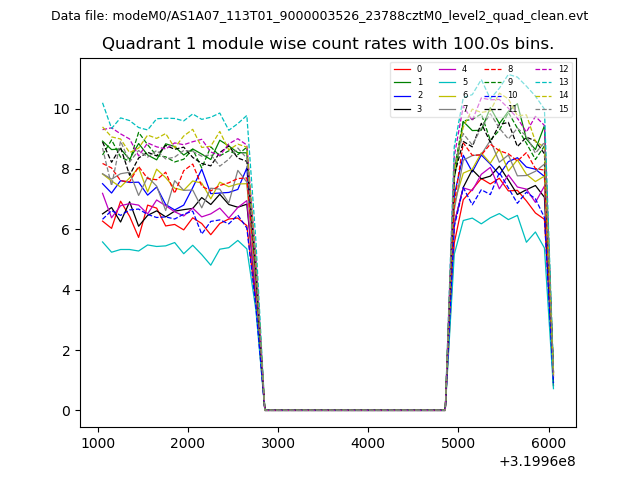 |
 |
| Module-wise count rates for Quadrant C Data is divided into 100 sec bins |
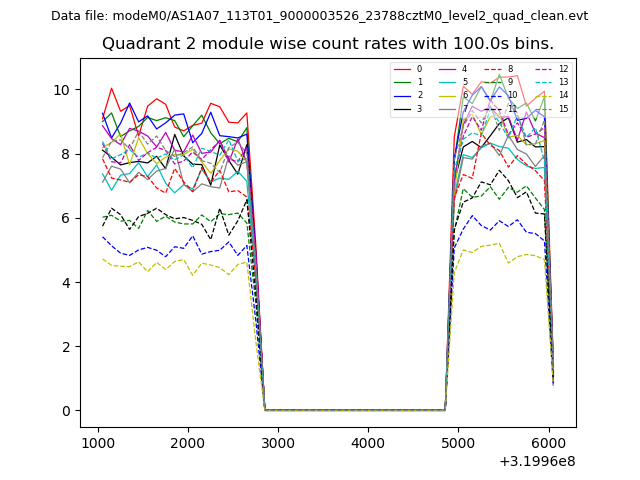 |
 |
| Module-wise count rates for Quadrant D Data is divided into 100 sec bins |
 |
 |
| Parameter | Plot |
|---|---|
| CZT HV Monitor |  |
| D_VDD | 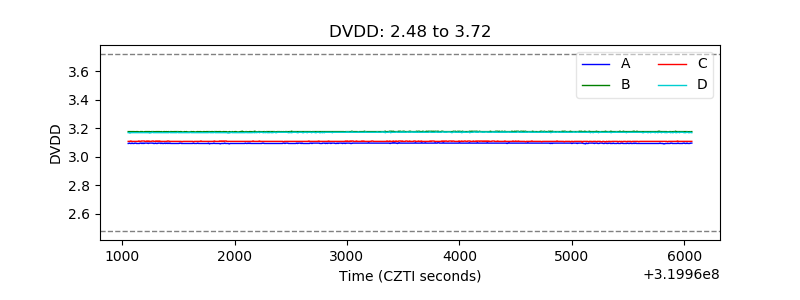 |
| Temperature 1 | 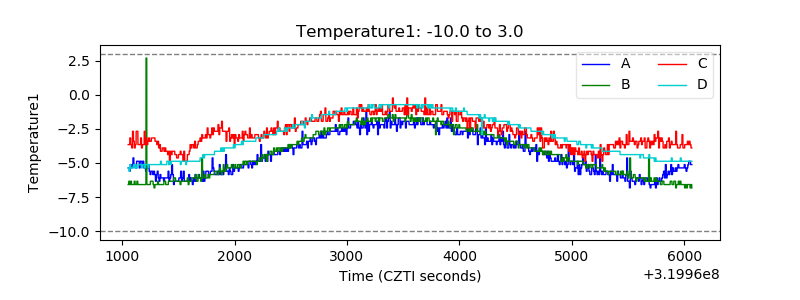 |
| Veto HV Monitor | 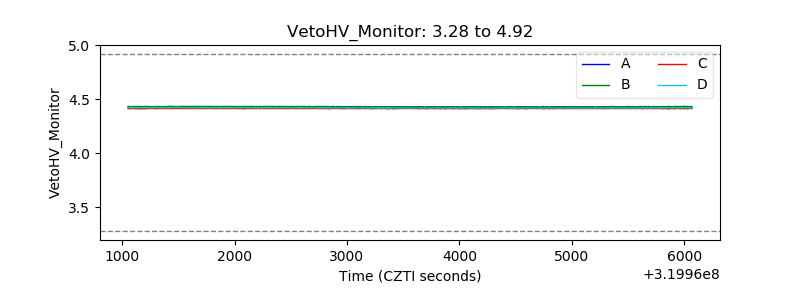 |
| Veto LLD | 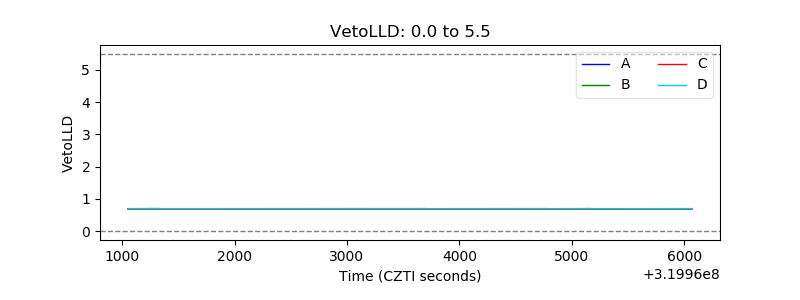 |
| Alpha Counter | 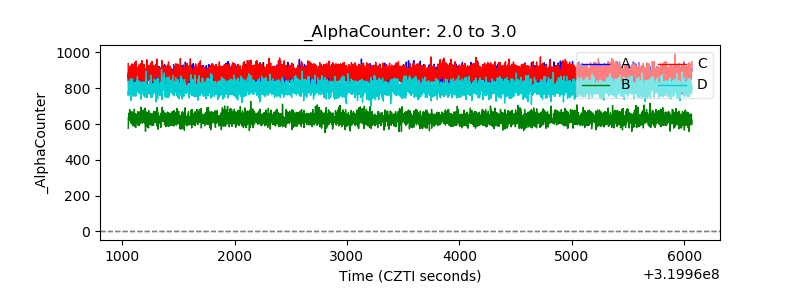 |
| _CPM_Rate | 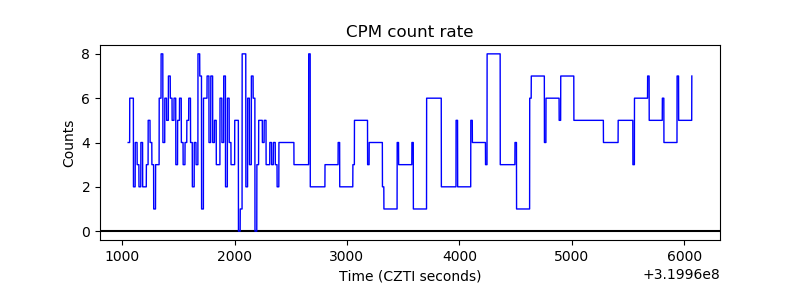 |
| CZT Counter | 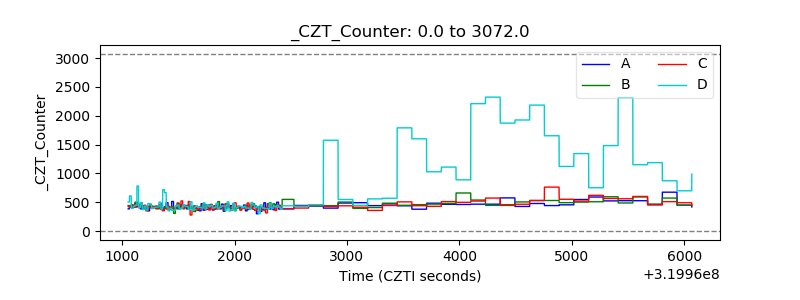 |
| +2.5 Volts monitor |  |
| +5 Volts monitor |  |
| _ROLL_ROT |  |
| _Roll_DEC | 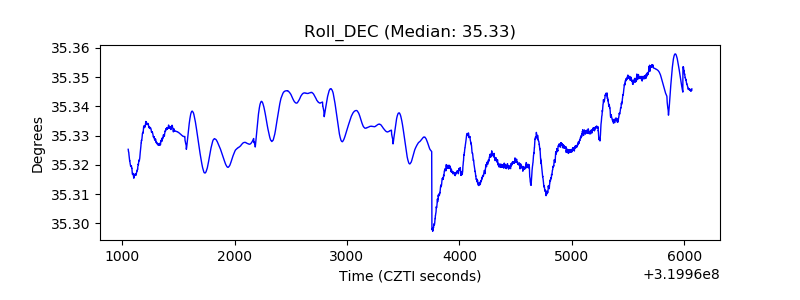 |
| _Roll_RA | 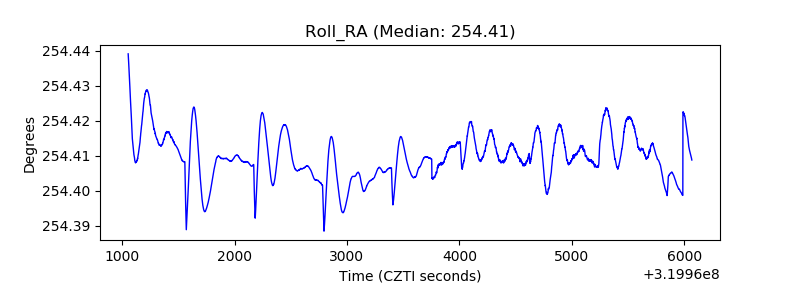 |
| Veto Counter | 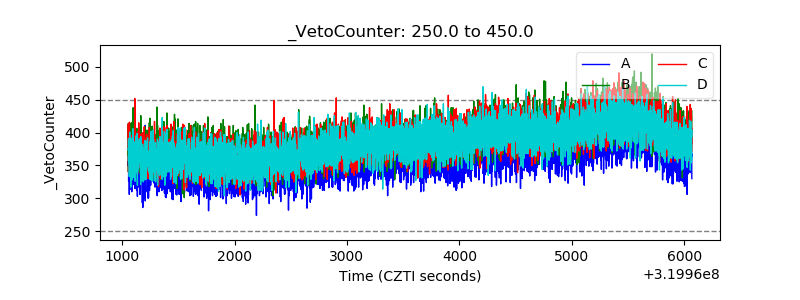 |