| Param | Original file | Final file |
|---|---|---|
| Filename | modeM0/AS1A07_113T01_9000003526_23790cztM0_level2.evt | modeM0/AS1A07_113T01_9000003526_23790cztM0_level2_quad_clean.evt |
| Size (bytes) | 1,246,435,200 | 189,434,880 |
| Size | 1.2 GB | 180.7 MB |
| Events in quadrant A | 6,755,349 | 1,203,660 |
| Events in quadrant B | 8,205,219 | 1,226,810 |
| Events in quadrant C | 6,859,474 | 1,190,783 |
| Events in quadrant D | 14,960,575 | 1,125,247 |
| Mode M9 | |||
|---|---|---|---|
| Quadrant | BADHDUFLAG | Total packets | Discarded packets |
| A | 0 | 17 | 0 |
| B | 0 | 17 | 0 |
| C | 0 | 17 | 0 |
| D | 0 | 17 | 0 |
| Mode SS | |||
|---|---|---|---|
| Quadrant | BADHDUFLAG | Total packets | Discarded packets |
| A | 0 | 294 | 0 |
| B | 0 | 294 | 0 |
| C | 0 | 294 | 0 |
| D | 0 | 294 | 0 |
| Mode M0 | |||
|---|---|---|---|
| Quadrant | BADHDUFLAG | Total packets | Discarded packets |
| A | 0 | 29221 | 3 |
| B | 0 | 33255 | 3 |
| C | 0 | 29283 | 3 |
| D | 0 | 54594 | 3 |
| Quadrant | Total seconds | Saturated seconds | Saturation percentage |
|---|---|---|---|
| A | 14343 | 189 | 1.317716% |
| B | 14344 | 494 | 3.443949% |
| C | 14344 | 242 | 1.687117% |
| D | 14344 | 1324 | 9.230340% |
Noise dominated data is calculated using 1-second bins in cleaned event files. If a bin has >2000 counts, and if more than 50% of those come from <1% of pixels, then it is considered to be noise-dominated and hence unusable.
| Quadrant | # 1 sec bins | Bins with >0 counts | Bins with >2000 counts | High rate bins dominated by noise | Noise dominated (total time) | Noise dominated (detector-on time) | Marked lightcurve |
|---|---|---|---|---|---|---|---|
| A | 16043 | 14343 | 0 | 0 | 0.00% | 0.00% | 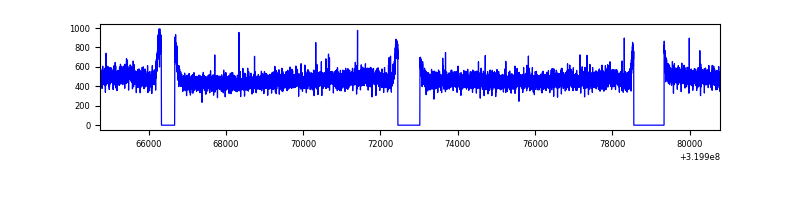 |
| B | 16044 | 14344 | 216 | 216 | 1.35% | 1.51% | 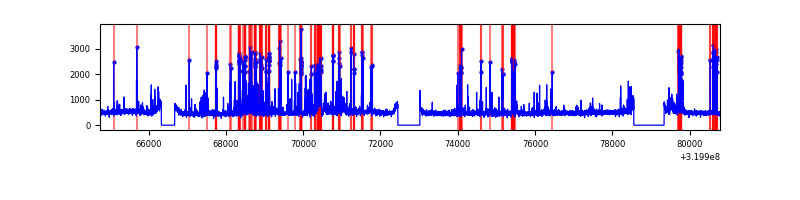 |
| C | 16044 | 14344 | 1 | 1 | 0.01% | 0.01% | 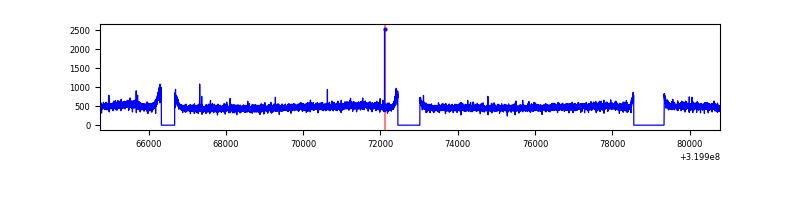 |
| D | 16044 | 14344 | 1074 | 1074 | 6.69% | 7.49% | 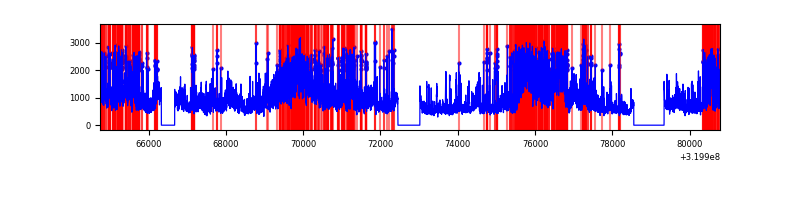 |
Top three noisy pixels from each quadrant. If the there are fewer than three noisy pixels in the level2.evt file, extra rows are filled as -1
| Pixel properties | Quadrant properties | ||||||
|---|---|---|---|---|---|---|---|
| Quadrant | DetID | PixID | Counts | Sigma | Mean | Median | Sigma |
| A | 13 | 254 | 24966 | 65.77 | 1752 | 1712 | 353.6 |
| A | 3 | 137 | 15781 | 39.79 | 1752 | 1712 | 353.6 |
| A | 0 | 226 | 15068 | 37.77 | 1752 | 1712 | 353.6 |
| B | 3 | 64 | 1299445 | 3883.62 | 1736 | 1691 | 334.2 |
| B | 4 | 216 | 54087 | 156.8 | 1736 | 1691 | 334.2 |
| B | 12 | 111 | 40924 | 117.41 | 1736 | 1691 | 334.2 |
| C | 14 | 238 | 266284 | 669.13 | 1681 | 1686 | 395.4 |
| C | 7 | 247 | 31009 | 74.15 | 1681 | 1686 | 395.4 |
| C | 13 | 61 | 11763 | 25.48 | 1681 | 1686 | 395.4 |
| D | 8 | 195 | 6444247 | 15850.48 | 1665 | 1615 | 406.5 |
| D | 1 | 52 | 1323037 | 3251.03 | 1665 | 1615 | 406.5 |
| D | 13 | 174 | 336419 | 823.7 | 1665 | 1615 | 406.5 |
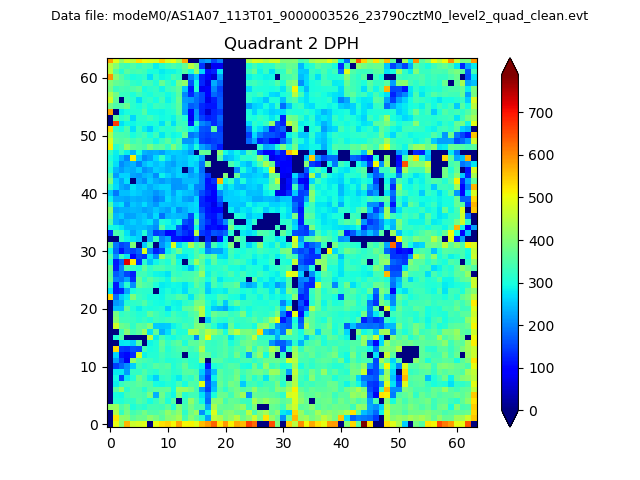
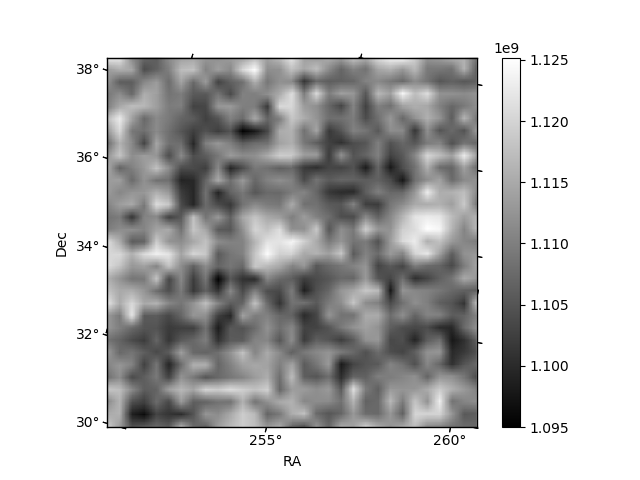
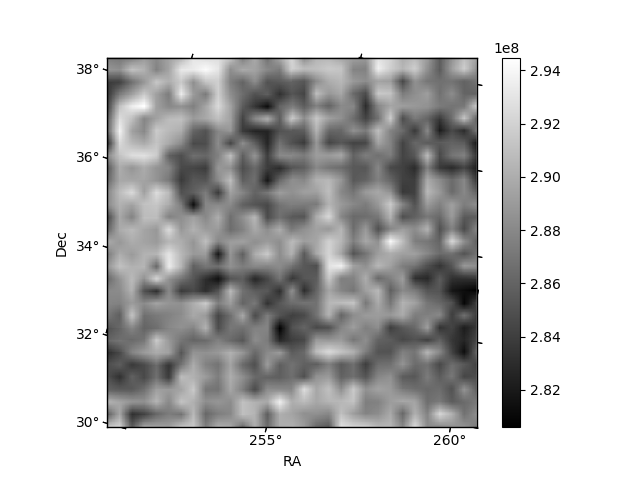
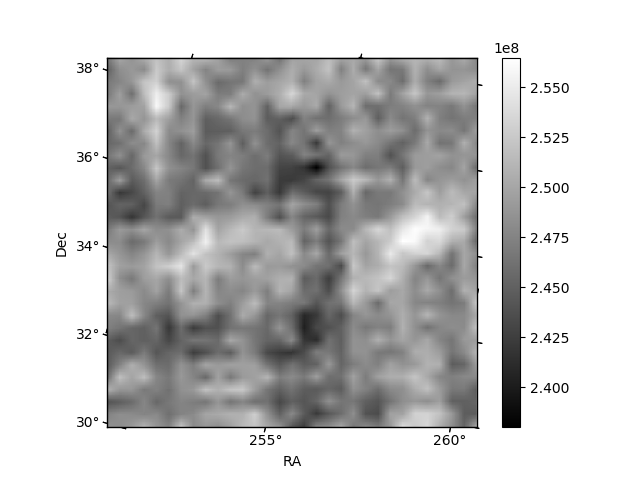
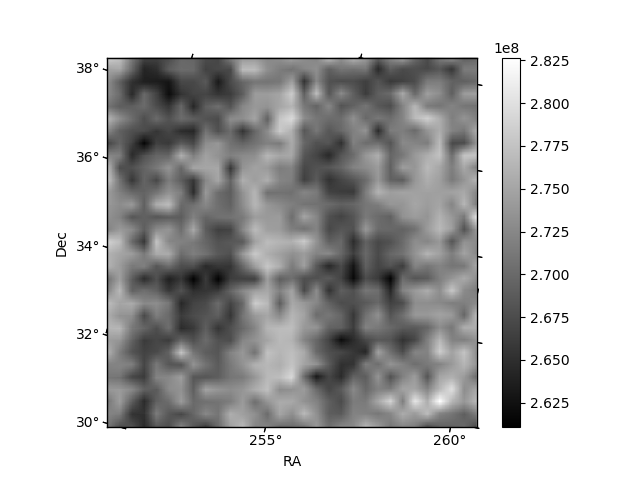
Histogram calculated using DETX and DETY for each event in the final _common_clean file
| Quadrant A | 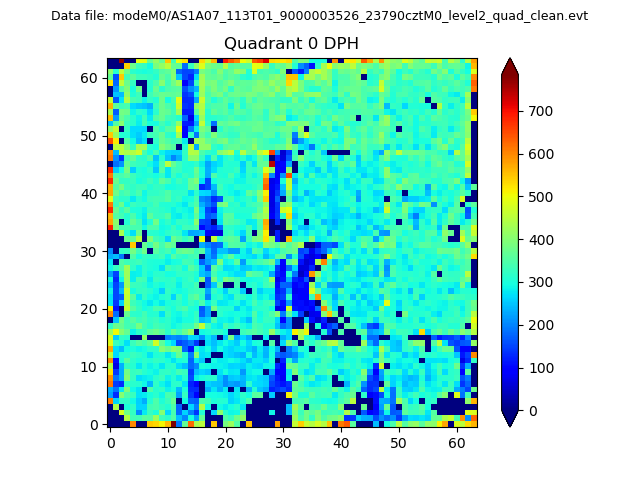 |
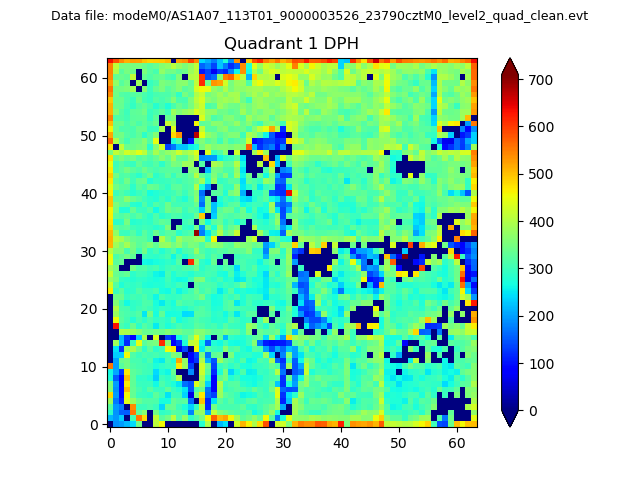 |
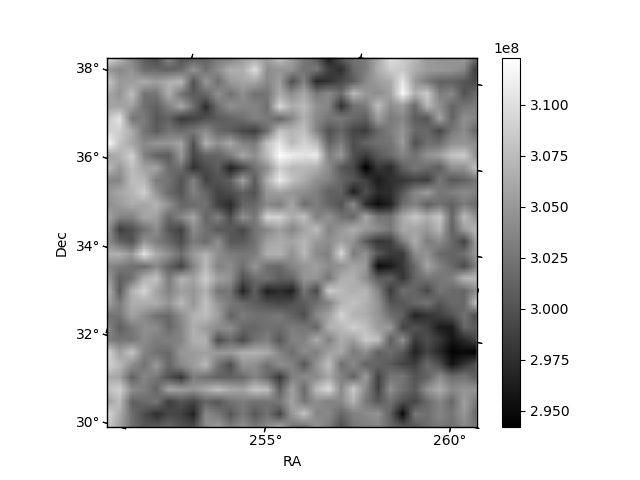
Quadrant B |
|---|---|---|---|
| Quadrant D | 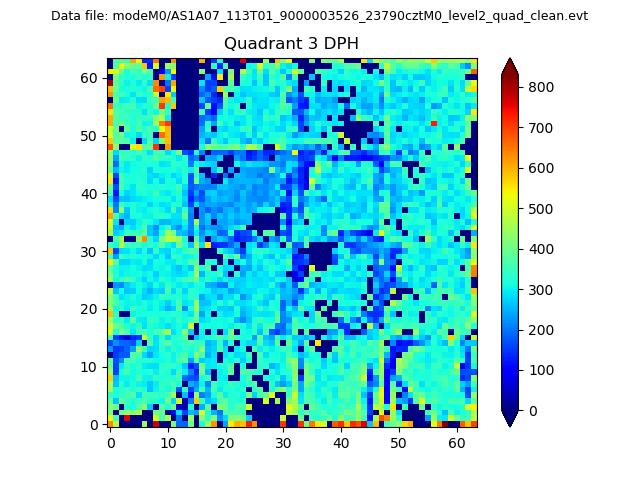 |
 |
Quadrant C |
| Plot type | Count rate plots | Images |
|---|---|---|
| Comparison with Poisson distribution Blue bars denote a histogram of data divided into 1 sec bins. Red curve is a Poisson curve with rate = median count rate of data. |
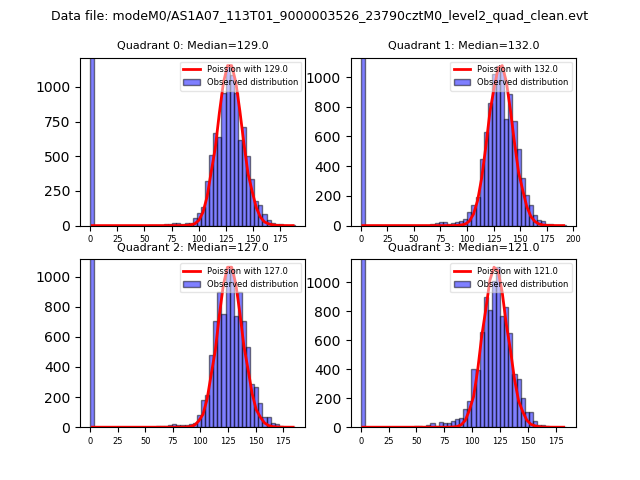 |
 |
| Quadrant-wise count rates Data is divided into 100 sec bins |
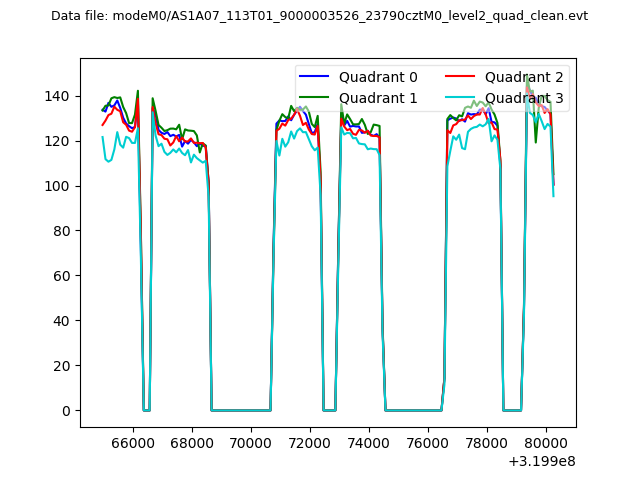 |
|
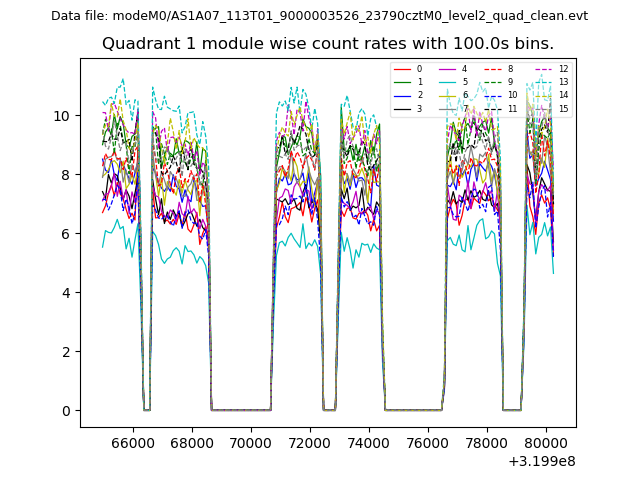
| Module-wise count rates for Quadrant A Data is divided into 100 sec bins |
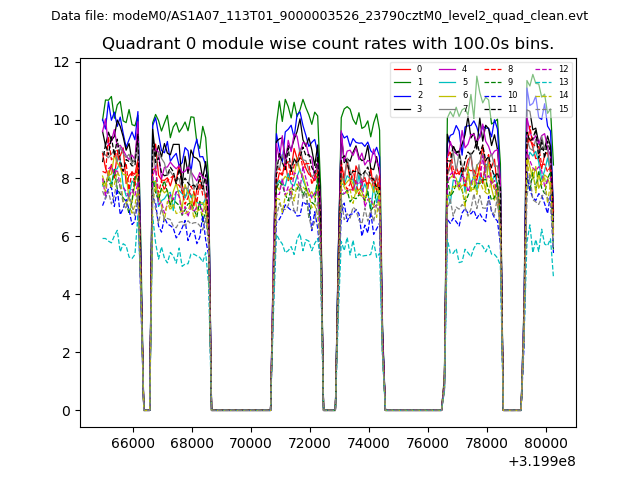 |
 |
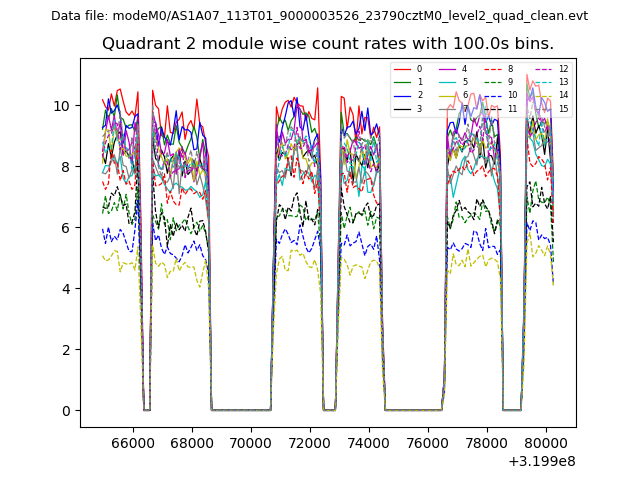
| Module-wise count rates for Quadrant B Data is divided into 100 sec bins |
 |
 |
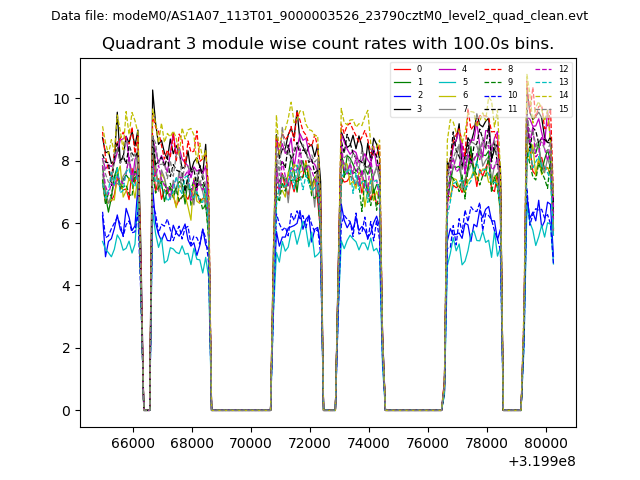
| Module-wise count rates for Quadrant C Data is divided into 100 sec bins |
 |
 |
| Module-wise count rates for Quadrant D Data is divided into 100 sec bins |
 |
 |
| Parameter | Plot |
|---|---|
| CZT HV Monitor | 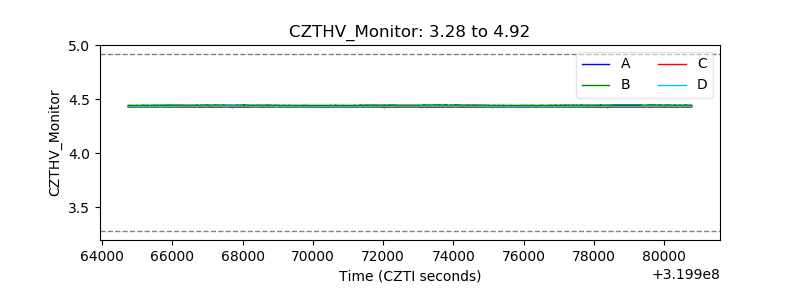 |
| D_VDD | 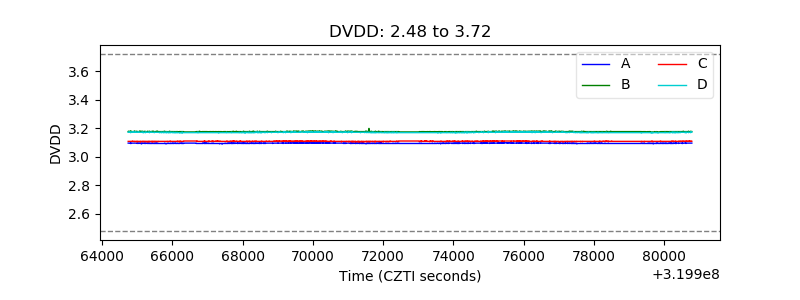 |
| Temperature 1 | 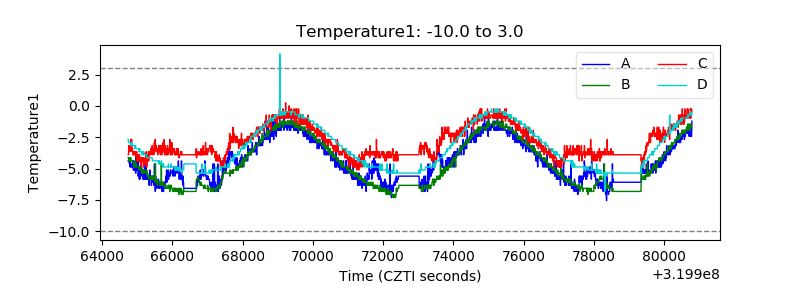 |
| Veto HV Monitor | 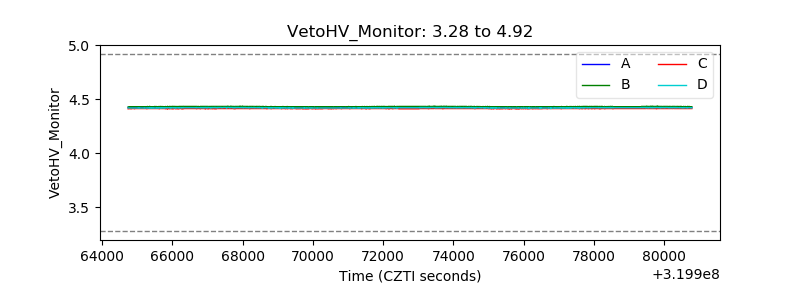 |
| Veto LLD | 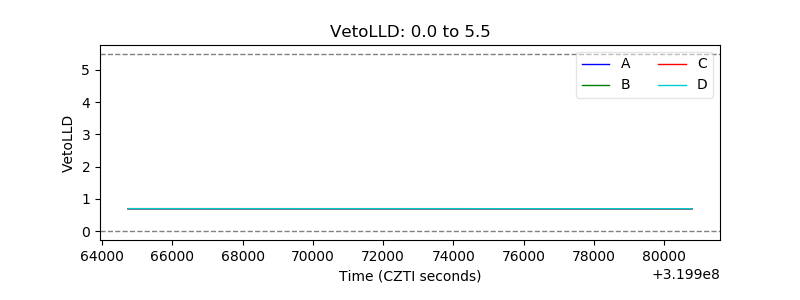 |
| Alpha Counter | 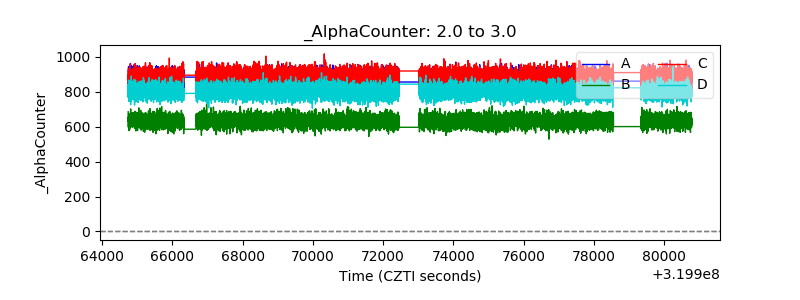 |
| _CPM_Rate | 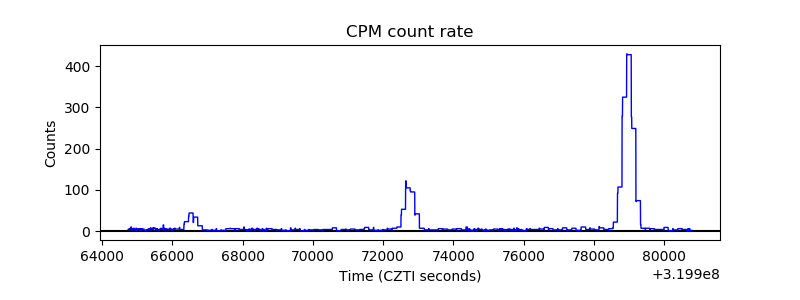 |
| CZT Counter | 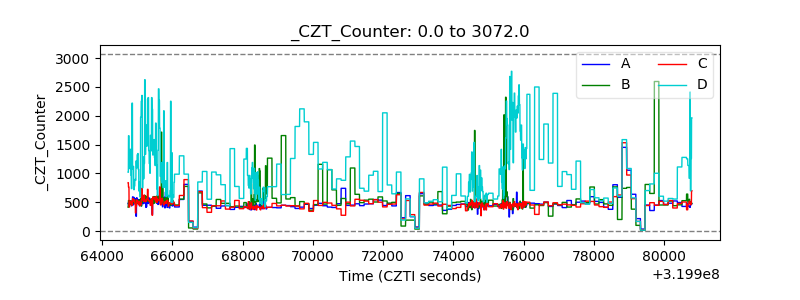 |
| +2.5 Volts monitor | 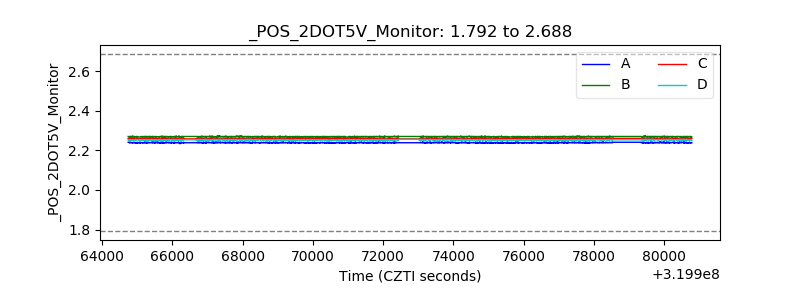 |
| +5 Volts monitor |  |
| _ROLL_ROT | 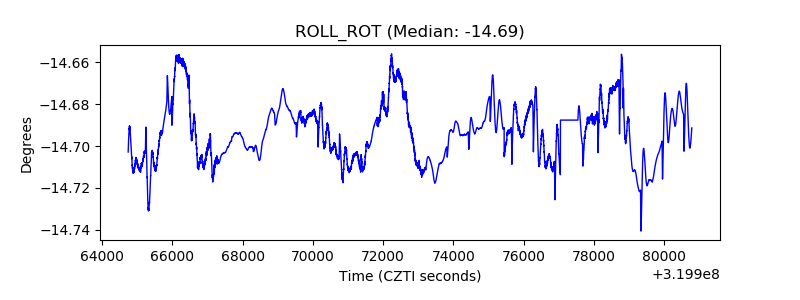 |
| _Roll_DEC | 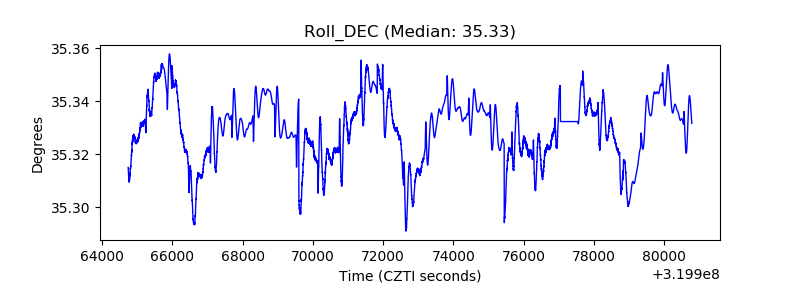 |
| _Roll_RA |  |
| Veto Counter | 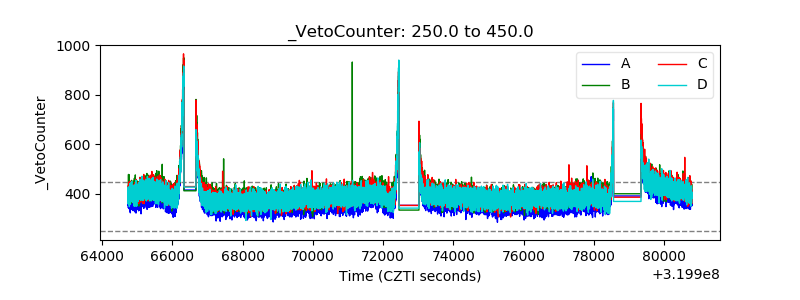 |