| Param | Original file | Final file |
|---|---|---|
| Filename | modeM0/AS1A07_113T01_9000003526_23791cztM0_level2.evt | modeM0/AS1A07_113T01_9000003526_23791cztM0_level2_quad_clean.evt |
| Size (bytes) | 541,903,680 | 78,684,480 |
| Size | 516.8 MB | 75.0 MB |
| Events in quadrant A | 3,169,912 | 486,809 |
| Events in quadrant B | 3,486,142 | 495,915 |
| Events in quadrant C | 3,210,645 | 481,120 |
| Events in quadrant D | 6,099,594 | 460,555 |
| Mode M9 | |||
|---|---|---|---|
| Quadrant | BADHDUFLAG | Total packets | Discarded packets |
| A | 0 | 9 | 0 |
| B | 0 | 9 | 0 |
| C | 0 | 9 | 0 |
| D | 0 | 9 | 0 |
| Mode SS | |||
|---|---|---|---|
| Quadrant | BADHDUFLAG | Total packets | Discarded packets |
| A | 0 | 134 | 0 |
| B | 0 | 134 | 0 |
| C | 0 | 134 | 0 |
| D | 0 | 134 | 0 |
| Mode M0 | |||
|---|---|---|---|
| Quadrant | BADHDUFLAG | Total packets | Discarded packets |
| A | 0 | 13497 | 1 |
| B | 0 | 14365 | 1 |
| C | 0 | 13495 | 1 |
| D | 0 | 22713 | 1 |
| Quadrant | Total seconds | Saturated seconds | Saturation percentage |
|---|---|---|---|
| A | 6567 | 65 | 0.989797% |
| B | 6568 | 134 | 2.040195% |
| C | 6567 | 85 | 1.294351% |
| D | 6567 | 434 | 6.608802% |
Noise dominated data is calculated using 1-second bins in cleaned event files. If a bin has >2000 counts, and if more than 50% of those come from <1% of pixels, then it is considered to be noise-dominated and hence unusable.
| Quadrant | # 1 sec bins | Bins with >0 counts | Bins with >2000 counts | High rate bins dominated by noise | Noise dominated (total time) | Noise dominated (detector-on time) | Marked lightcurve |
|---|---|---|---|---|---|---|---|
| A | 7507 | 6567 | 0 | 0 | 0.00% | 0.00% | 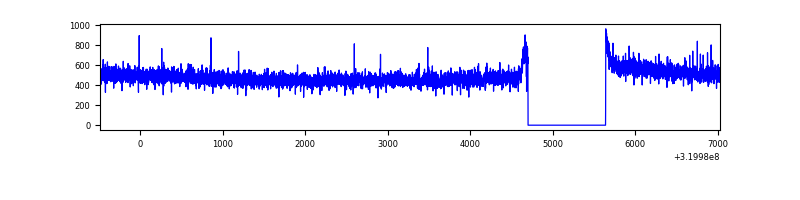 |
| B | 7508 | 6568 | 64 | 64 | 0.85% | 0.97% | 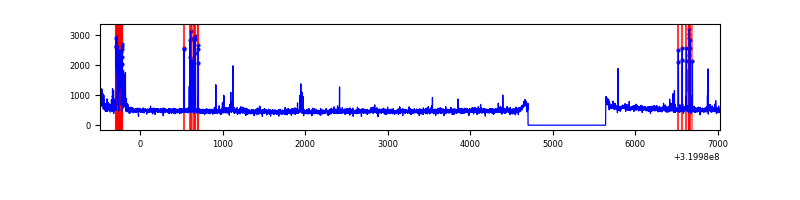 |
| C | 7507 | 6567 | 0 | 0 | 0.00% | 0.00% | 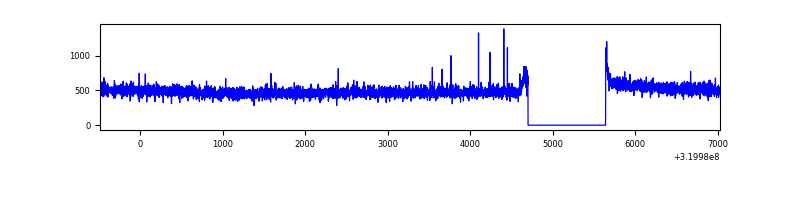 |
| D | 7507 | 6567 | 372 | 372 | 4.96% | 5.66% | 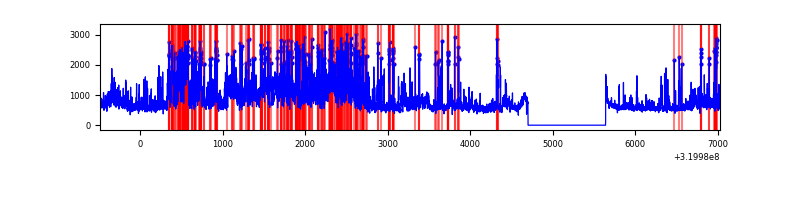 |
Top three noisy pixels from each quadrant. If the there are fewer than three noisy pixels in the level2.evt file, extra rows are filled as -1
| Pixel properties | Quadrant properties | ||||||
|---|---|---|---|---|---|---|---|
| Quadrant | DetID | PixID | Counts | Sigma | Mean | Median | Sigma |
| A | 13 | 254 | 11051 | 61.39 | 821 | 804 | 166.9 |
| A | 3 | 137 | 7101 | 37.73 | 821 | 804 | 166.9 |
| A | 0 | 226 | 6972 | 36.95 | 821 | 804 | 166.9 |
| B | 3 | 64 | 183810 | 1164.97 | 812 | 791 | 157.1 |
| B | 4 | 216 | 80711 | 508.72 | 812 | 791 | 157.1 |
| B | 12 | 111 | 18427 | 112.26 | 812 | 791 | 157.1 |
| C | 14 | 238 | 122112 | 654.18 | 786 | 792 | 185.5 |
| C | 3 | 233 | 12487 | 63.06 | 786 | 792 | 185.5 |
| C | 7 | 247 | 8360 | 40.81 | 786 | 792 | 185.5 |
| D | 8 | 195 | 2527991 | 13280.1 | 782 | 759 | 190.3 |
| D | 13 | 174 | 435901 | 2286.58 | 782 | 759 | 190.3 |
| D | 1 | 52 | 66207 | 343.92 | 782 | 759 | 190.3 |
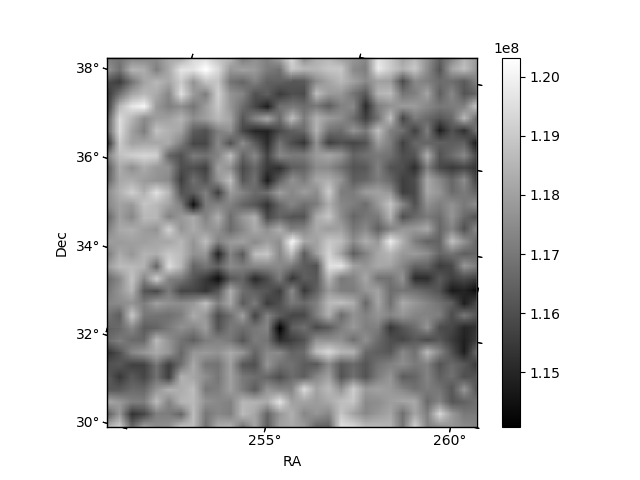
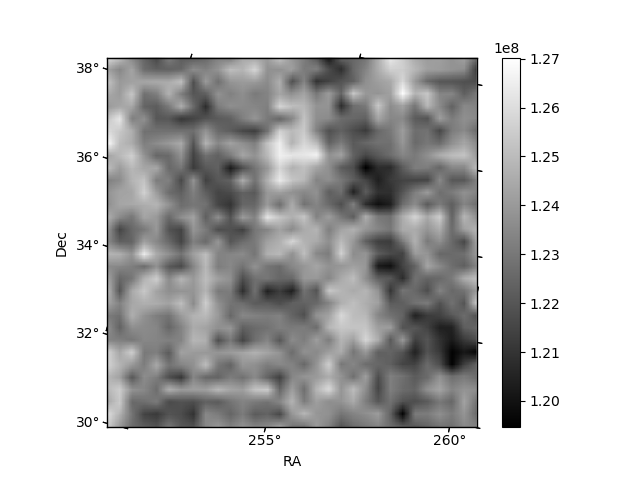
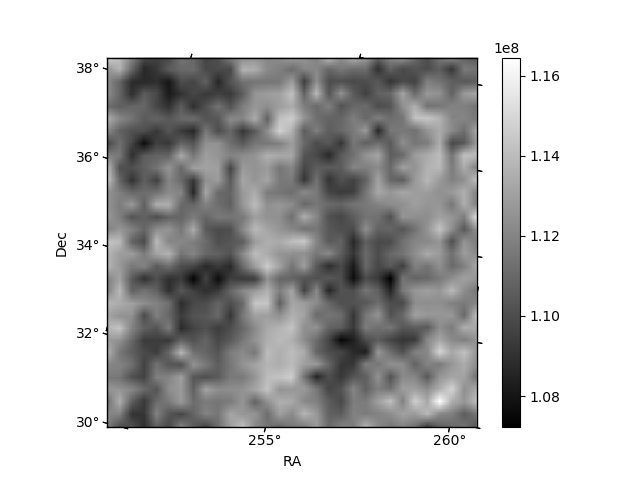
Histogram calculated using DETX and DETY for each event in the final _common_clean file
| Quadrant A | 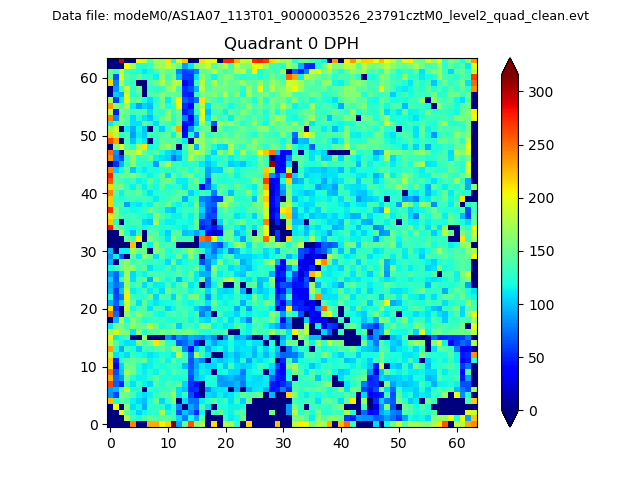 |
 |
Quadrant B |
|---|---|---|---|
| Quadrant D | 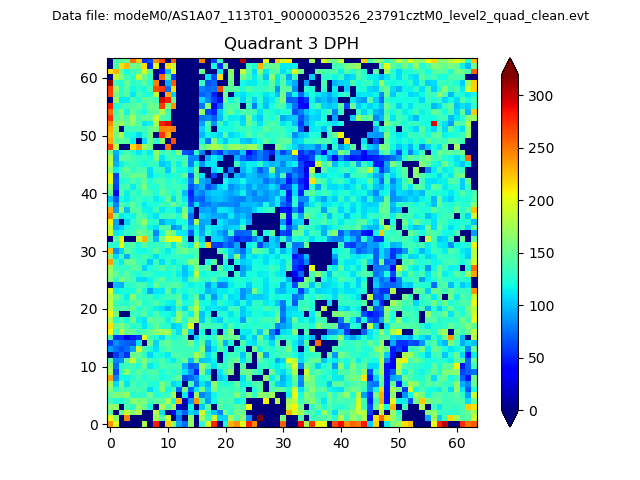 |
 |
Quadrant C |
| Plot type | Count rate plots | Images |
|---|---|---|
| Comparison with Poisson distribution Blue bars denote a histogram of data divided into 1 sec bins. Red curve is a Poisson curve with rate = median count rate of data. |
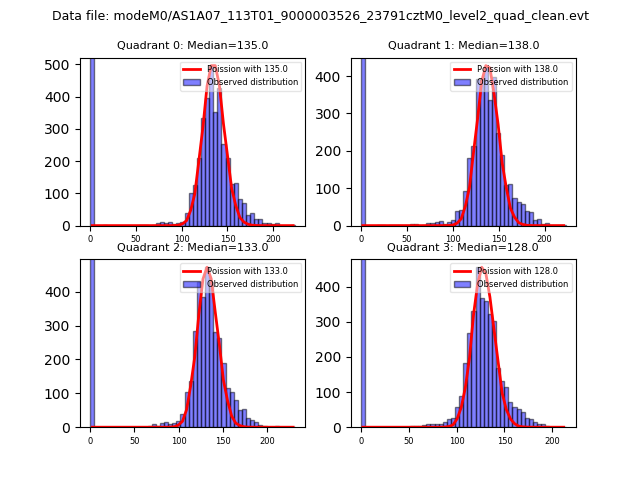 |
 |
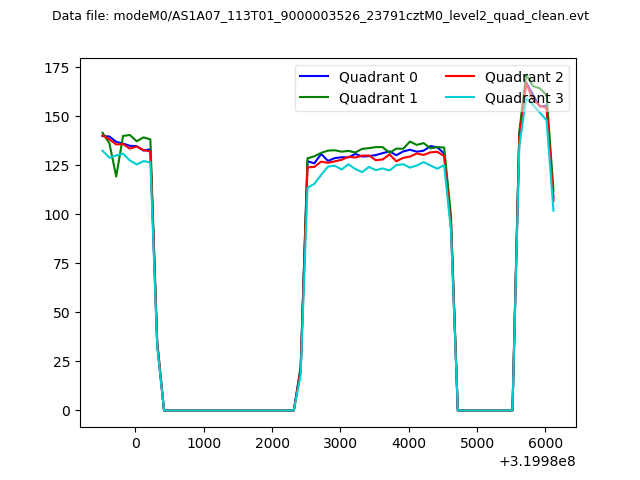
| Quadrant-wise count rates Data is divided into 100 sec bins |
 |
|
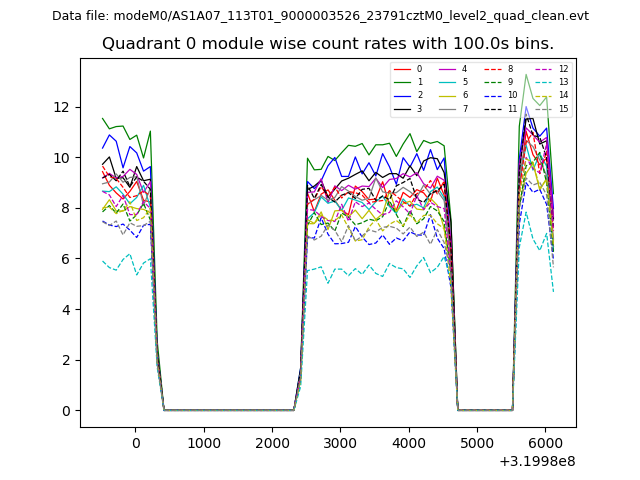
| Module-wise count rates for Quadrant A Data is divided into 100 sec bins |
 |
 |
| Module-wise count rates for Quadrant B Data is divided into 100 sec bins |
 |
 |
| Module-wise count rates for Quadrant C Data is divided into 100 sec bins |
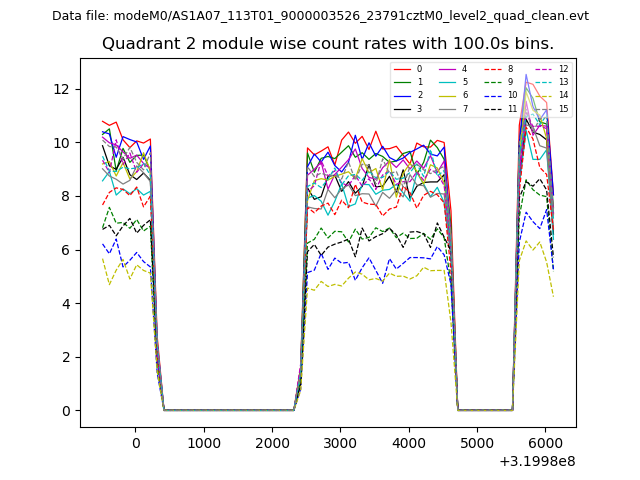 |
 |
| Module-wise count rates for Quadrant D Data is divided into 100 sec bins |
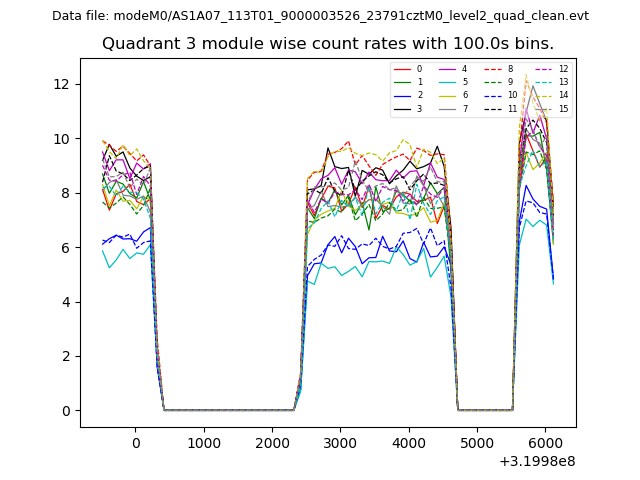 |
 |
| Parameter | Plot |
|---|---|
| CZT HV Monitor | 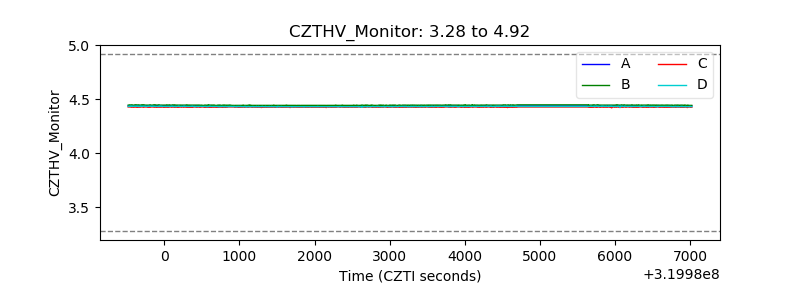 |
| D_VDD | 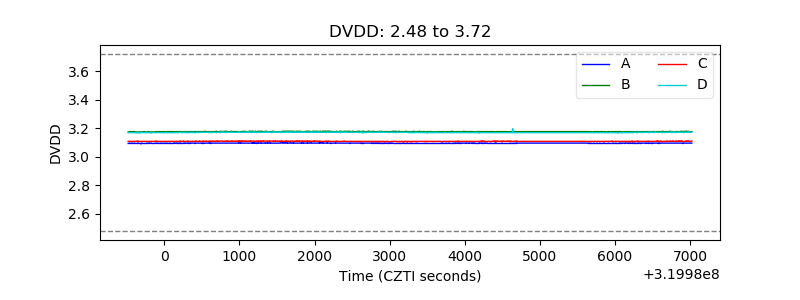 |
| Temperature 1 | 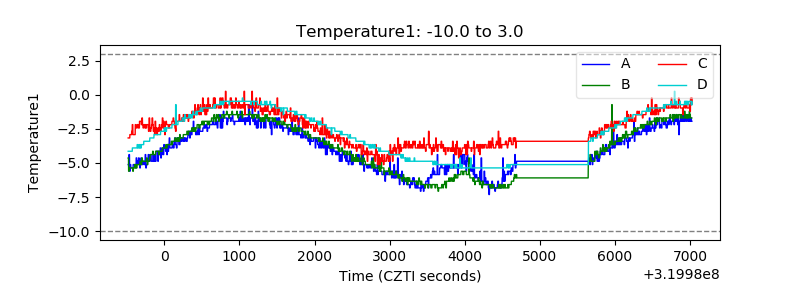 |
| Veto HV Monitor | 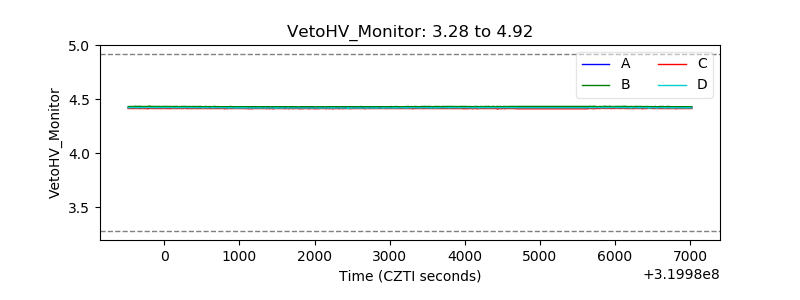 |
| Veto LLD |  |
| Alpha Counter |  |
| _CPM_Rate | 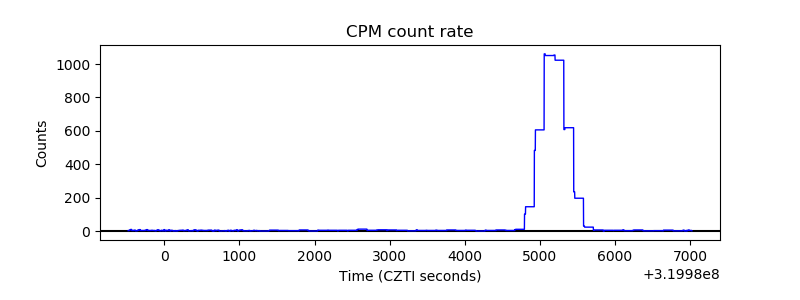 |
| CZT Counter |  |
| +2.5 Volts monitor | 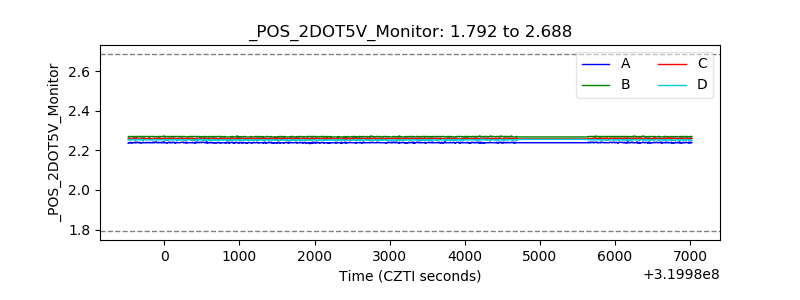 |
| +5 Volts monitor |  |
| _ROLL_ROT | 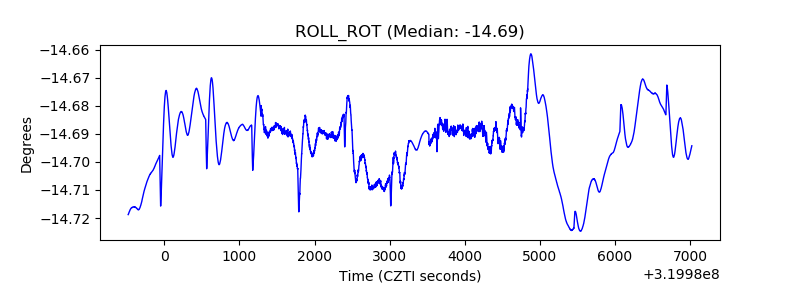 |
| _Roll_DEC | 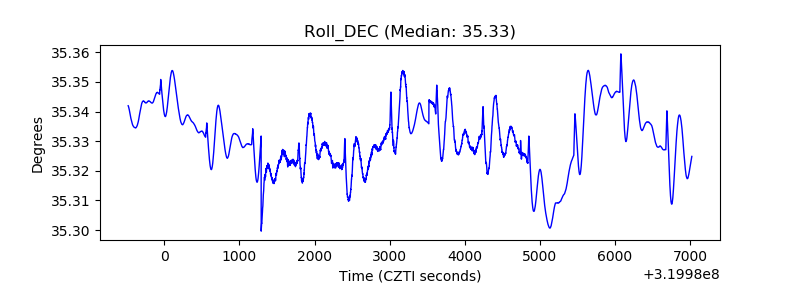 |
| _Roll_RA | 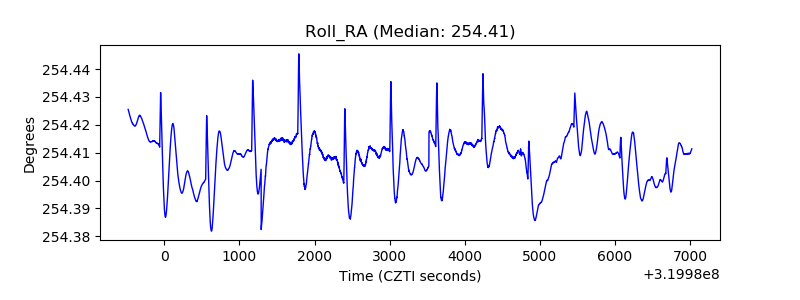 |
| Veto Counter | 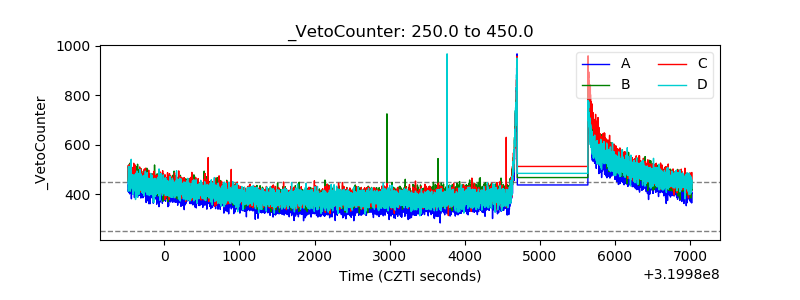 |