| Param | Original file | Final file |
|---|---|---|
| Filename | modeM0/AS1A07_113T01_9000003526_23794cztM0_level2.evt | modeM0/AS1A07_113T01_9000003526_23794cztM0_level2_quad_clean.evt |
| Size (bytes) | 601,928,640 | 64,419,840 |
| Size | 574.0 MB | 61.4 MB |
| Events in quadrant A | 3,238,311 | 387,047 |
| Events in quadrant B | 3,383,899 | 390,054 |
| Events in quadrant C | 3,305,037 | 381,798 |
| Events in quadrant D | 7,887,205 | 362,945 |
| Mode M9 | |||
|---|---|---|---|
| Quadrant | BADHDUFLAG | Total packets | Discarded packets |
| A | 0 | 13 | 0 |
| B | 0 | 13 | 0 |
| C | 0 | 13 | 0 |
| D | 0 | 13 | 0 |
| Mode SS | |||
|---|---|---|---|
| Quadrant | BADHDUFLAG | Total packets | Discarded packets |
| A | 0 | 122 | 0 |
| B | 0 | 122 | 0 |
| C | 0 | 122 | 0 |
| D | 0 | 122 | 0 |
| Mode M0 | |||
|---|---|---|---|
| Quadrant | BADHDUFLAG | Total packets | Discarded packets |
| A | 0 | 13565 | 1 |
| B | 0 | 13954 | 1 |
| C | 0 | 13686 | 1 |
| D | 0 | 27791 | 1 |
| Quadrant | Total seconds | Saturated seconds | Saturation percentage |
|---|---|---|---|
| A | 6148 | 45 | 0.731945% |
| B | 6149 | 89 | 1.447390% |
| C | 6149 | 106 | 1.723858% |
| D | 6149 | 920 | 14.961782% |
Noise dominated data is calculated using 1-second bins in cleaned event files. If a bin has >2000 counts, and if more than 50% of those come from <1% of pixels, then it is considered to be noise-dominated and hence unusable.
| Quadrant | # 1 sec bins | Bins with >0 counts | Bins with >2000 counts | High rate bins dominated by noise | Noise dominated (total time) | Noise dominated (detector-on time) | Marked lightcurve |
|---|---|---|---|---|---|---|---|
| A | 7368 | 6148 | 0 | 0 | 0.00% | 0.00% | 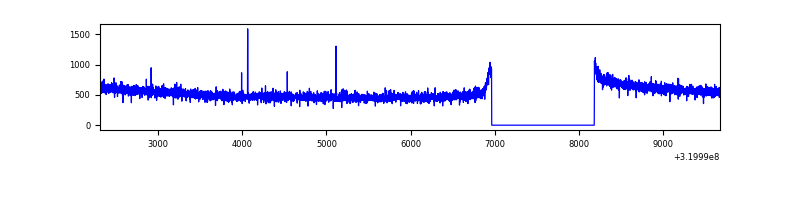 |
| B | 7369 | 6149 | 17 | 17 | 0.23% | 0.28% | 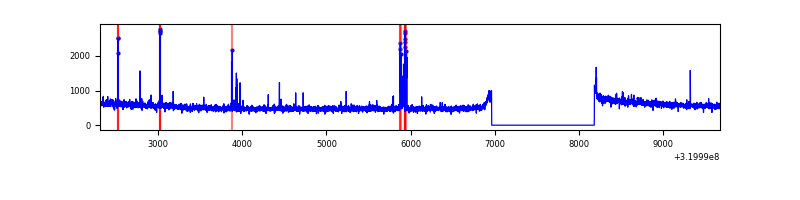 |
| C | 7369 | 6149 | 0 | 0 | 0.00% | 0.00% | 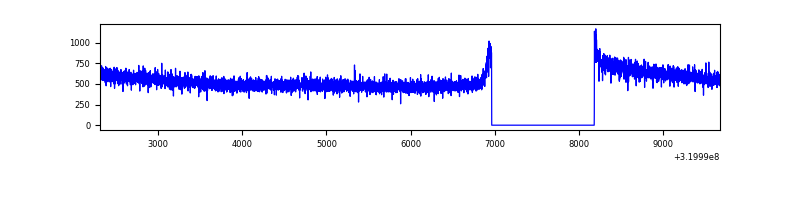 |
| D | 7369 | 6149 | 664 | 664 | 9.01% | 10.80% | 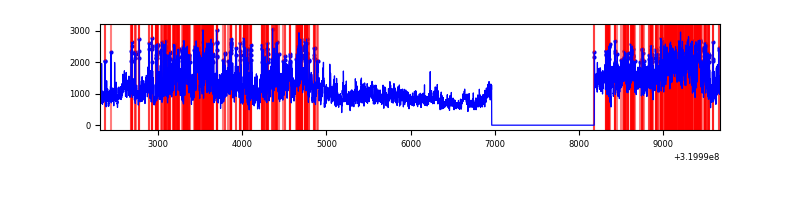 |
Top three noisy pixels from each quadrant. If the there are fewer than three noisy pixels in the level2.evt file, extra rows are filled as -1
| Pixel properties | Quadrant properties | ||||||
|---|---|---|---|---|---|---|---|
| Quadrant | DetID | PixID | Counts | Sigma | Mean | Median | Sigma |
| A | 13 | 254 | 10321 | 56.37 | 839 | 825 | 168.5 |
| A | 0 | 226 | 7296 | 38.41 | 839 | 825 | 168.5 |
| A | 3 | 137 | 6829 | 35.64 | 839 | 825 | 168.5 |
| B | 3 | 64 | 91116 | 582.79 | 830 | 811 | 155.0 |
| B | 12 | 111 | 17665 | 108.77 | 830 | 811 | 155.0 |
| B | 0 | 189 | 17108 | 105.17 | 830 | 811 | 155.0 |
| C | 14 | 238 | 133173 | 706.65 | 812 | 820 | 187.3 |
| C | 7 | 247 | 5951 | 27.4 | 812 | 820 | 187.3 |
| C | 13 | 61 | 5730 | 26.22 | 812 | 820 | 187.3 |
| D | 8 | 195 | 3092940 | 16125.19 | 793 | 772 | 191.8 |
| D | 13 | 174 | 1388997 | 7239.38 | 793 | 772 | 191.8 |
| D | 1 | 52 | 252508 | 1312.77 | 793 | 772 | 191.8 |
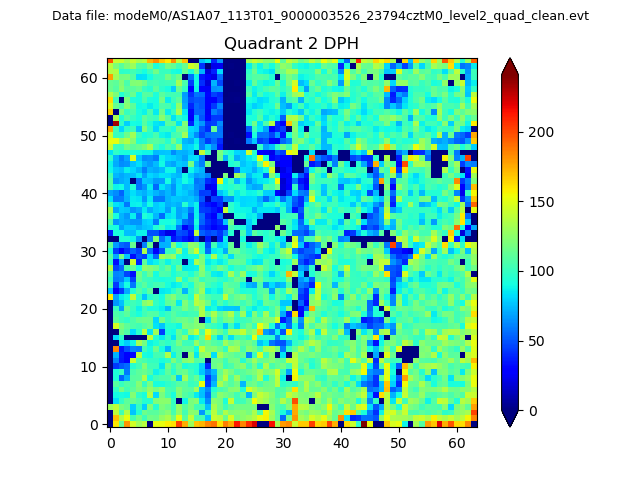
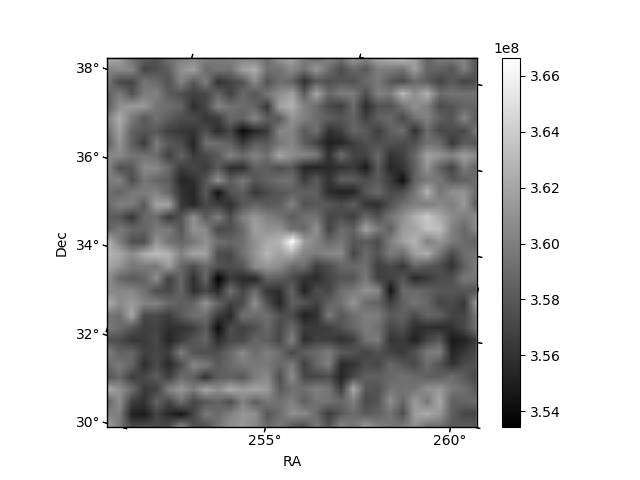
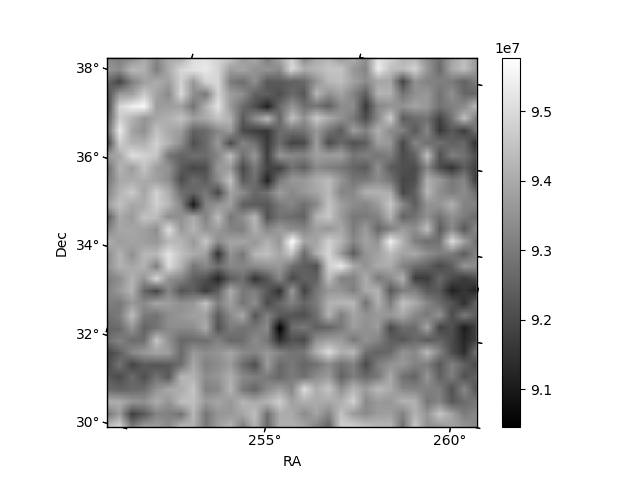
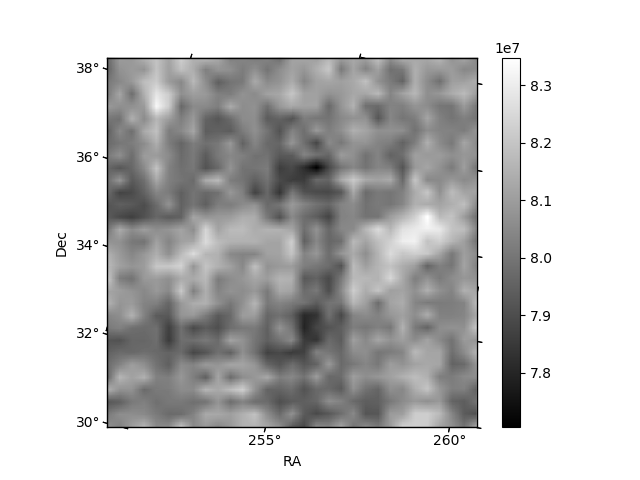
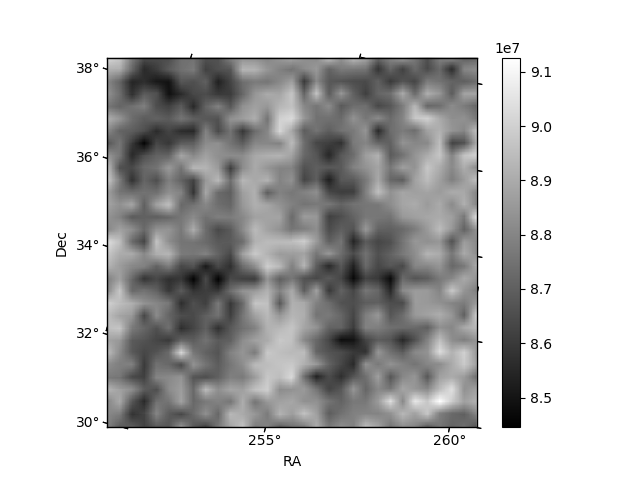
Histogram calculated using DETX and DETY for each event in the final _common_clean file
| Quadrant A | 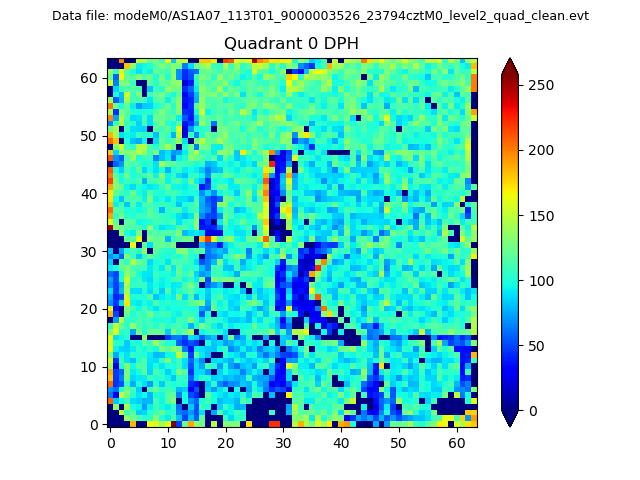 |
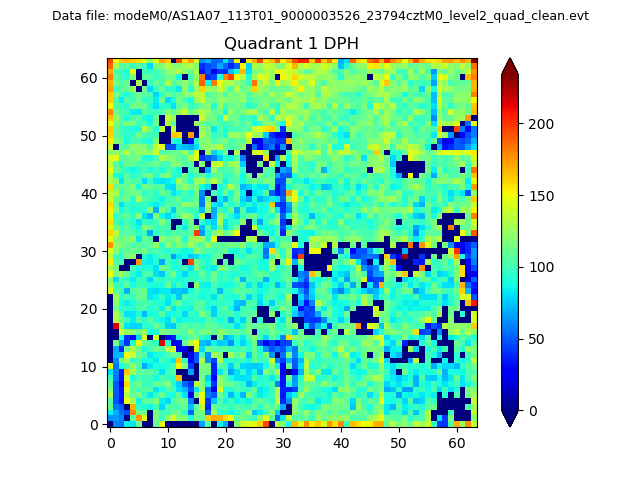 |
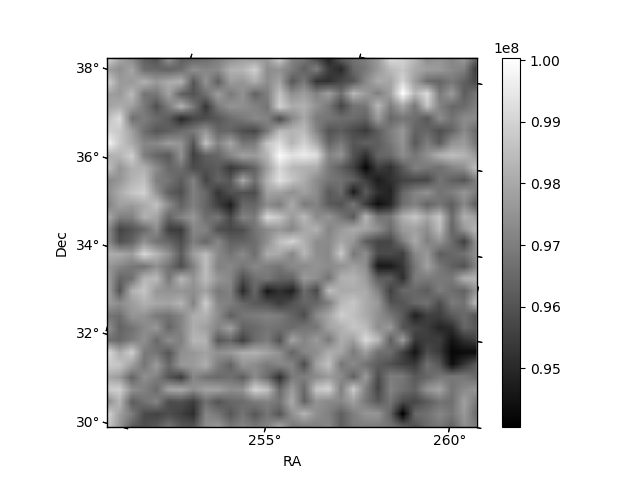
Quadrant B |
|---|---|---|---|
| Quadrant D | 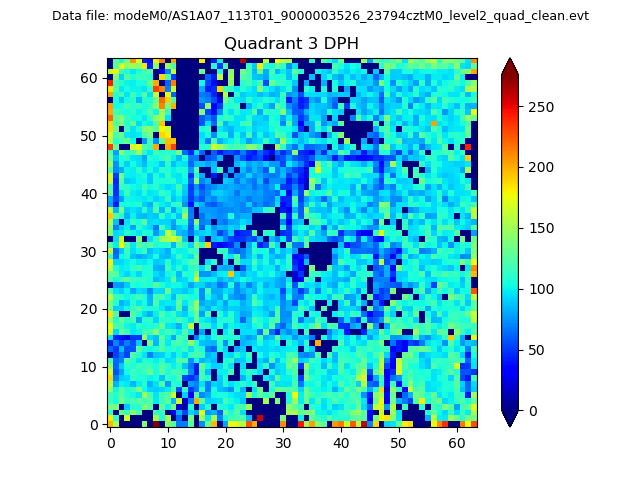 |
 |
Quadrant C |
| Plot type | Count rate plots | Images |
|---|---|---|
| Comparison with Poisson distribution Blue bars denote a histogram of data divided into 1 sec bins. Red curve is a Poisson curve with rate = median count rate of data. |
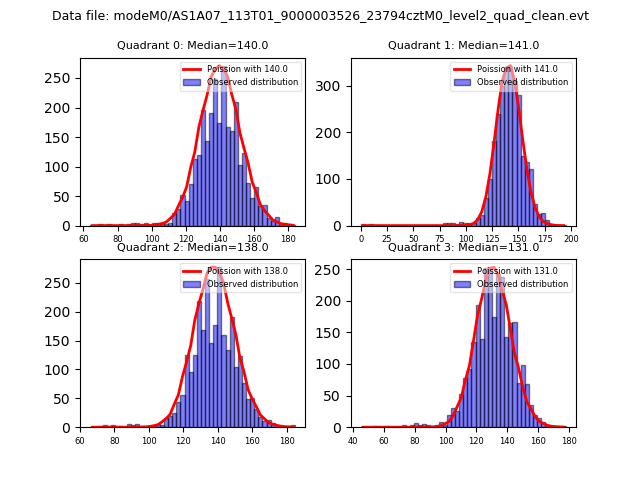 |
 |
| Quadrant-wise count rates Data is divided into 100 sec bins |
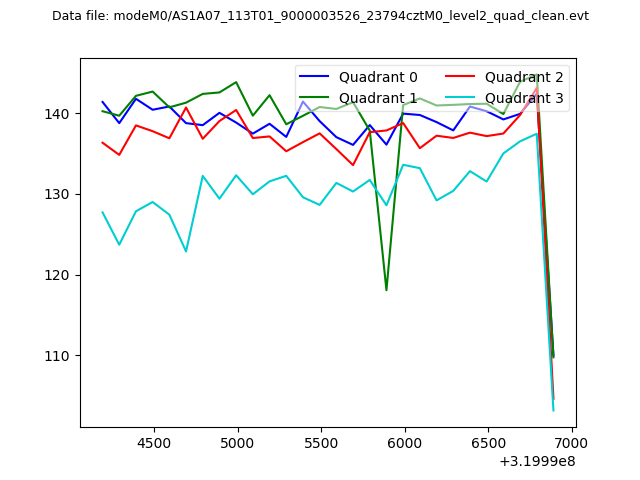 |
|
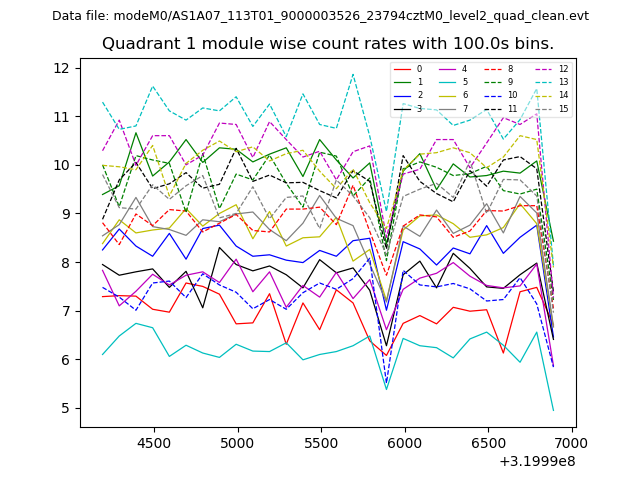
| Module-wise count rates for Quadrant A Data is divided into 100 sec bins |
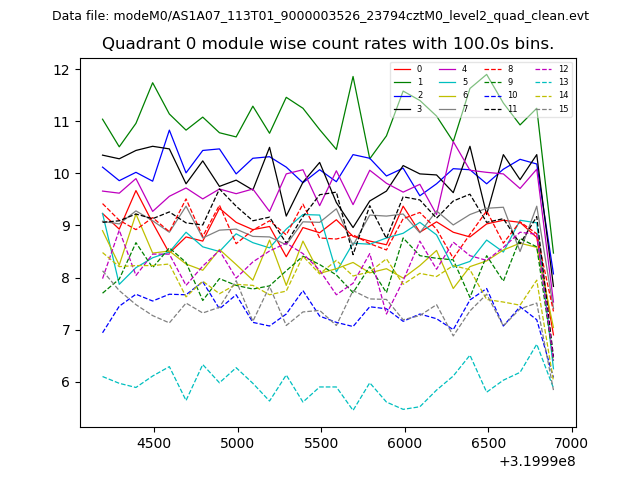 |
 |
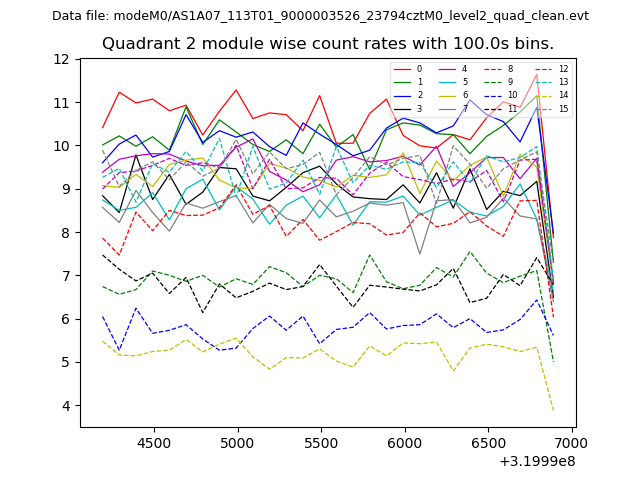
| Module-wise count rates for Quadrant B Data is divided into 100 sec bins |
 |
 |
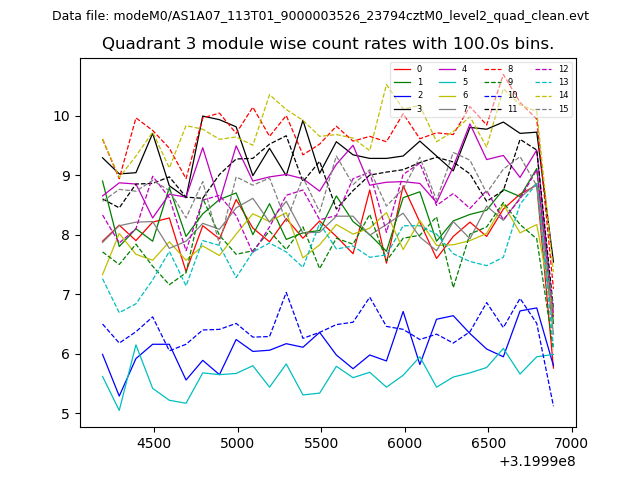
| Module-wise count rates for Quadrant C Data is divided into 100 sec bins |
 |
 |
| Module-wise count rates for Quadrant D Data is divided into 100 sec bins |
 |
 |
| Parameter | Plot |
|---|---|
| CZT HV Monitor | 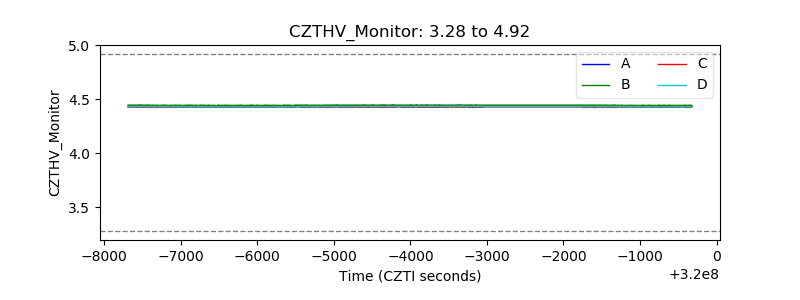 |
| D_VDD | 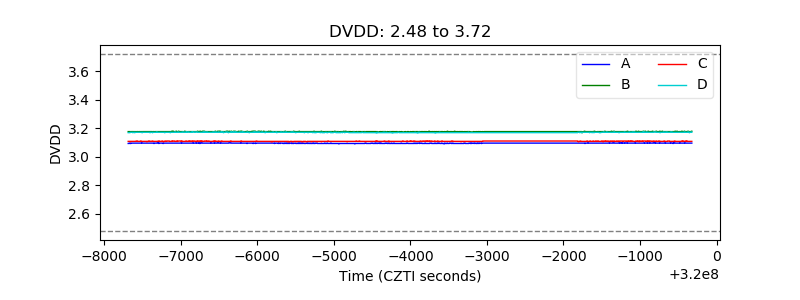 |
| Temperature 1 | 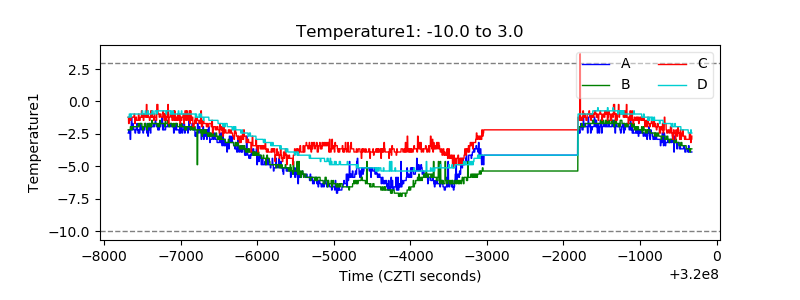 |
| Veto HV Monitor | 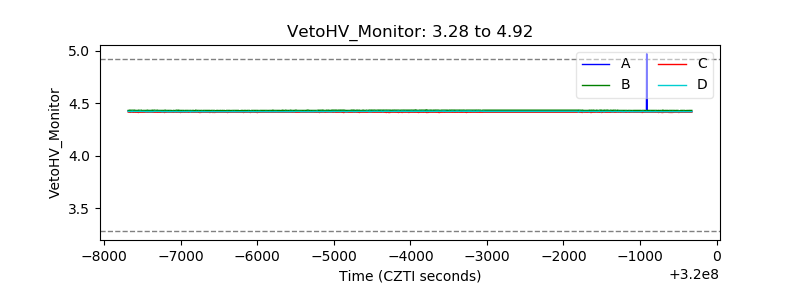 |
| Veto LLD | 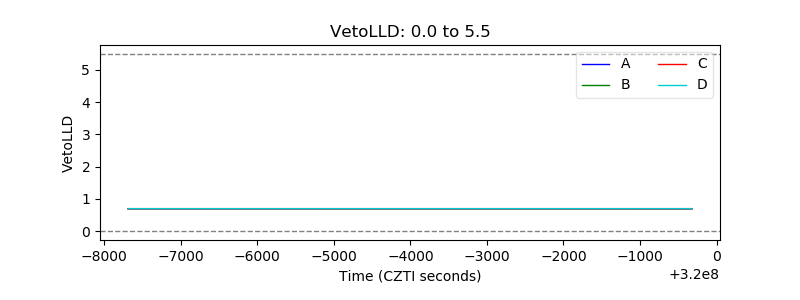 |
| Alpha Counter | 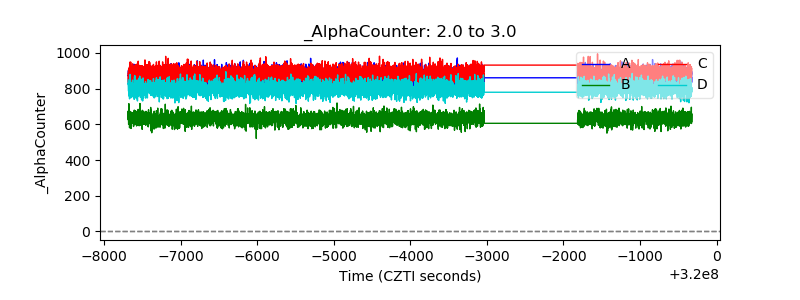 |
| _CPM_Rate | 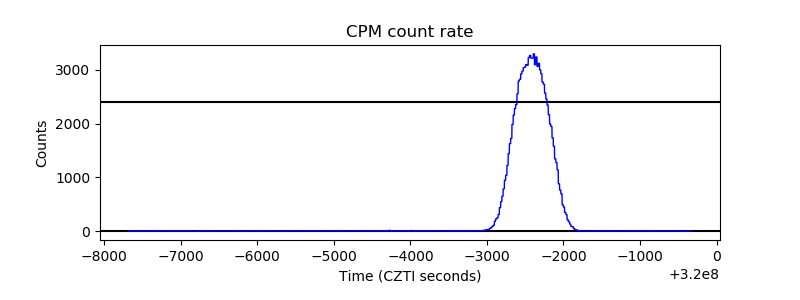 |
| CZT Counter | 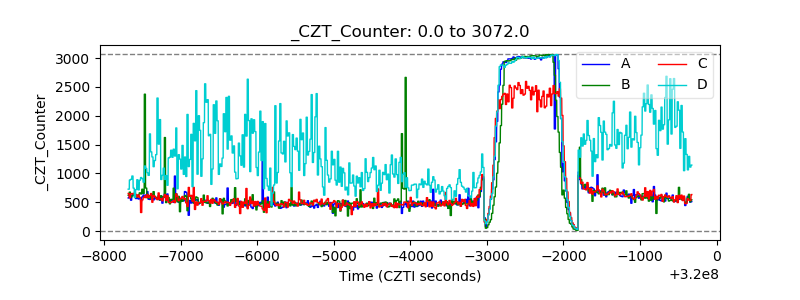 |
| +2.5 Volts monitor |  |
| +5 Volts monitor |  |
| _ROLL_ROT | 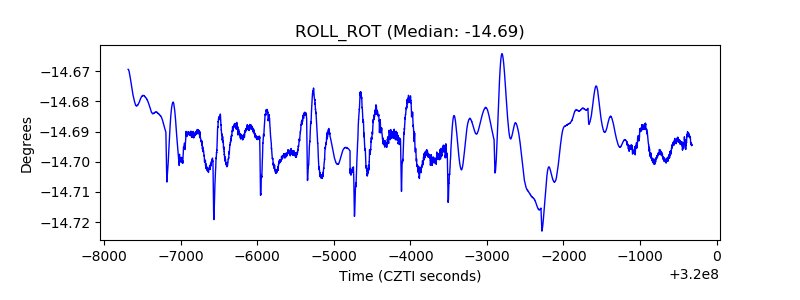 |
| _Roll_DEC | 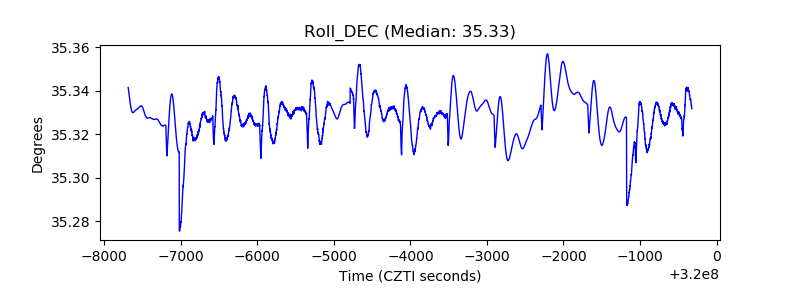 |
| _Roll_RA | 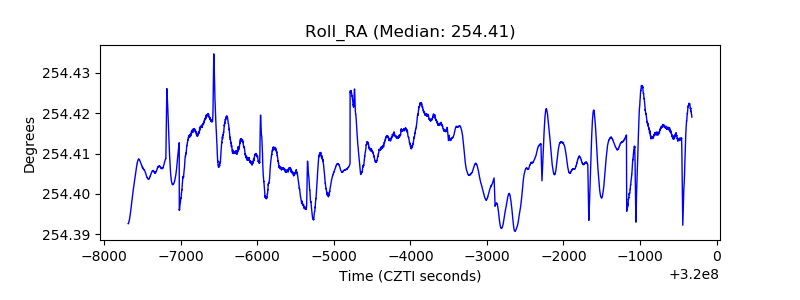 |
| Veto Counter | 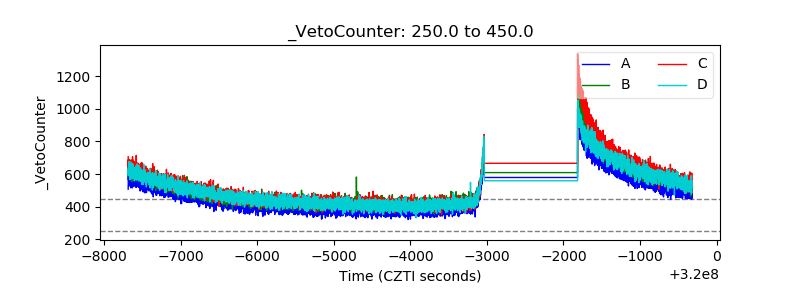 |