| Param | Original file | Final file |
|---|---|---|
| Filename | modeM0/AS1A07_113T01_9000003526_23796cztM0_level2.evt | modeM0/AS1A07_113T01_9000003526_23796cztM0_level2_quad_clean.evt |
| Size (bytes) | 592,401,600 | 86,212,800 |
| Size | 565.0 MB | 82.2 MB |
| Events in quadrant A | 3,363,917 | 548,037 |
| Events in quadrant B | 3,495,593 | 563,169 |
| Events in quadrant C | 3,505,693 | 551,054 |
| Events in quadrant D | 7,163,649 | 523,060 |
| Mode M9 | |||
|---|---|---|---|
| Quadrant | BADHDUFLAG | Total packets | Discarded packets |
| A | 0 | 20 | 0 |
| B | 0 | 21 | 0 |
| C | 0 | 21 | 0 |
| D | 0 | 21 | 0 |
| Mode SS | |||
|---|---|---|---|
| Quadrant | BADHDUFLAG | Total packets | Discarded packets |
| A | 0 | 126 | 0 |
| B | 0 | 126 | 0 |
| C | 0 | 126 | 0 |
| D | 0 | 126 | 0 |
| Mode M0 | |||
|---|---|---|---|
| Quadrant | BADHDUFLAG | Total packets | Discarded packets |
| A | 0 | 13981 | 2 |
| B | 0 | 14321 | 2 |
| C | 0 | 14468 | 3 |
| D | 0 | 25518 | 2 |
| Quadrant | Total seconds | Saturated seconds | Saturation percentage |
|---|---|---|---|
| A | 6086 | 60 | 0.985869% |
| B | 6086 | 80 | 1.314492% |
| C | 6085 | 152 | 2.497946% |
| D | 6085 | 858 | 14.100247% |
Noise dominated data is calculated using 1-second bins in cleaned event files. If a bin has >2000 counts, and if more than 50% of those come from <1% of pixels, then it is considered to be noise-dominated and hence unusable.
| Quadrant | # 1 sec bins | Bins with >0 counts | Bins with >2000 counts | High rate bins dominated by noise | Noise dominated (total time) | Noise dominated (detector-on time) | Marked lightcurve |
|---|---|---|---|---|---|---|---|
| A | 7466 | 6086 | 0 | 0 | 0.00% | 0.00% | 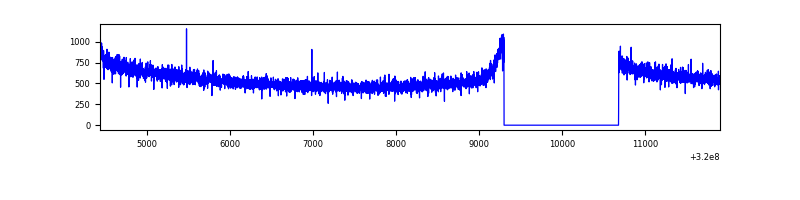 |
| B | 7466 | 6086 | 5 | 5 | 0.07% | 0.08% | 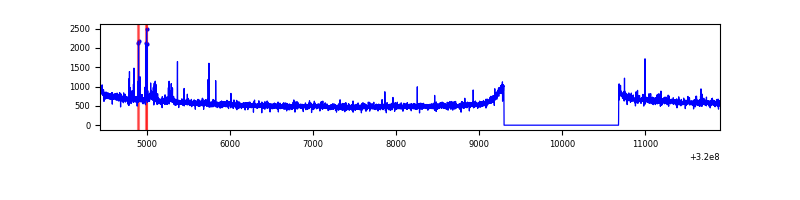 |
| C | 7465 | 6085 | 0 | 0 | 0.00% | 0.00% | 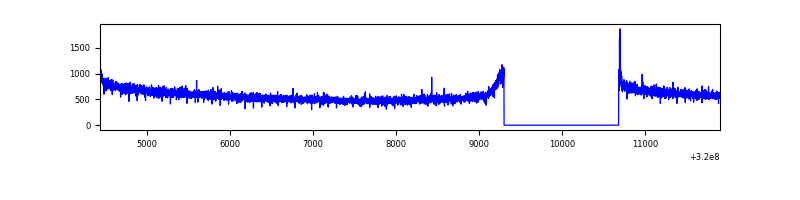 |
| D | 7465 | 6085 | 567 | 567 | 7.60% | 9.32% | 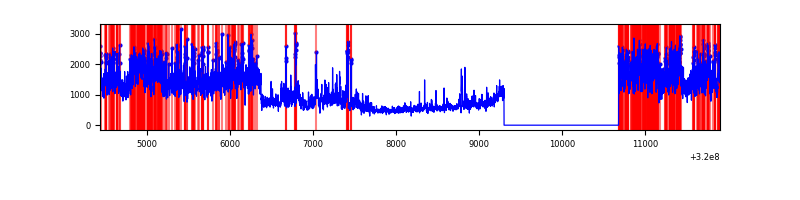 |
Top three noisy pixels from each quadrant. If the there are fewer than three noisy pixels in the level2.evt file, extra rows are filled as -1
| Pixel properties | Quadrant properties | ||||||
|---|---|---|---|---|---|---|---|
| Quadrant | DetID | PixID | Counts | Sigma | Mean | Median | Sigma |
| A | 13 | 254 | 10585 | 56.31 | 872 | 858 | 172.7 |
| A | 0 | 226 | 7571 | 38.86 | 872 | 858 | 172.7 |
| A | 3 | 137 | 6861 | 34.75 | 872 | 858 | 172.7 |
| B | 3 | 64 | 75894 | 464.0 | 873 | 855 | 161.7 |
| B | 12 | 111 | 18405 | 108.52 | 873 | 855 | 161.7 |
| B | 11 | 111 | 16338 | 95.74 | 873 | 855 | 161.7 |
| C | 14 | 238 | 140889 | 713.76 | 860 | 872 | 196.2 |
| C | 0 | 10 | 8775 | 40.29 | 860 | 872 | 196.2 |
| C | 13 | 61 | 5991 | 26.09 | 860 | 872 | 196.2 |
| D | 8 | 195 | 2699654 | 13388.07 | 838 | 816 | 201.6 |
| D | 13 | 174 | 816661 | 4047.15 | 838 | 816 | 201.6 |
| D | 1 | 52 | 309310 | 1530.34 | 838 | 816 | 201.6 |
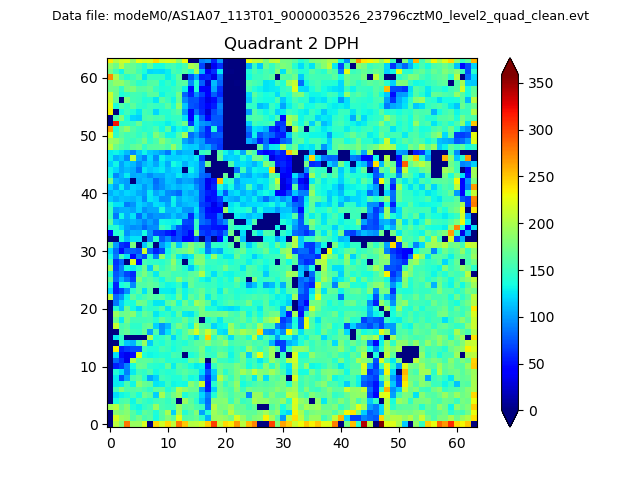
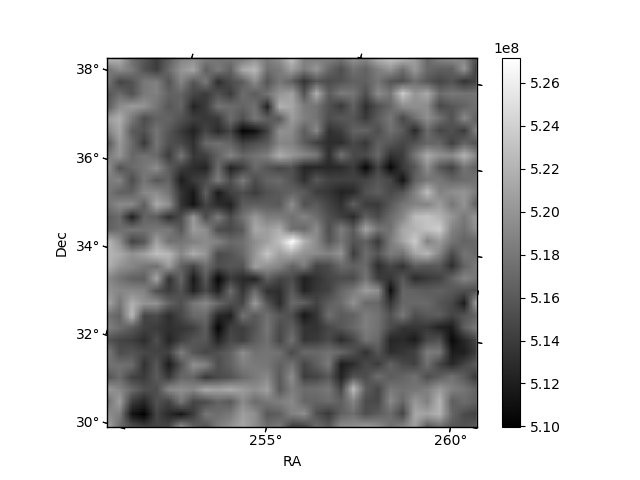
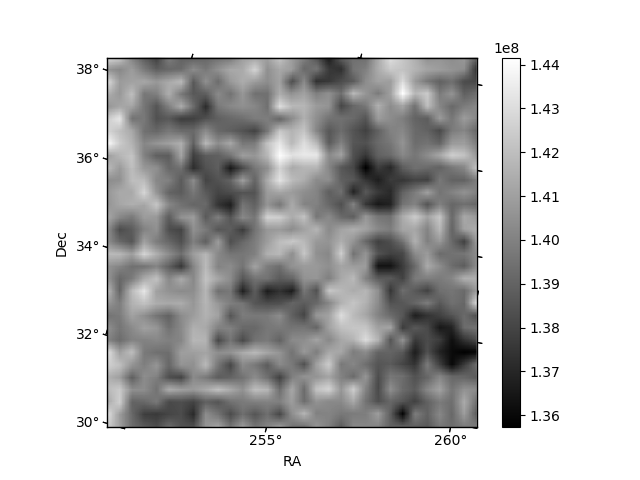
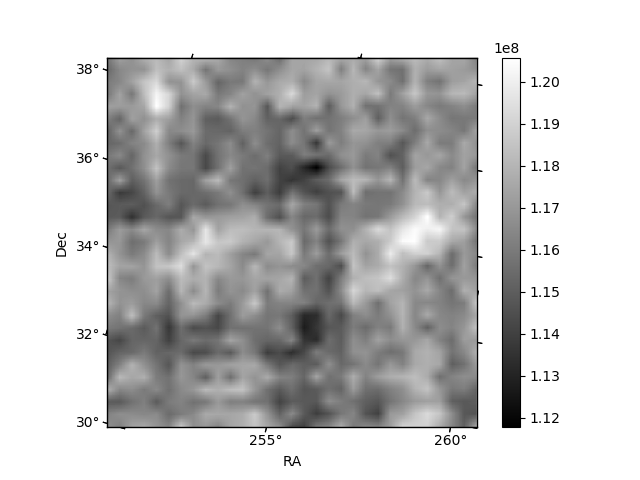
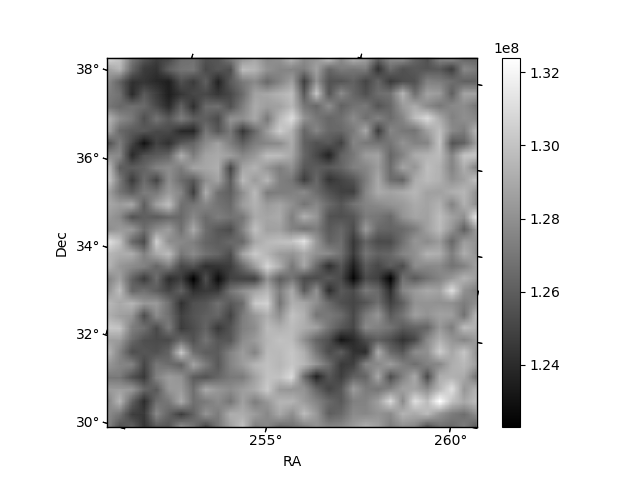
Histogram calculated using DETX and DETY for each event in the final _common_clean file
| Quadrant A | 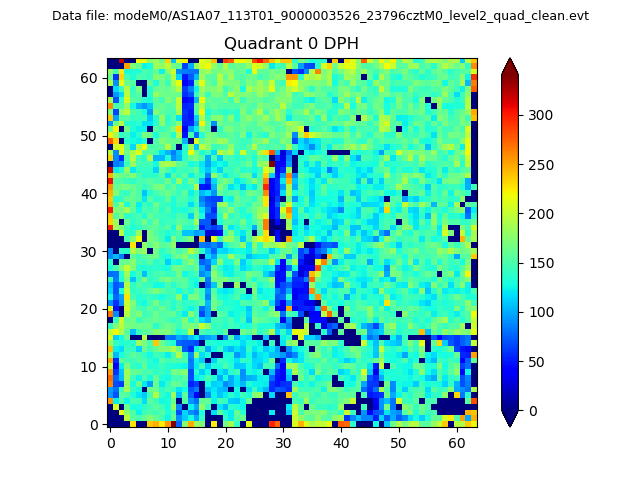 |
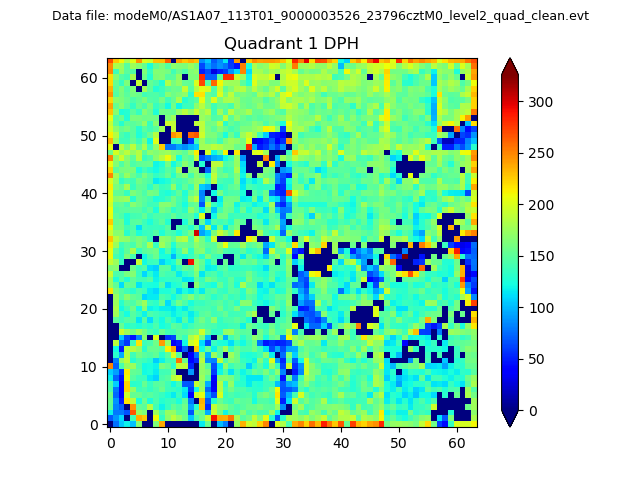 |
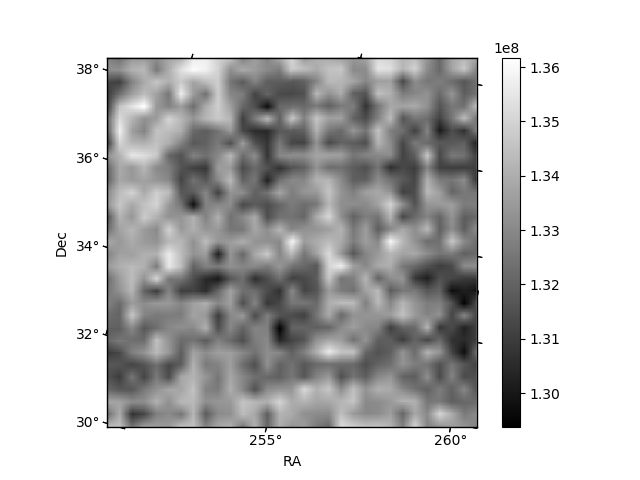
Quadrant B |
|---|---|---|---|
| Quadrant D | 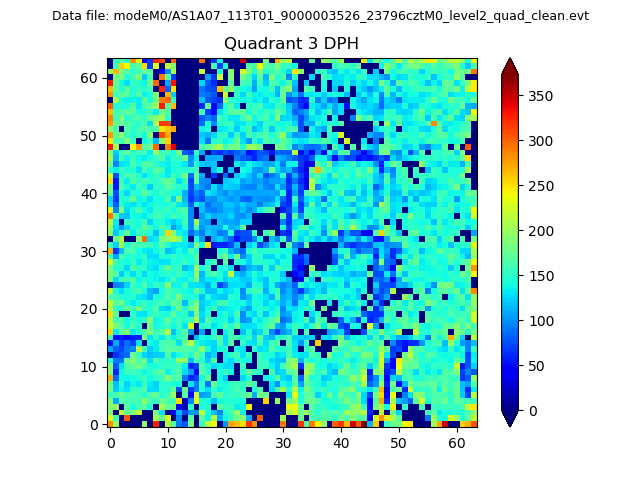 |
 |
Quadrant C |
| Plot type | Count rate plots | Images |
|---|---|---|
| Comparison with Poisson distribution Blue bars denote a histogram of data divided into 1 sec bins. Red curve is a Poisson curve with rate = median count rate of data. |
 |
 |
| Quadrant-wise count rates Data is divided into 100 sec bins |
 |
|
| Module-wise count rates for Quadrant A Data is divided into 100 sec bins |
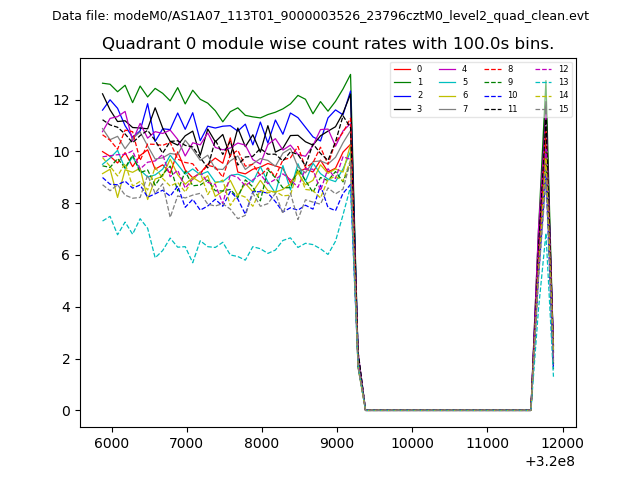 |
 |
| Module-wise count rates for Quadrant B Data is divided into 100 sec bins |
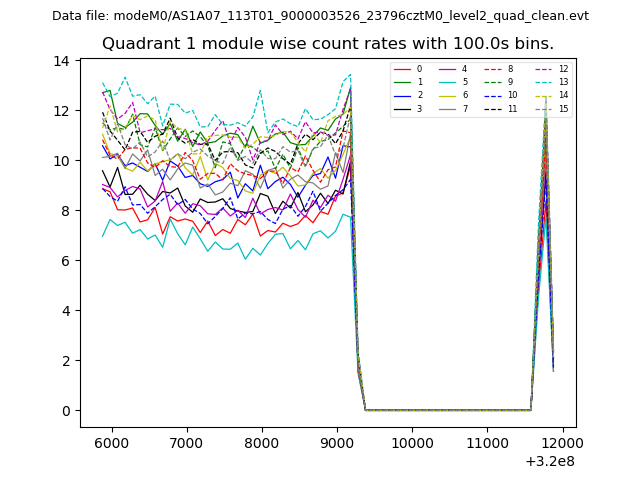 |
 |
| Module-wise count rates for Quadrant C Data is divided into 100 sec bins |
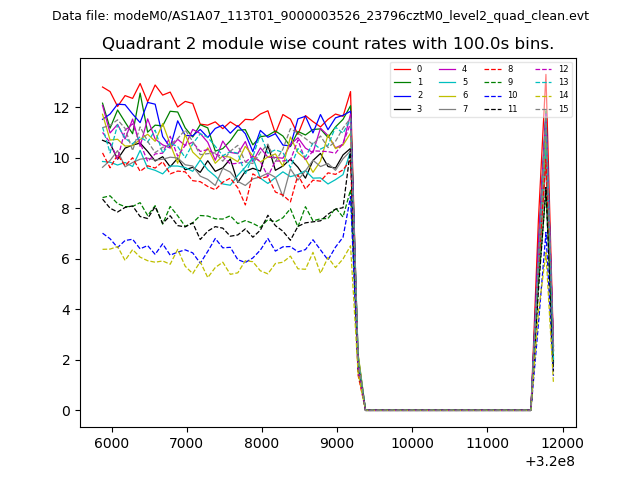 |
 |
| Module-wise count rates for Quadrant D Data is divided into 100 sec bins |
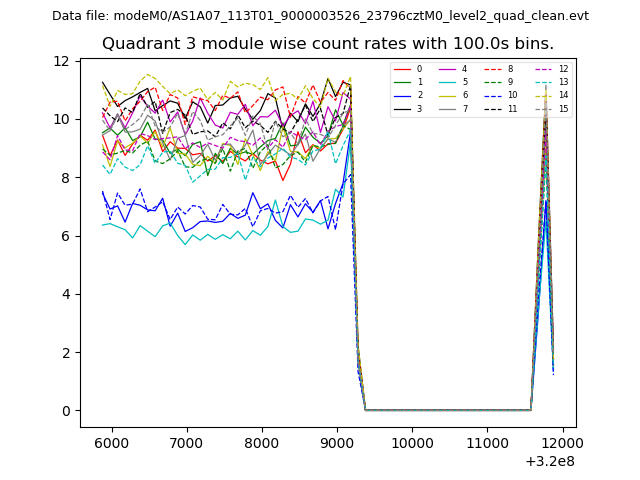 |
 |
| Parameter | Plot |
|---|---|
| CZT HV Monitor | 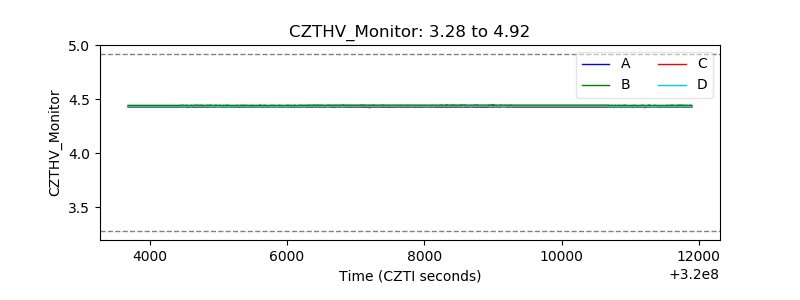 |
| D_VDD | 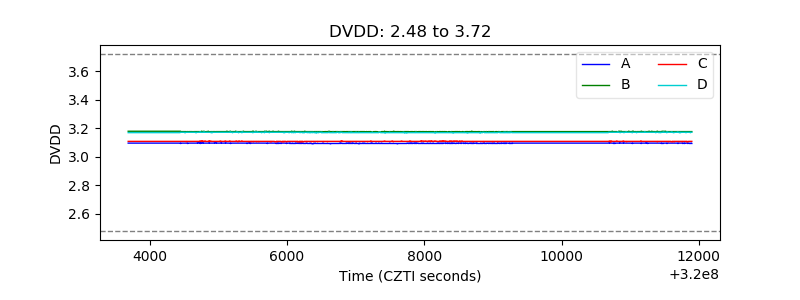 |
| Temperature 1 | 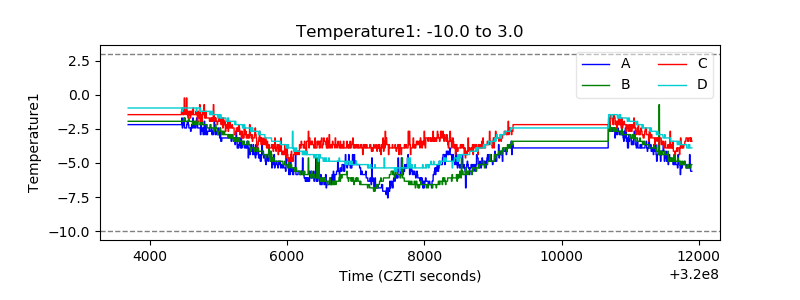 |
| Veto HV Monitor | 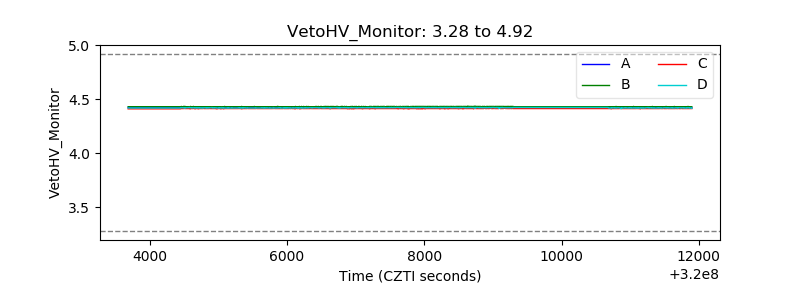 |
| Veto LLD | 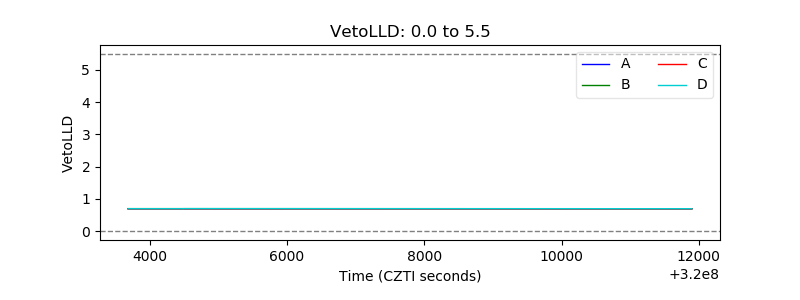 |
| Alpha Counter | 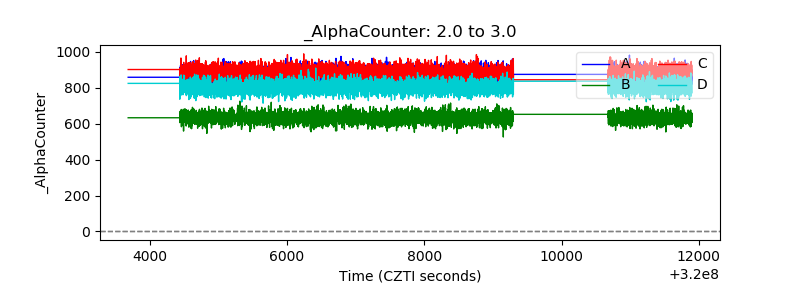 |
| _CPM_Rate | 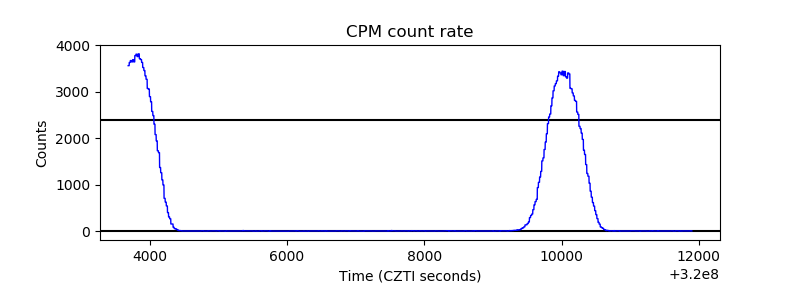 |
| CZT Counter | 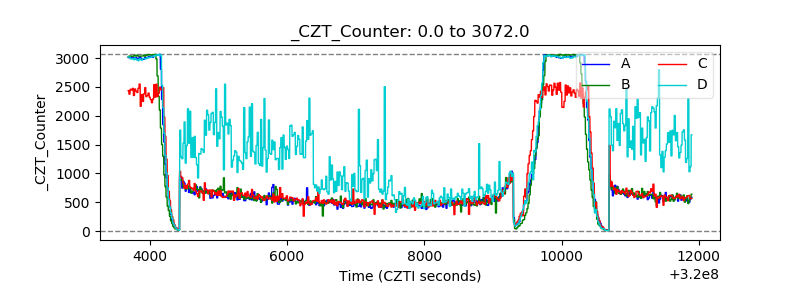 |
| +2.5 Volts monitor |  |
| +5 Volts monitor |  |
| _ROLL_ROT | 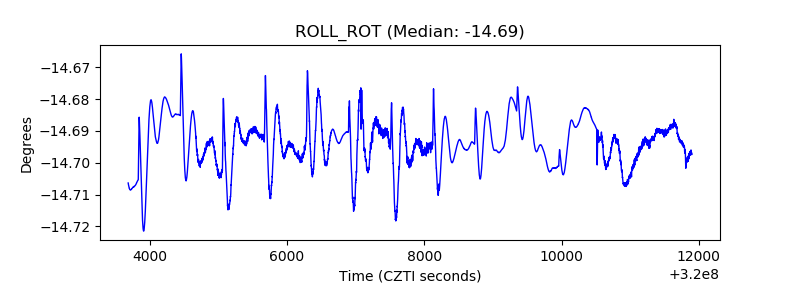 |
| _Roll_DEC |  |
| _Roll_RA | 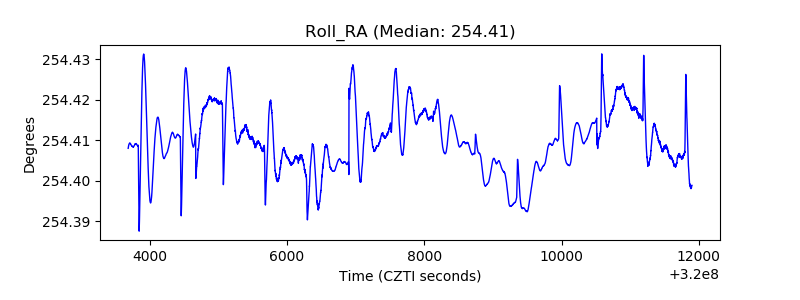 |
| Veto Counter | 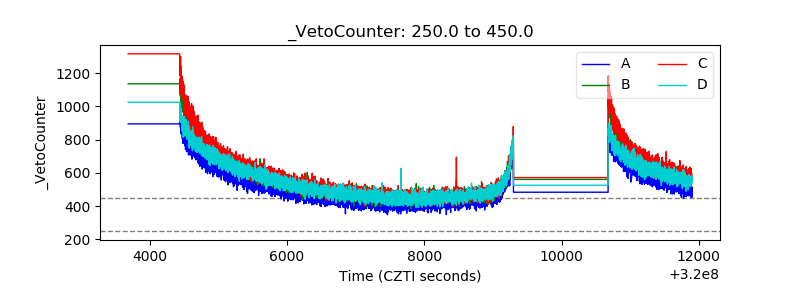 |