| Param | Original file | Final file |
|---|---|---|
| Filename | modeM0/AS1A07_113T01_9000003526_23798cztM0_level2.evt | modeM0/AS1A07_113T01_9000003526_23798cztM0_level2_quad_clean.evt |
| Size (bytes) | 686,266,560 | 100,085,760 |
| Size | 654.5 MB | 95.4 MB |
| Events in quadrant A | 3,223,407 | 672,574 |
| Events in quadrant B | 5,489,329 | 626,960 |
| Events in quadrant C | 3,435,076 | 678,501 |
| Events in quadrant D | 8,203,954 | 606,725 |
| Mode M9 | |||
|---|---|---|---|
| Quadrant | BADHDUFLAG | Total packets | Discarded packets |
| A | 0 | 13 | 0 |
| B | 0 | 14 | 0 |
| C | 0 | 14 | 0 |
| D | 0 | 14 | 0 |
| Mode SS | |||
|---|---|---|---|
| Quadrant | BADHDUFLAG | Total packets | Discarded packets |
| A | 0 | 130 | 0 |
| B | 0 | 130 | 0 |
| C | 0 | 130 | 0 |
| D | 0 | 130 | 0 |
| Mode M0 | |||
|---|---|---|---|
| Quadrant | BADHDUFLAG | Total packets | Discarded packets |
| A | 0 | 13579 | 2 |
| B | 0 | 20563 | 2 |
| C | 0 | 14226 | 2 |
| D | 0 | 28885 | 3 |
| Quadrant | Total seconds | Saturated seconds | Saturation percentage |
|---|---|---|---|
| A | 6387 | 83 | 1.299515% |
| B | 6387 | 1036 | 16.220448% |
| C | 6387 | 172 | 2.692970% |
| D | 6386 | 1229 | 19.245224% |
Noise dominated data is calculated using 1-second bins in cleaned event files. If a bin has >2000 counts, and if more than 50% of those come from <1% of pixels, then it is considered to be noise-dominated and hence unusable.
| Quadrant | # 1 sec bins | Bins with >0 counts | Bins with >2000 counts | High rate bins dominated by noise | Noise dominated (total time) | Noise dominated (detector-on time) | Marked lightcurve |
|---|---|---|---|---|---|---|---|
| A | 7517 | 6387 | 0 | 0 | 0.00% | 0.00% | 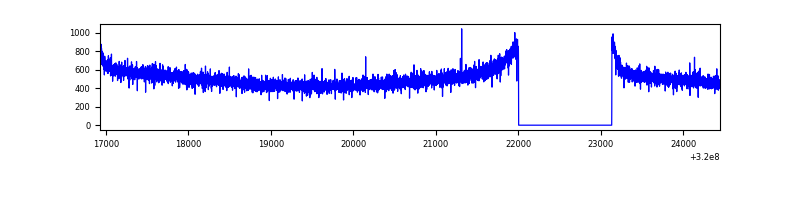 |
| B | 7516 | 6386 | 646 | 646 | 8.59% | 10.12% | 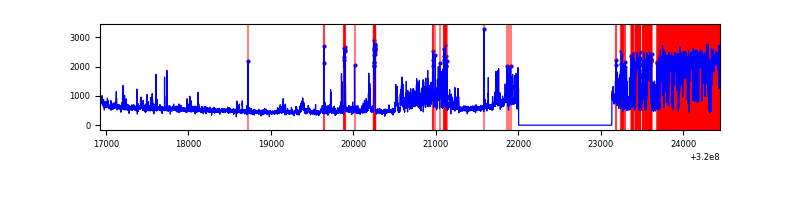 |
| C | 7517 | 6387 | 0 | 0 | 0.00% | 0.00% | 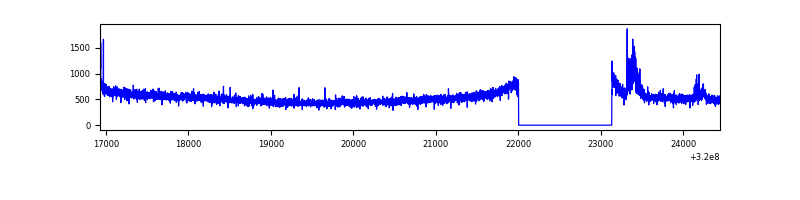 |
| D | 7516 | 6386 | 1065 | 1065 | 14.17% | 16.68% | 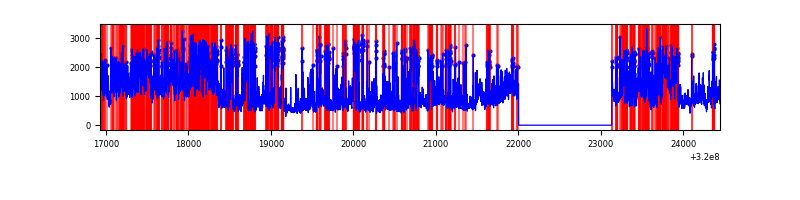 |
Top three noisy pixels from each quadrant. If the there are fewer than three noisy pixels in the level2.evt file, extra rows are filled as -1
| Pixel properties | Quadrant properties | ||||||
|---|---|---|---|---|---|---|---|
| Quadrant | DetID | PixID | Counts | Sigma | Mean | Median | Sigma |
| A | 13 | 254 | 11021 | 60.83 | 835 | 818 | 167.7 |
| A | 3 | 137 | 7223 | 38.19 | 835 | 818 | 167.7 |
| A | 0 | 226 | 7194 | 38.02 | 835 | 818 | 167.7 |
| B | 3 | 64 | 2337664 | 15956.64 | 779 | 760 | 146.5 |
| B | 10 | 247 | 85527 | 578.8 | 779 | 760 | 146.5 |
| B | 12 | 111 | 17177 | 112.1 | 779 | 760 | 146.5 |
| C | 14 | 238 | 131987 | 692.34 | 820 | 829 | 189.4 |
| C | 7 | 247 | 97123 | 508.3 | 820 | 829 | 189.4 |
| C | 0 | 10 | 12111 | 59.55 | 820 | 829 | 189.4 |
| D | 8 | 195 | 3694480 | 19518.17 | 783 | 762 | 189.2 |
| D | 1 | 52 | 1065309 | 5625.23 | 783 | 762 | 189.2 |
| D | 13 | 174 | 451670 | 2382.67 | 783 | 762 | 189.2 |
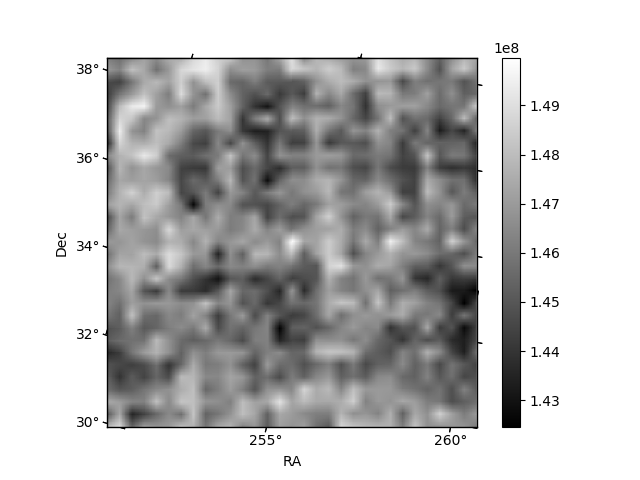
Histogram calculated using DETX and DETY for each event in the final _common_clean file
| Quadrant A | 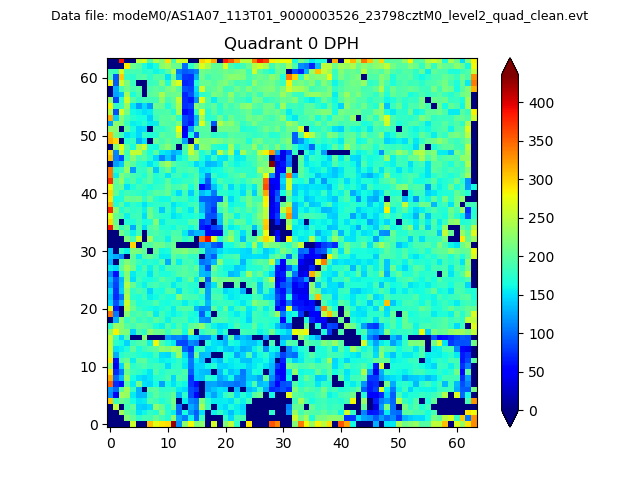 |
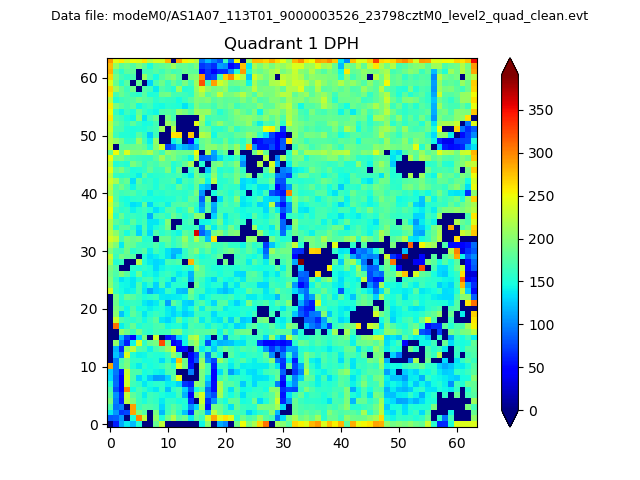 |
Quadrant B |
|---|---|---|---|
| Quadrant D |  |
 |
Quadrant C |
| Plot type | Count rate plots | Images |
|---|---|---|
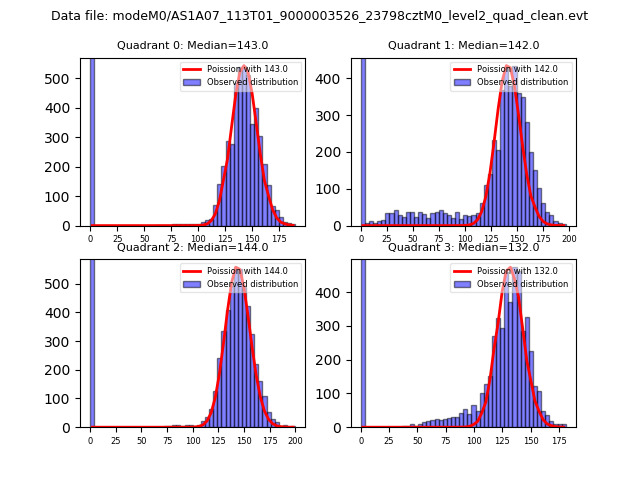
| Comparison with Poisson distribution Blue bars denote a histogram of data divided into 1 sec bins. Red curve is a Poisson curve with rate = median count rate of data. |
 |
 |
| Quadrant-wise count rates Data is divided into 100 sec bins |
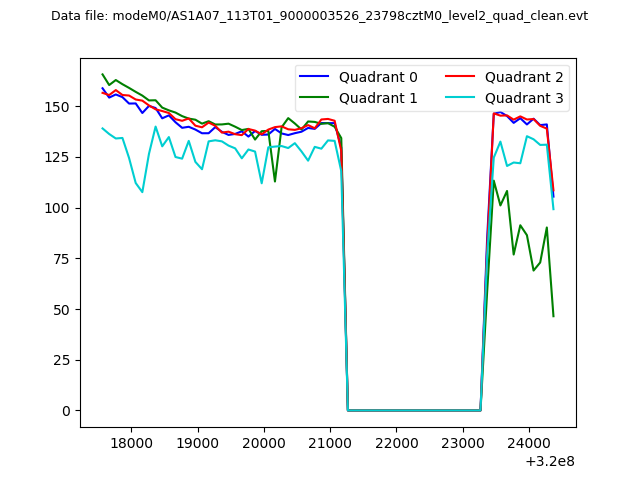 |
|
| Module-wise count rates for Quadrant A Data is divided into 100 sec bins |
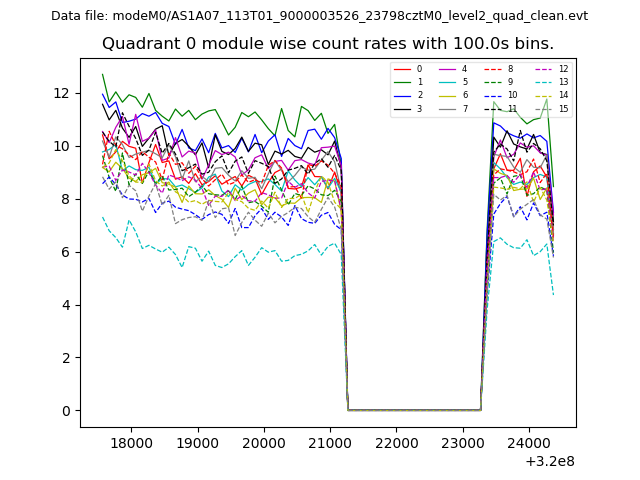 |
 |
| Module-wise count rates for Quadrant B Data is divided into 100 sec bins |
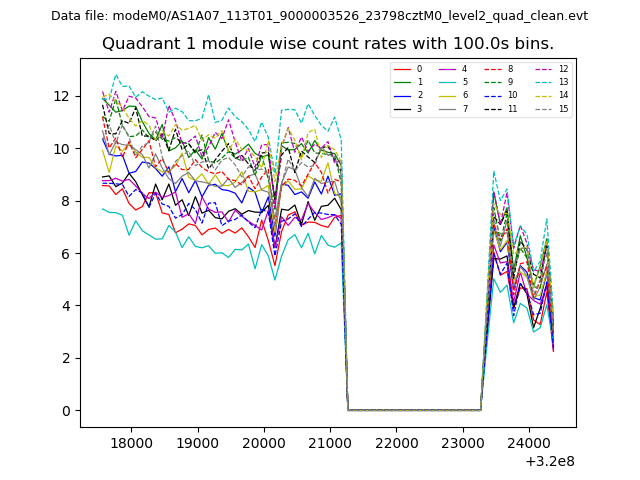 |
 |
| Module-wise count rates for Quadrant C Data is divided into 100 sec bins |
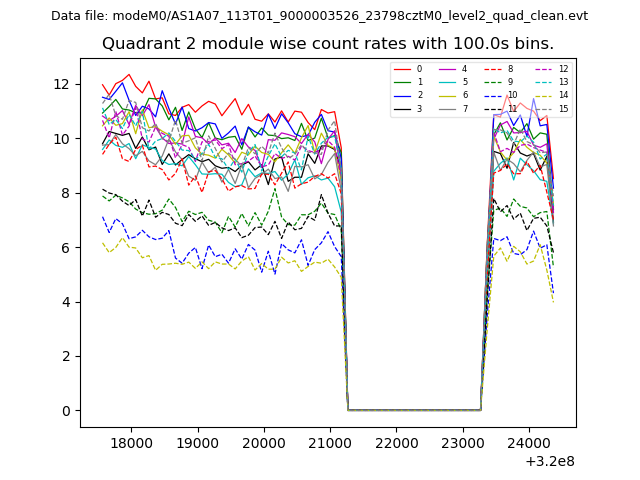 |
 |
| Module-wise count rates for Quadrant D Data is divided into 100 sec bins |
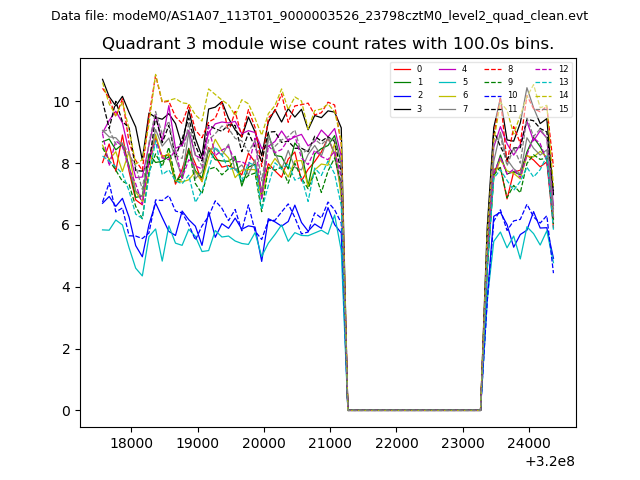 |
 |
| Parameter | Plot |
|---|---|
| CZT HV Monitor | 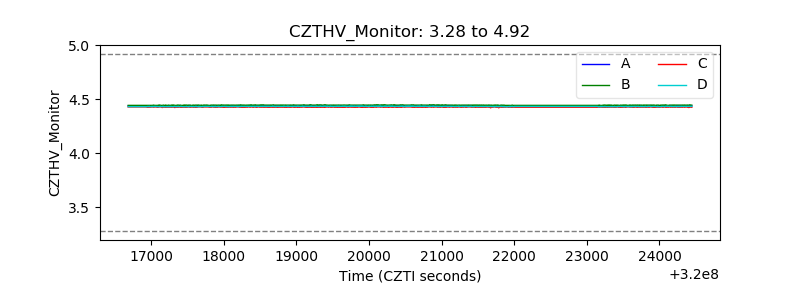 |
| D_VDD | 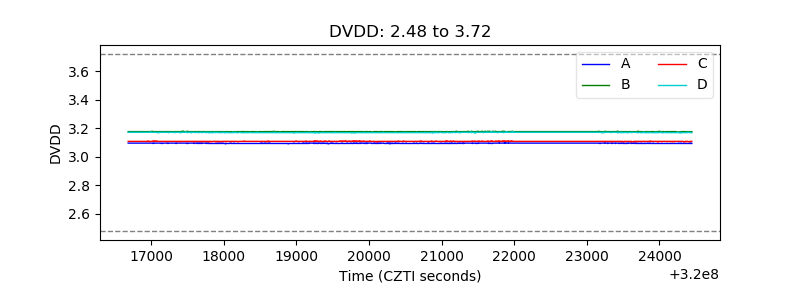 |
| Temperature 1 | 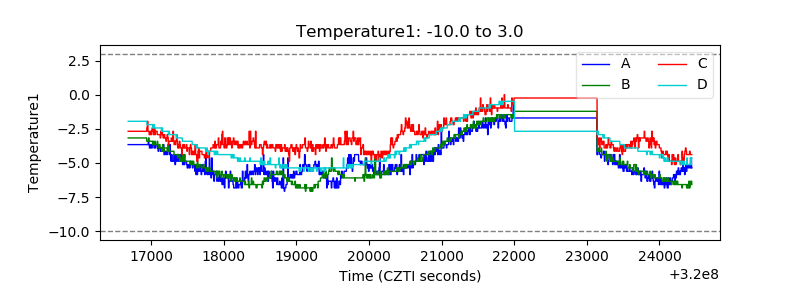 |
| Veto HV Monitor | 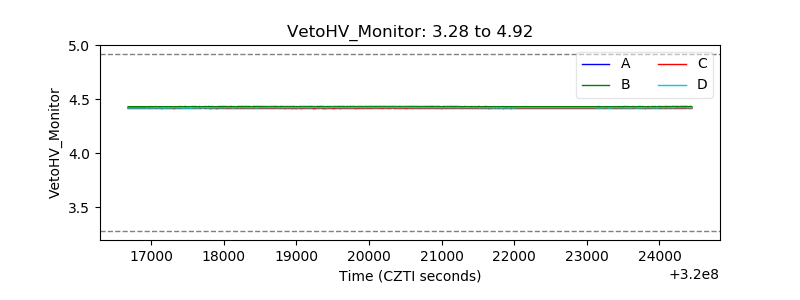 |
| Veto LLD | 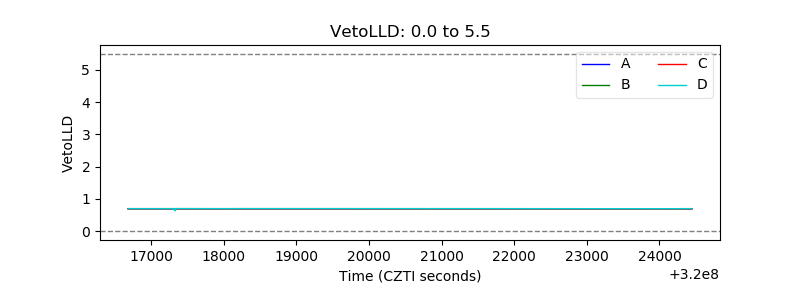 |
| Alpha Counter | 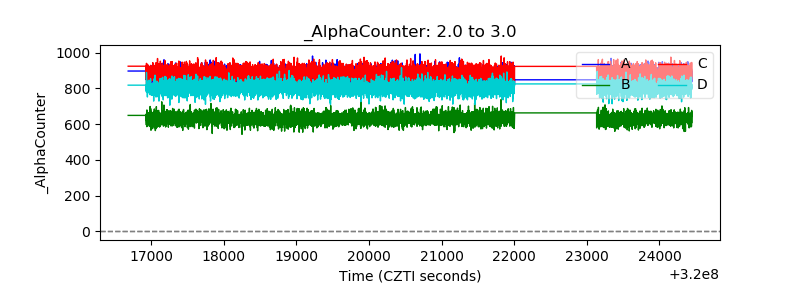 |
| _CPM_Rate | 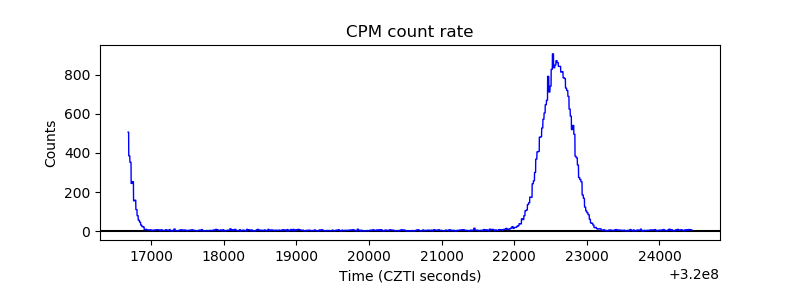 |
| CZT Counter |  |
| +2.5 Volts monitor |  |
| +5 Volts monitor |  |
| _ROLL_ROT | 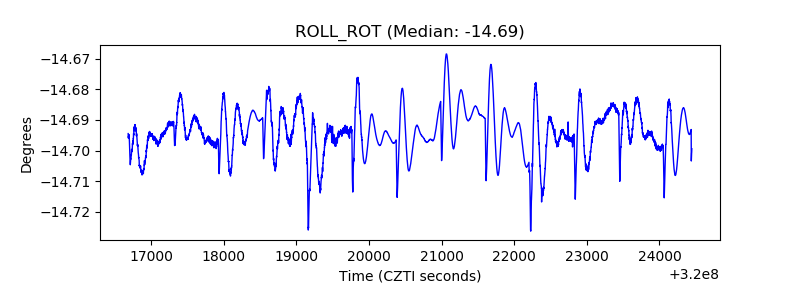 |
| _Roll_DEC |  |
| _Roll_RA | 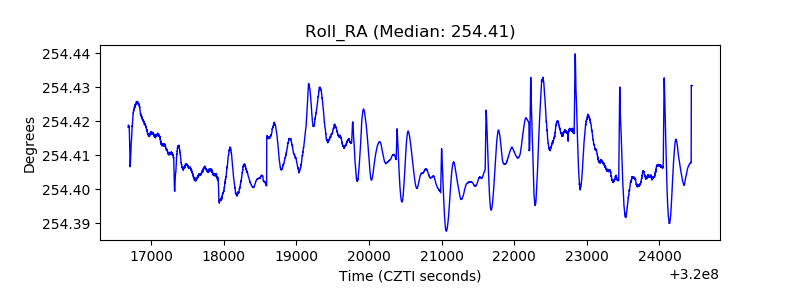 |
| Veto Counter | 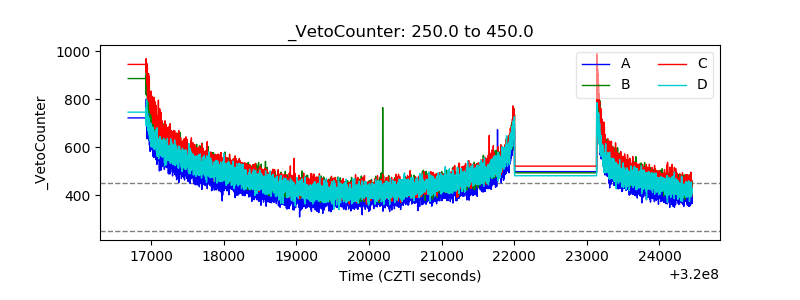 |