| Param | Original file | Final file |
|---|---|---|
| Filename | modeM0/AS1A07_113T01_9000003526_23799cztM0_level2.evt | modeM0/AS1A07_113T01_9000003526_23799cztM0_level2_quad_clean.evt |
| Size (bytes) | 814,034,880 | 105,076,800 |
| Size | 776.3 MB | 100.2 MB |
| Events in quadrant A | 3,368,773 | 717,219 |
| Events in quadrant B | 9,277,814 | 589,424 |
| Events in quadrant C | 3,561,524 | 721,057 |
| Events in quadrant D | 7,969,199 | 662,527 |
| Mode M9 | |||
|---|---|---|---|
| Quadrant | BADHDUFLAG | Total packets | Discarded packets |
| A | 0 | 12 | 0 |
| B | 0 | 13 | 0 |
| C | 0 | 13 | 0 |
| D | 0 | 13 | 0 |
| Mode SS | |||
|---|---|---|---|
| Quadrant | BADHDUFLAG | Total packets | Discarded packets |
| A | 0 | 144 | 0 |
| B | 0 | 144 | 0 |
| C | 0 | 144 | 0 |
| D | 0 | 144 | 0 |
| Mode M0 | |||
|---|---|---|---|
| Quadrant | BADHDUFLAG | Total packets | Discarded packets |
| A | 0 | 14572 | 2 |
| B | 0 | 32398 | 2 |
| C | 0 | 15029 | 2 |
| D | 0 | 28724 | 2 |
| Quadrant | Total seconds | Saturated seconds | Saturation percentage |
|---|---|---|---|
| A | 7046 | 34 | 0.482543% |
| B | 7046 | 2606 | 36.985524% |
| C | 7046 | 99 | 1.405053% |
| D | 7046 | 750 | 10.644337% |
Noise dominated data is calculated using 1-second bins in cleaned event files. If a bin has >2000 counts, and if more than 50% of those come from <1% of pixels, then it is considered to be noise-dominated and hence unusable.
| Quadrant | # 1 sec bins | Bins with >0 counts | Bins with >2000 counts | High rate bins dominated by noise | Noise dominated (total time) | Noise dominated (detector-on time) | Marked lightcurve |
|---|---|---|---|---|---|---|---|
| A | 7881 | 7047 | 0 | 0 | 0.00% | 0.00% | 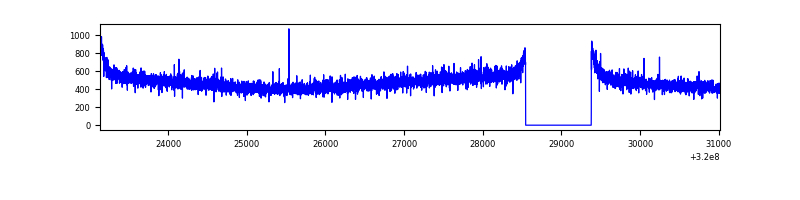 |
| B | 7881 | 7047 | 1826 | 1826 | 23.17% | 25.91% | 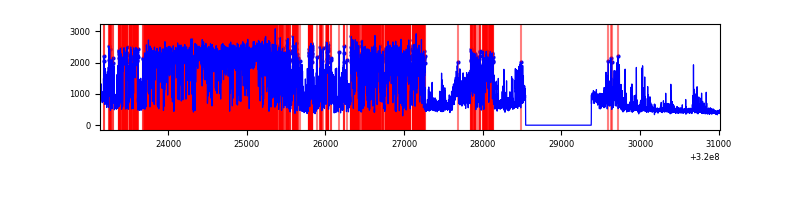 |
| C | 7881 | 7046 | 0 | 0 | 0.00% | 0.00% | 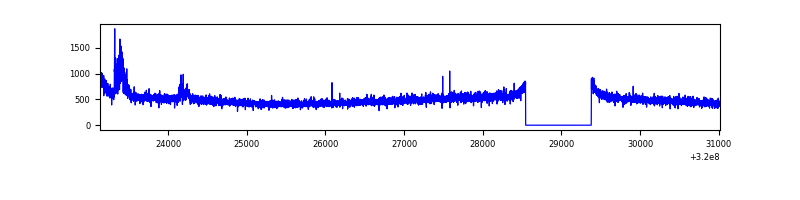 |
| D | 7881 | 7046 | 701 | 701 | 8.89% | 9.95% | 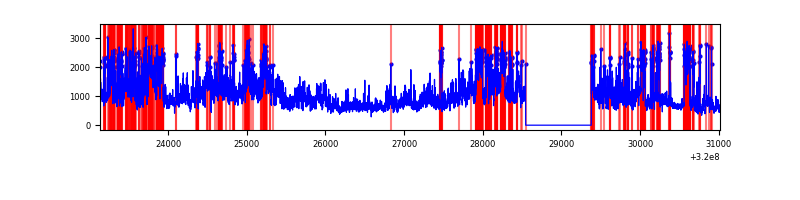 |
Top three noisy pixels from each quadrant. If the there are fewer than three noisy pixels in the level2.evt file, extra rows are filled as -1
| Pixel properties | Quadrant properties | ||||||
|---|---|---|---|---|---|---|---|
| Quadrant | DetID | PixID | Counts | Sigma | Mean | Median | Sigma |
| A | 13 | 254 | 11826 | 62.47 | 873 | 856 | 175.6 |
| A | 3 | 137 | 7704 | 39.0 | 873 | 856 | 175.6 |
| A | 0 | 226 | 7540 | 38.06 | 873 | 856 | 175.6 |
| B | 3 | 64 | 6326114 | 44111.93 | 750 | 731 | 143.4 |
| B | 12 | 111 | 16927 | 112.95 | 750 | 731 | 143.4 |
| B | 11 | 111 | 14802 | 98.13 | 750 | 731 | 143.4 |
| C | 14 | 238 | 136642 | 679.61 | 853 | 859 | 199.8 |
| C | 7 | 247 | 97785 | 485.13 | 853 | 859 | 199.8 |
| C | 13 | 61 | 5776 | 24.61 | 853 | 859 | 199.8 |
| D | 8 | 195 | 3241339 | 16159.64 | 825 | 802 | 200.5 |
| D | 13 | 174 | 930025 | 4633.77 | 825 | 802 | 200.5 |
| D | 1 | 52 | 648341 | 3229.09 | 825 | 802 | 200.5 |
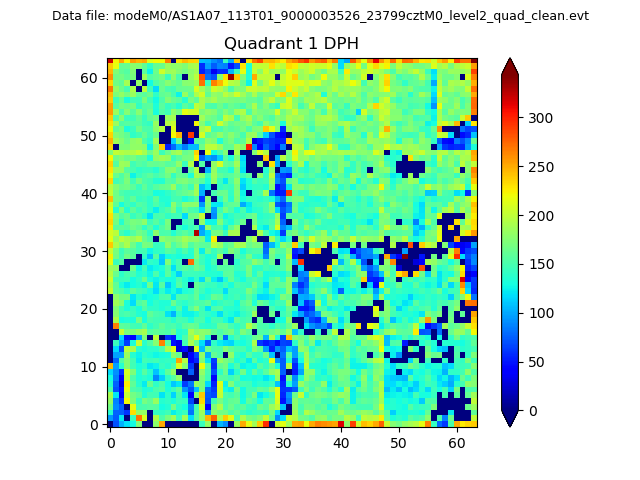
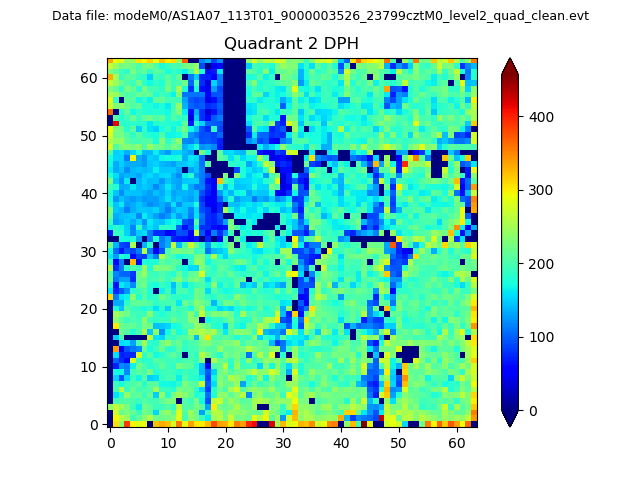
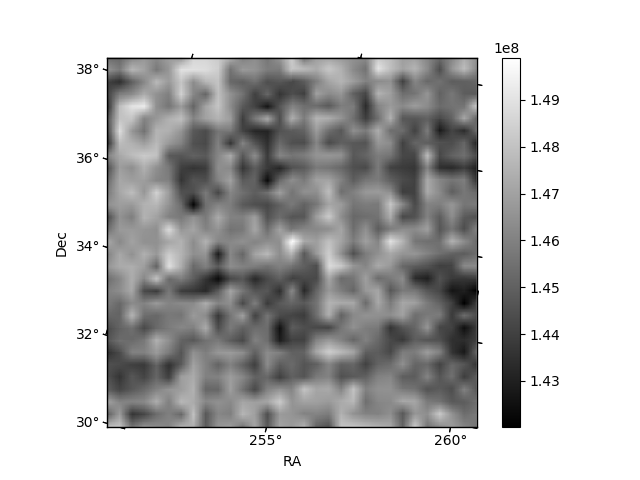
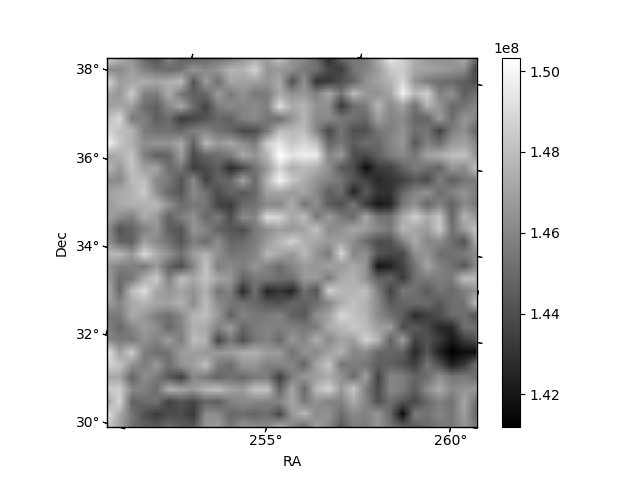
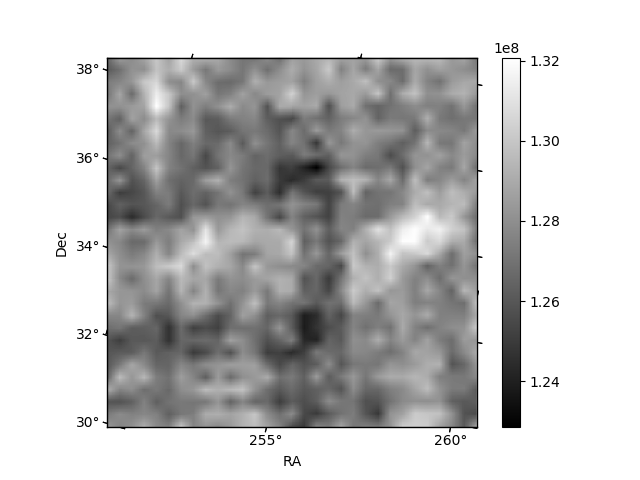
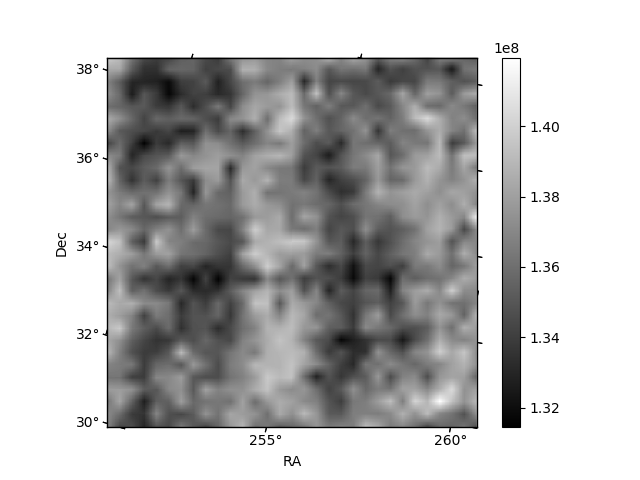
Histogram calculated using DETX and DETY for each event in the final _common_clean file
| Quadrant A |  |
 |
Quadrant B |
|---|---|---|---|
| Quadrant D |  |
 |
Quadrant C |
| Plot type | Count rate plots | Images |
|---|---|---|
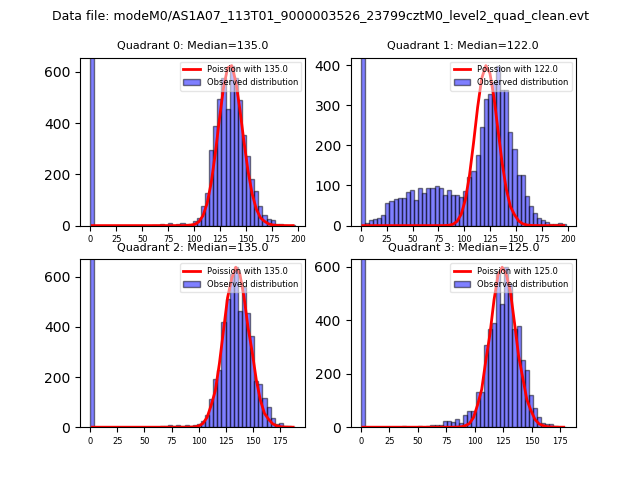
| Comparison with Poisson distribution Blue bars denote a histogram of data divided into 1 sec bins. Red curve is a Poisson curve with rate = median count rate of data. |
 |
 |
| Quadrant-wise count rates Data is divided into 100 sec bins |
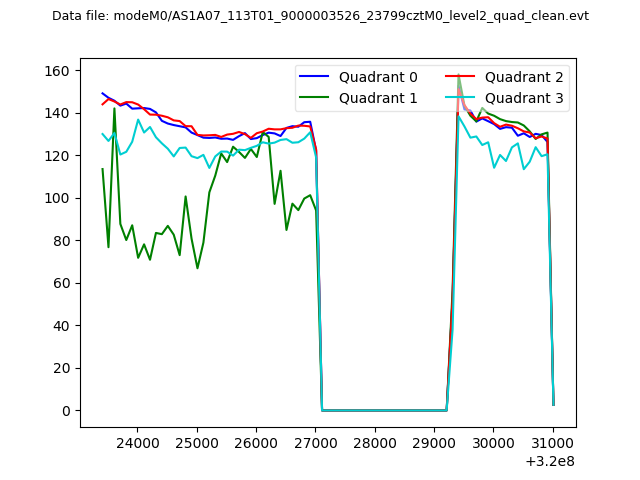 |
|
| Module-wise count rates for Quadrant A Data is divided into 100 sec bins |
 |
 |
| Module-wise count rates for Quadrant B Data is divided into 100 sec bins |
 |
 |
| Module-wise count rates for Quadrant C Data is divided into 100 sec bins |
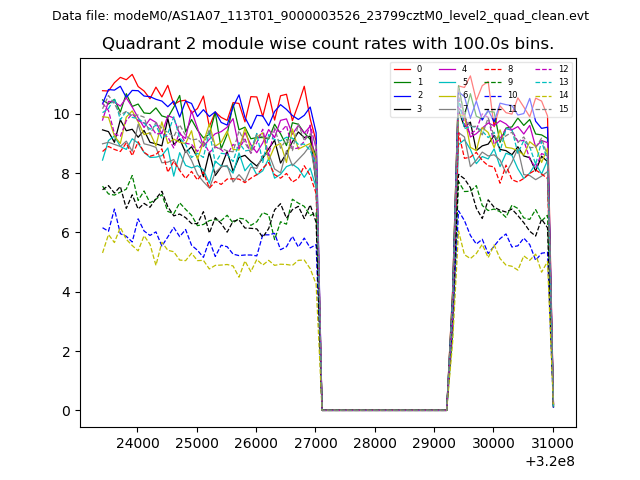 |
 |
| Module-wise count rates for Quadrant D Data is divided into 100 sec bins |
 |
 |
| Parameter | Plot |
|---|---|
| CZT HV Monitor | 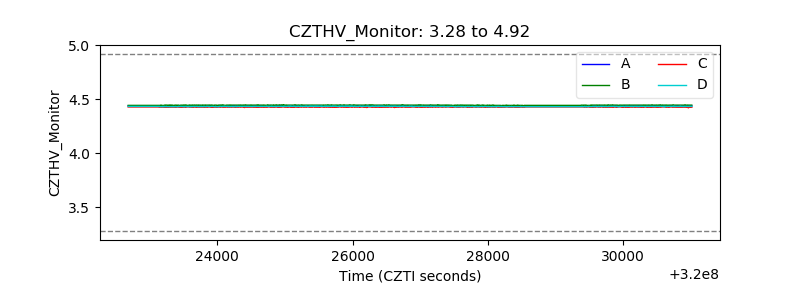 |
| D_VDD | 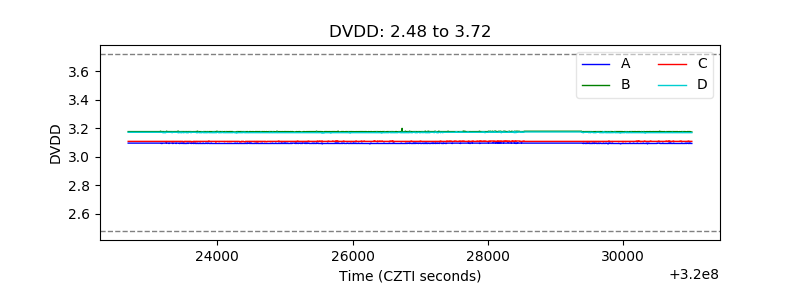 |
| Temperature 1 | 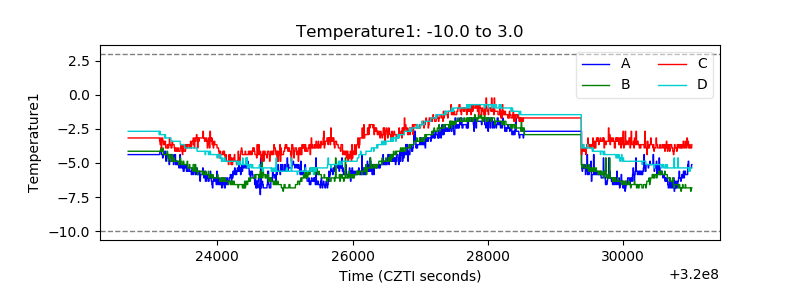 |
| Veto HV Monitor | 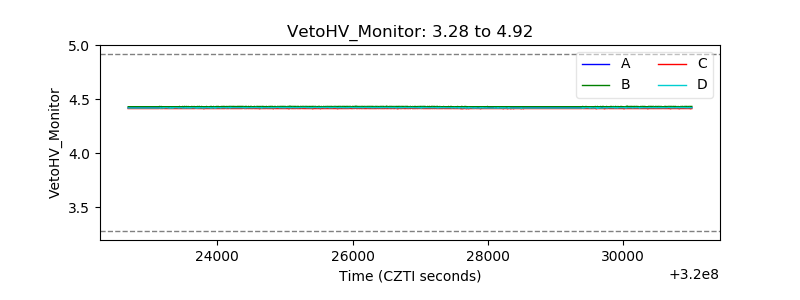 |
| Veto LLD | 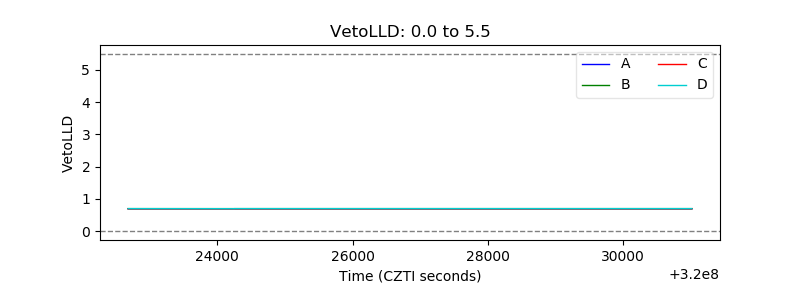 |
| Alpha Counter | 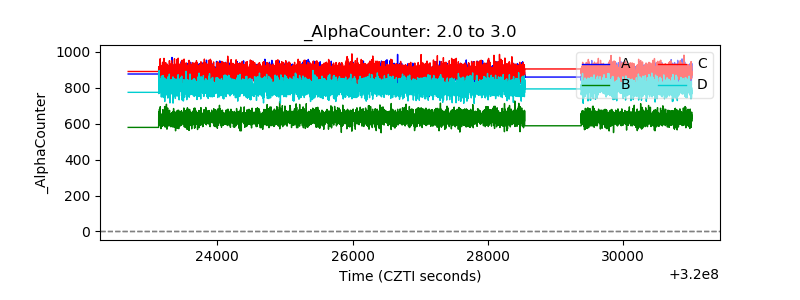 |
| _CPM_Rate | 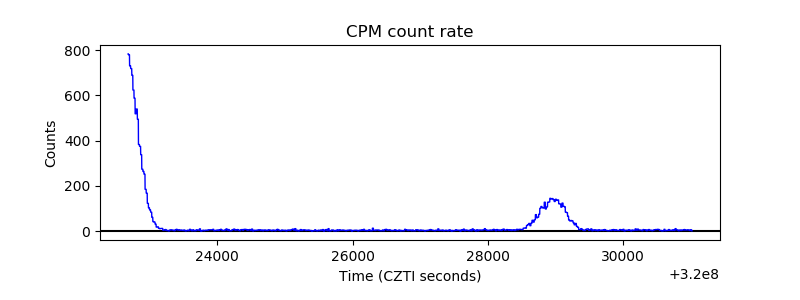 |
| CZT Counter | 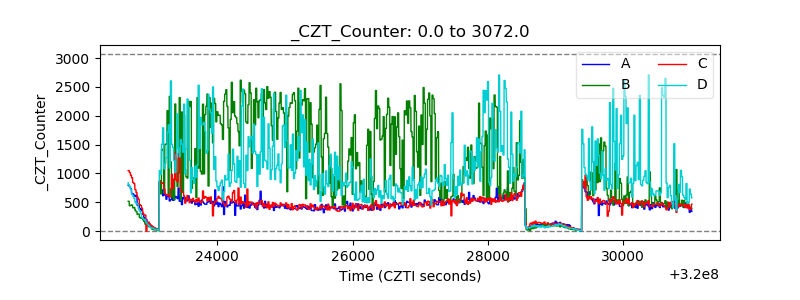 |
| +2.5 Volts monitor |  |
| +5 Volts monitor |  |
| _ROLL_ROT | 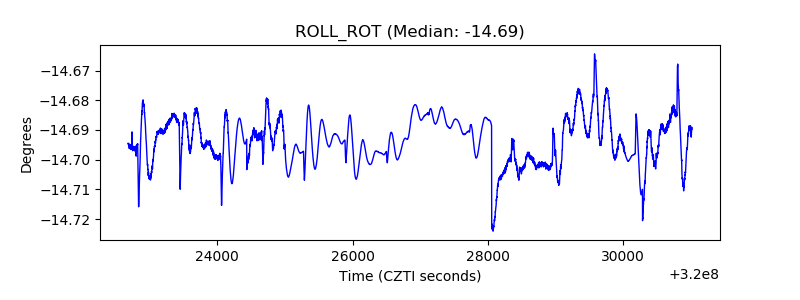 |
| _Roll_DEC | 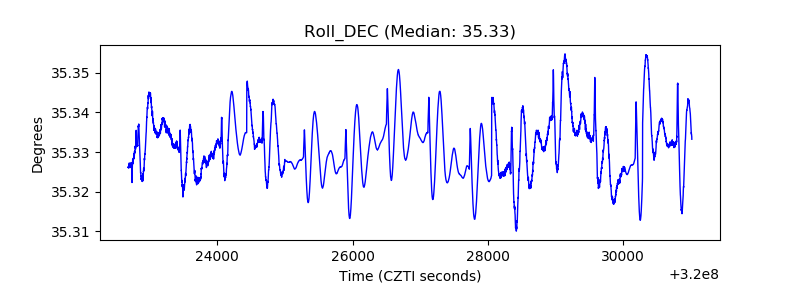 |
| _Roll_RA | 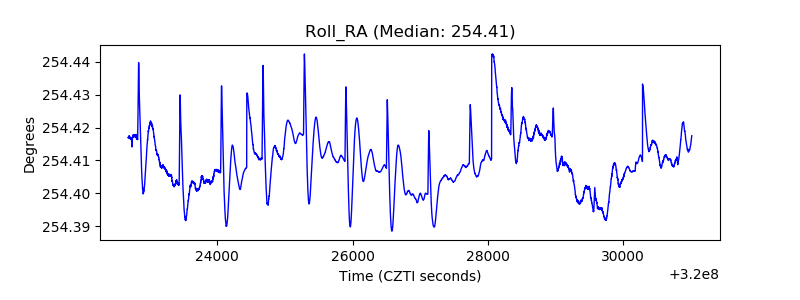 |
| Veto Counter | 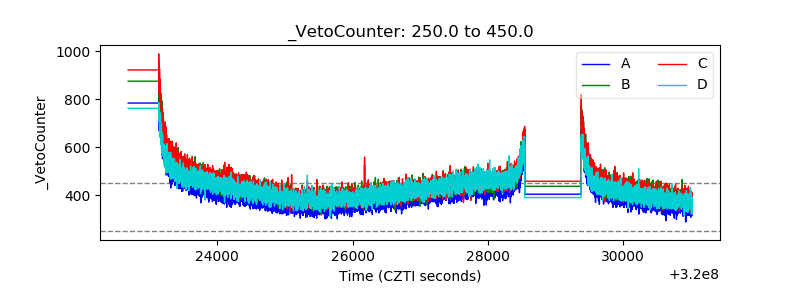 |