| Param | Original file | Final file |
|---|---|---|
| Filename | modeM0/AS1A07_113T01_9000003526_23800cztM0_level2.evt | modeM0/AS1A07_113T01_9000003526_23800cztM0_level2_quad_clean.evt |
| Size (bytes) | 702,478,080 | 99,650,880 |
| Size | 669.9 MB | 95.0 MB |
| Events in quadrant A | 3,377,642 | 643,827 |
| Events in quadrant B | 3,827,047 | 659,869 |
| Events in quadrant C | 3,462,536 | 645,282 |
| Events in quadrant D | 10,128,116 | 575,241 |
| Mode M9 | |||
|---|---|---|---|
| Quadrant | BADHDUFLAG | Total packets | Discarded packets |
| A | 0 | 3 | 0 |
| B | 0 | 3 | 0 |
| C | 0 | 3 | 0 |
| D | 0 | 3 | 0 |
| Mode SS | |||
|---|---|---|---|
| Quadrant | BADHDUFLAG | Total packets | Discarded packets |
| A | 0 | 142 | 0 |
| B | 0 | 142 | 0 |
| C | 0 | 142 | 0 |
| D | 0 | 142 | 0 |
| Mode M0 | |||
|---|---|---|---|
| Quadrant | BADHDUFLAG | Total packets | Discarded packets |
| A | 0 | 14742 | 1 |
| B | 0 | 16093 | 1 |
| C | 0 | 14831 | 1 |
| D | 0 | 35060 | 1 |
| Quadrant | Total seconds | Saturated seconds | Saturation percentage |
|---|---|---|---|
| A | 7087 | 81 | 1.142938% |
| B | 7088 | 167 | 2.356095% |
| C | 7088 | 138 | 1.946953% |
| D | 7088 | 2117 | 29.867381% |
Noise dominated data is calculated using 1-second bins in cleaned event files. If a bin has >2000 counts, and if more than 50% of those come from <1% of pixels, then it is considered to be noise-dominated and hence unusable.
| Quadrant | # 1 sec bins | Bins with >0 counts | Bins with >2000 counts | High rate bins dominated by noise | Noise dominated (total time) | Noise dominated (detector-on time) | Marked lightcurve |
|---|---|---|---|---|---|---|---|
| A | 7362 | 7087 | 0 | 0 | 0.00% | 0.00% | 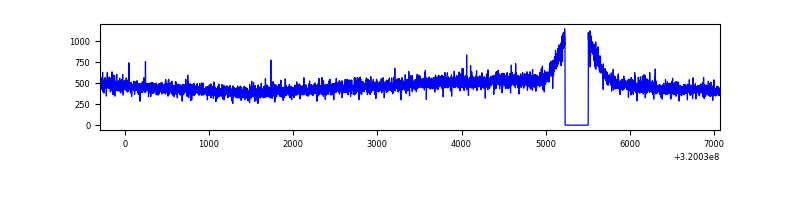 |
| B | 7363 | 7088 | 2 | 2 | 0.03% | 0.03% | 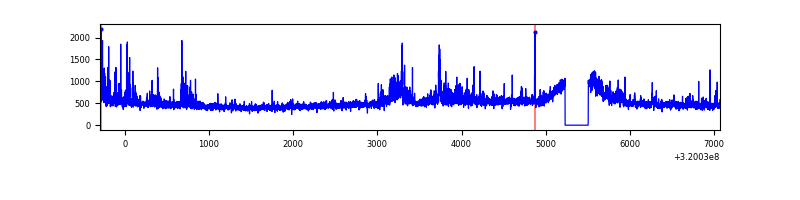 |
| C | 7363 | 7089 | 0 | 0 | 0.00% | 0.00% | 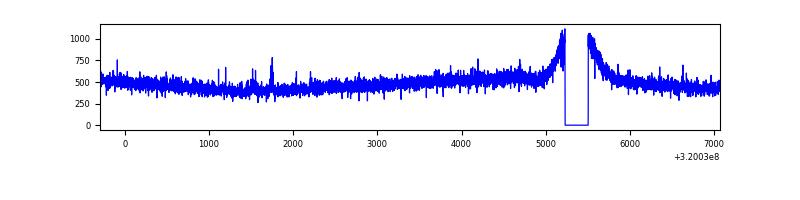 |
| D | 7363 | 7088 | 1875 | 1875 | 25.47% | 26.45% | 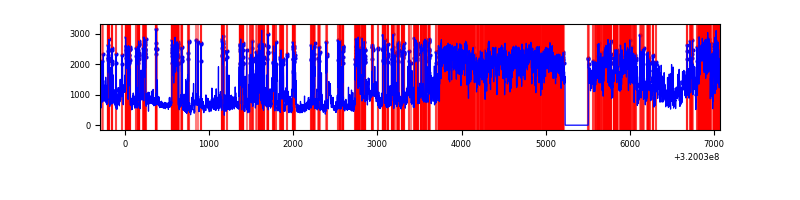 |
Top three noisy pixels from each quadrant. If the there are fewer than three noisy pixels in the level2.evt file, extra rows are filled as -1
| Pixel properties | Quadrant properties | ||||||
|---|---|---|---|---|---|---|---|
| Quadrant | DetID | PixID | Counts | Sigma | Mean | Median | Sigma |
| A | 13 | 254 | 11887 | 61.72 | 876 | 859 | 178.7 |
| A | 3 | 137 | 7813 | 38.92 | 876 | 859 | 178.7 |
| A | 0 | 226 | 7583 | 37.63 | 876 | 859 | 178.7 |
| B | 3 | 64 | 368059 | 2152.55 | 879 | 855 | 170.6 |
| B | 12 | 111 | 20700 | 116.33 | 879 | 855 | 170.6 |
| B | 11 | 111 | 18146 | 101.36 | 879 | 855 | 170.6 |
| C | 14 | 238 | 133663 | 659.33 | 850 | 856 | 201.4 |
| C | 7 | 247 | 13589 | 63.21 | 850 | 856 | 201.4 |
| C | 13 | 61 | 6042 | 25.74 | 850 | 856 | 201.4 |
| D | 8 | 195 | 4886185 | 25870.05 | 772 | 750 | 188.8 |
| D | 13 | 174 | 1517977 | 8034.24 | 772 | 750 | 188.8 |
| D | 1 | 52 | 716053 | 3787.77 | 772 | 750 | 188.8 |
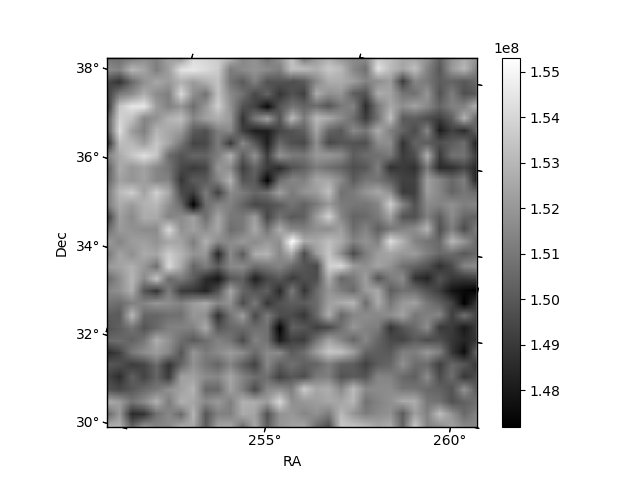
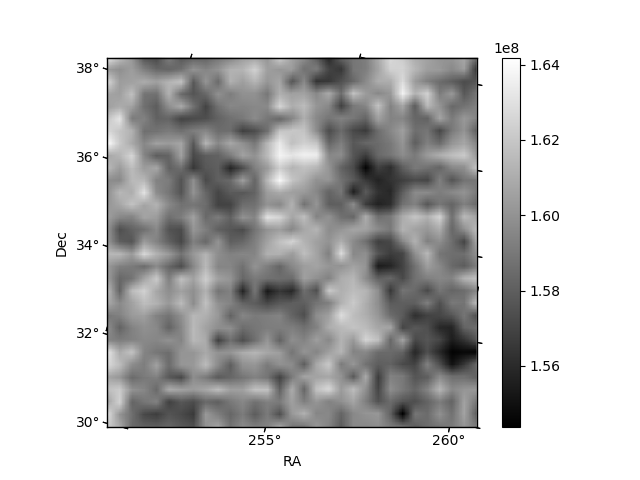
Histogram calculated using DETX and DETY for each event in the final _common_clean file
| Quadrant A | 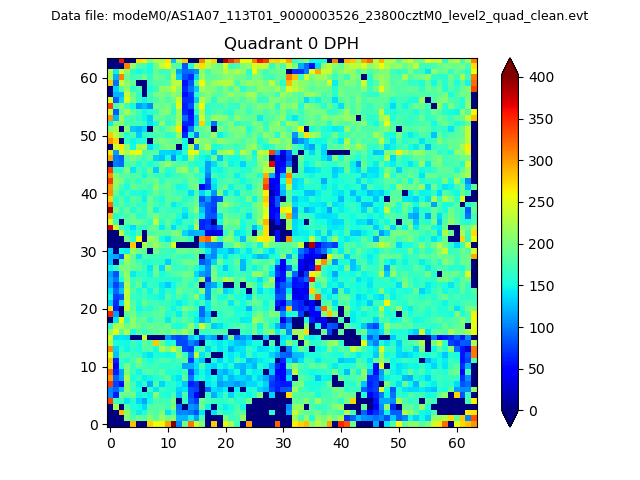 |
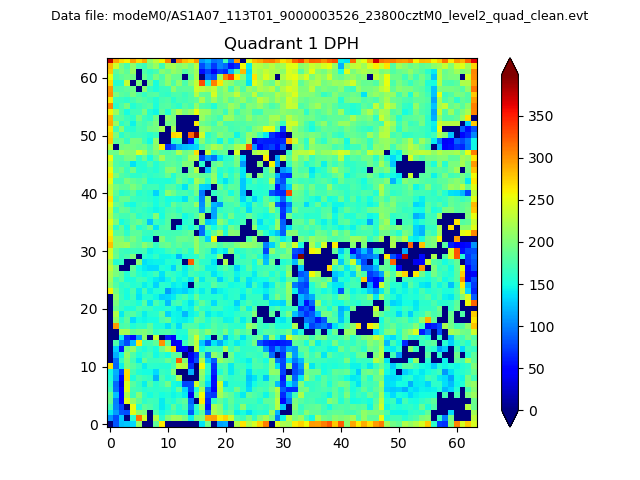 |
Quadrant B |
|---|---|---|---|
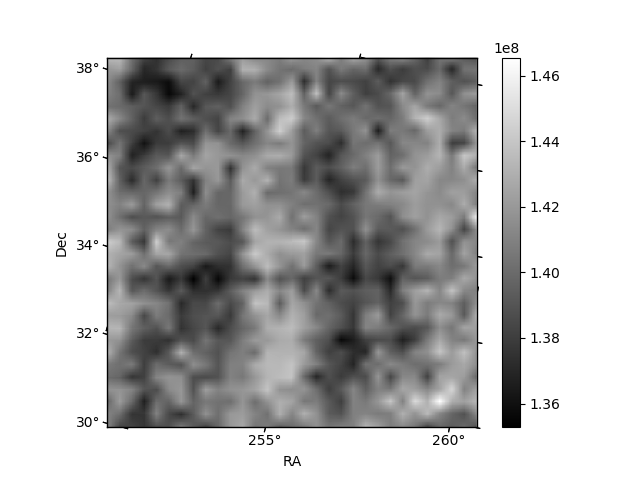
| Quadrant D |  |
 |
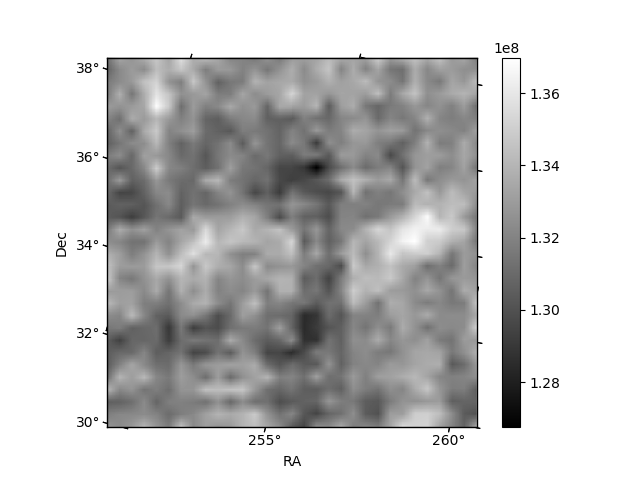
Quadrant C |
| Plot type | Count rate plots | Images |
|---|---|---|
| Comparison with Poisson distribution Blue bars denote a histogram of data divided into 1 sec bins. Red curve is a Poisson curve with rate = median count rate of data. |
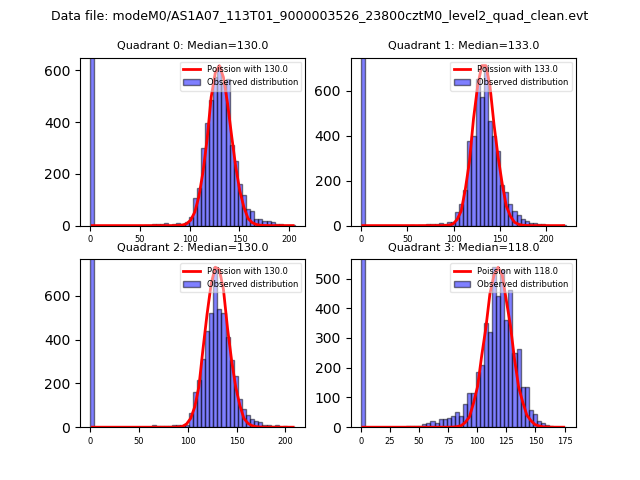 |
 |
| Quadrant-wise count rates Data is divided into 100 sec bins |
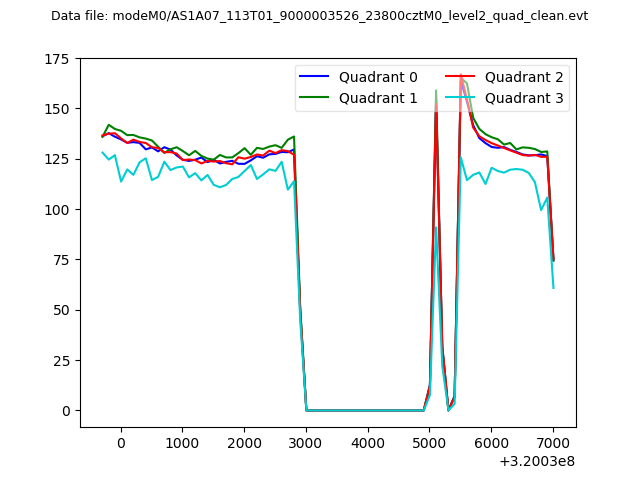 |
|
| Module-wise count rates for Quadrant A Data is divided into 100 sec bins |
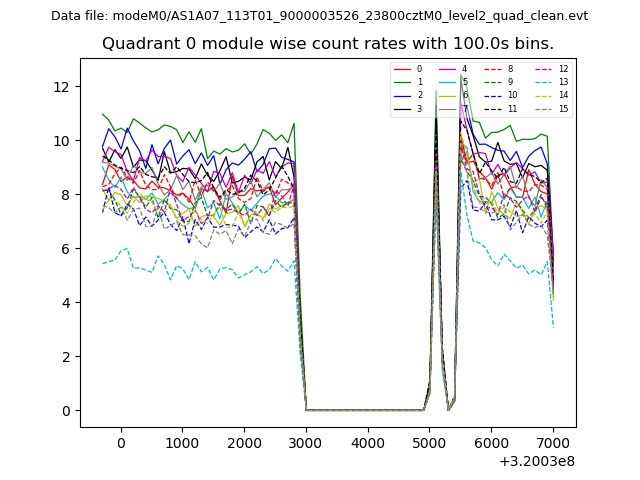 |
 |
| Module-wise count rates for Quadrant B Data is divided into 100 sec bins |
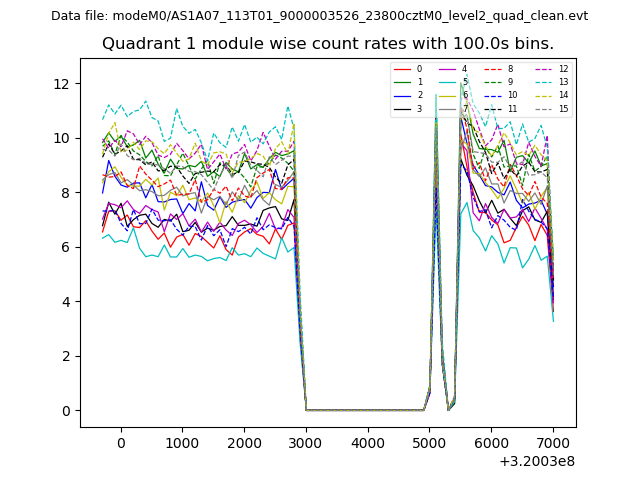 |
 |
| Module-wise count rates for Quadrant C Data is divided into 100 sec bins |
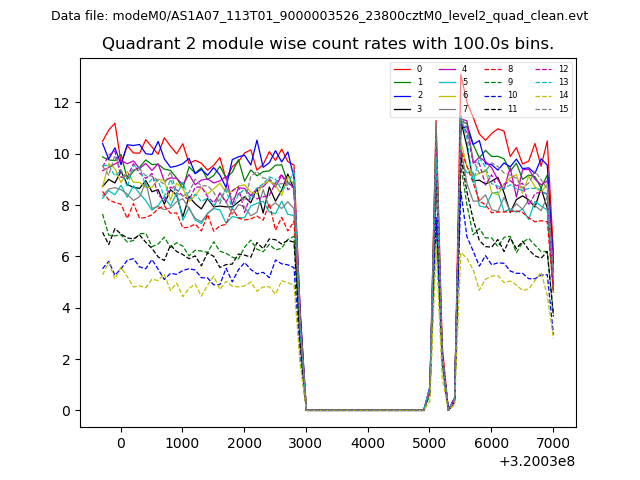 |
 |
| Module-wise count rates for Quadrant D Data is divided into 100 sec bins |
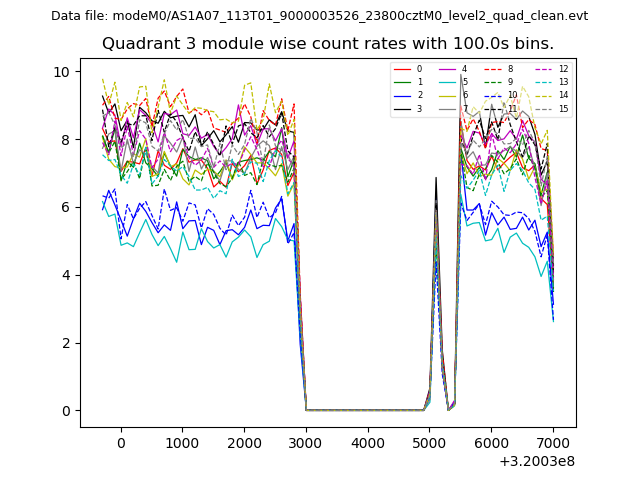 |
 |
| Parameter | Plot |
|---|---|
| CZT HV Monitor | 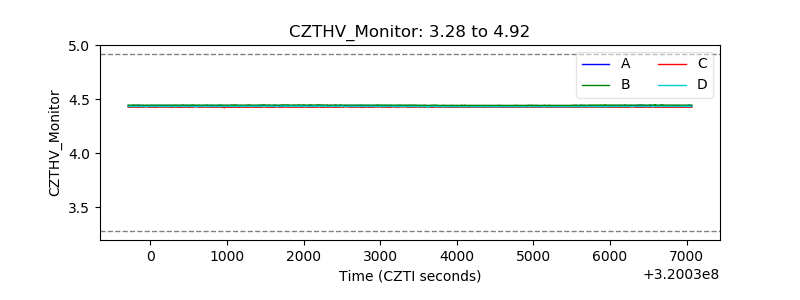 |
| D_VDD | 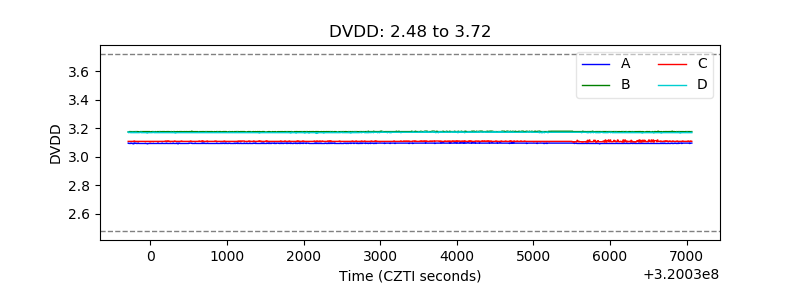 |
| Temperature 1 | 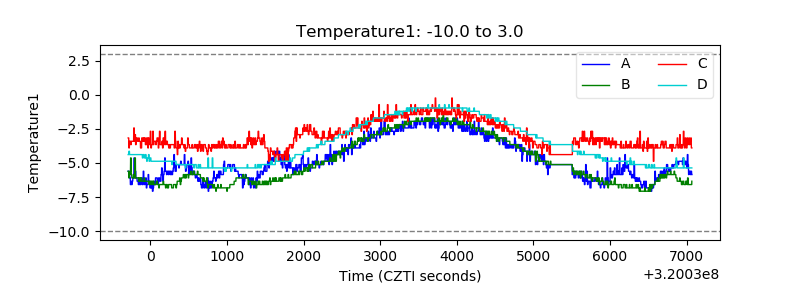 |
| Veto HV Monitor | 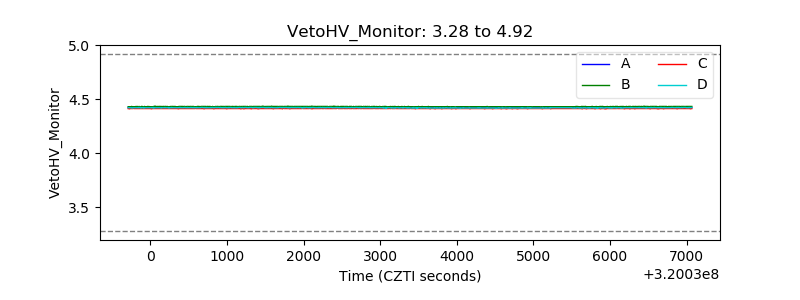 |
| Veto LLD | 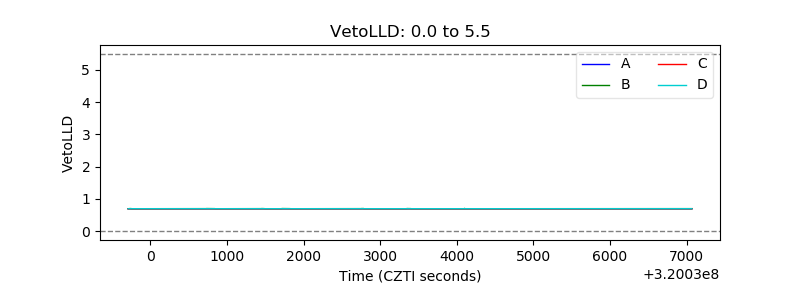 |
| Alpha Counter | 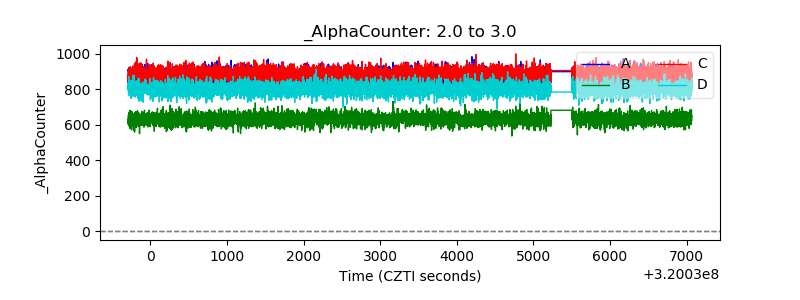 |
| _CPM_Rate | 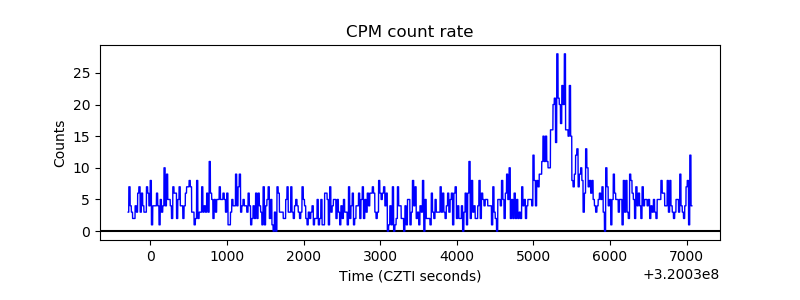 |
| CZT Counter |  |
| +2.5 Volts monitor |  |
| +5 Volts monitor |  |
| _ROLL_ROT | 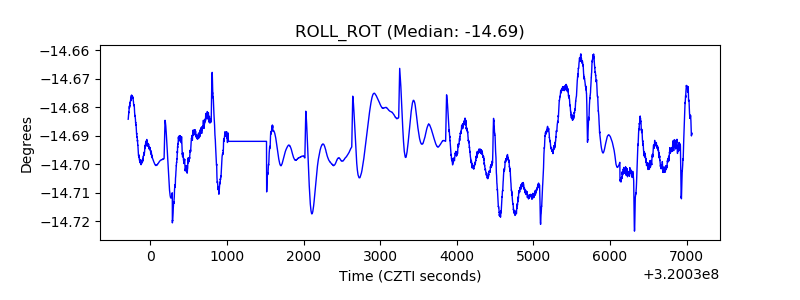 |
| _Roll_DEC |  |
| _Roll_RA | 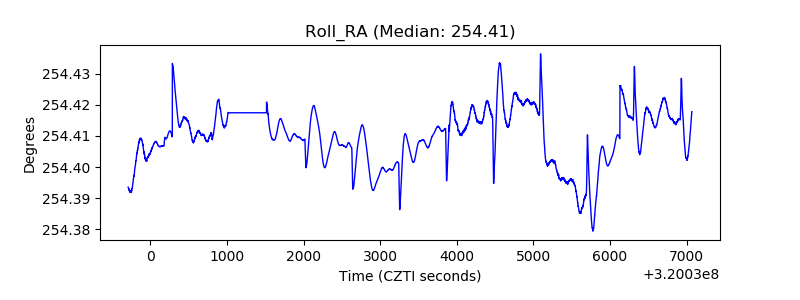 |
| Veto Counter | 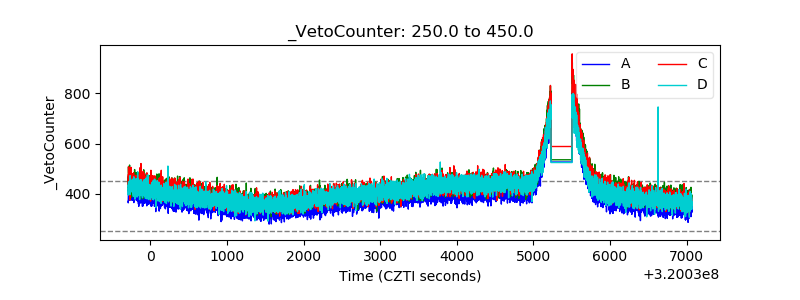 |