| Param | Original file | Final file |
|---|---|---|
| Filename | modeM0/AS1A07_113T01_9000003526_23804cztM0_level2.evt | modeM0/AS1A07_113T01_9000003526_23804cztM0_level2_quad_clean.evt |
| Size (bytes) | 1,455,696,000 | 153,653,760 |
| Size | 1.4 GB | 146.5 MB |
| Events in quadrant A | 5,753,651 | 1,012,987 |
| Events in quadrant B | 6,133,886 | 1,043,378 |
| Events in quadrant C | 5,903,370 | 1,012,201 |
| Events in quadrant D | 25,460,982 | 728,027 |
| Mode M9 | |||
|---|---|---|---|
| Quadrant | BADHDUFLAG | Total packets | Discarded packets |
| A | 0 | 11 | 0 |
| B | 0 | 11 | 0 |
| C | 0 | 11 | 0 |
| D | 0 | 11 | 0 |
| Mode SS | |||
|---|---|---|---|
| Quadrant | BADHDUFLAG | Total packets | Discarded packets |
| A | 0 | 255 | 3 |
| B | 0 | 256 | 4 |
| C | 0 | 255 | 1 |
| D | 0 | 256 | 4 |
| Mode M0 | |||
|---|---|---|---|
| Quadrant | BADHDUFLAG | Total packets | Discarded packets |
| A | 0 | 25511 | 414 |
| B | 0 | 26401 | 398 |
| C | 0 | 25708 | 422 |
| D | 0 | 85185 | 1161 |
| Quadrant | Total seconds | Saturated seconds | Saturation percentage |
|---|---|---|---|
| A | 12365 | 158 | 1.277800% |
| B | 12368 | 202 | 1.633247% |
| C | 12367 | 204 | 1.649551% |
| D | 12337 | 8270 | 67.034125% |
Noise dominated data is calculated using 1-second bins in cleaned event files. If a bin has >2000 counts, and if more than 50% of those come from <1% of pixels, then it is considered to be noise-dominated and hence unusable.
| Quadrant | # 1 sec bins | Bins with >0 counts | Bins with >2000 counts | High rate bins dominated by noise | Noise dominated (total time) | Noise dominated (detector-on time) | Marked lightcurve |
|---|---|---|---|---|---|---|---|
| A | 13721 | 12395 | 0 | 0 | 0.00% | 0.00% | 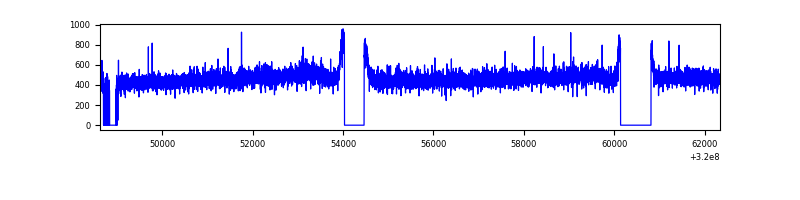 |
| B | 13722 | 12394 | 23 | 23 | 0.17% | 0.19% | 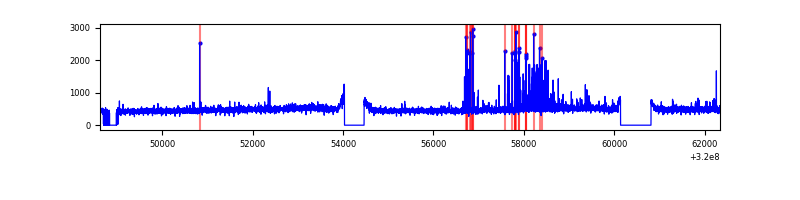 |
| C | 13722 | 12394 | 1 | 1 | 0.01% | 0.01% | 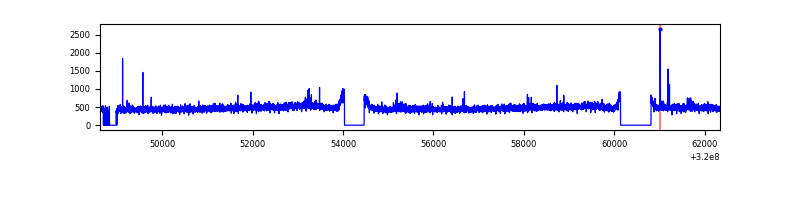 |
| D | 13720 | 12351 | 8130 | 8130 | 59.26% | 65.82% | 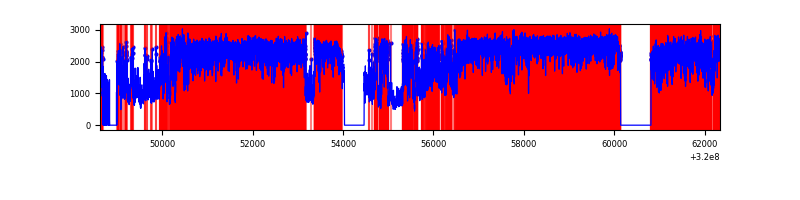 |
Top three noisy pixels from each quadrant. If the there are fewer than three noisy pixels in the level2.evt file, extra rows are filled as -1
| Pixel properties | Quadrant properties | ||||||
|---|---|---|---|---|---|---|---|
| Quadrant | DetID | PixID | Counts | Sigma | Mean | Median | Sigma |
| A | 13 | 254 | 20695 | 63.92 | 1491 | 1458 | 301.0 |
| A | 3 | 137 | 13547 | 40.17 | 1491 | 1458 | 301.0 |
| A | 0 | 226 | 13064 | 38.56 | 1491 | 1458 | 301.0 |
| B | 3 | 64 | 237545 | 818.87 | 1488 | 1450 | 288.3 |
| B | 4 | 216 | 36612 | 121.96 | 1488 | 1450 | 288.3 |
| B | 12 | 111 | 35011 | 116.4 | 1488 | 1450 | 288.3 |
| C | 14 | 238 | 227734 | 670.33 | 1439 | 1449 | 337.6 |
| C | 7 | 247 | 33821 | 95.9 | 1439 | 1449 | 337.6 |
| C | 2 | 16 | 27128 | 76.07 | 1439 | 1449 | 337.6 |
| D | 8 | 195 | 16380209 | 61300.69 | 1095 | 1061 | 267.2 |
| D | 13 | 174 | 3933854 | 14718.89 | 1095 | 1061 | 267.2 |
| D | 1 | 52 | 877518 | 3280.23 | 1095 | 1061 | 267.2 |
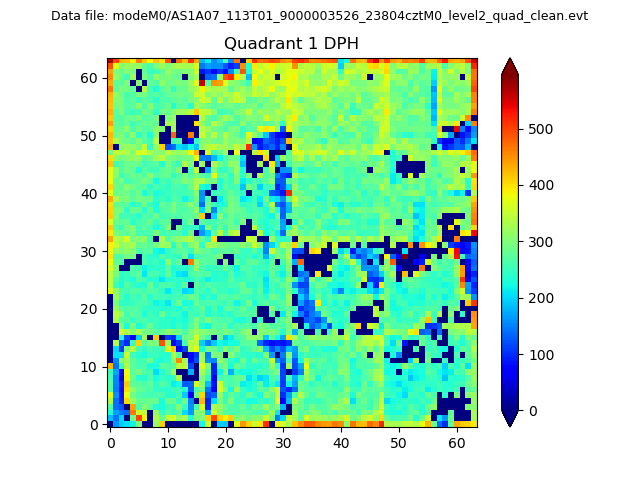
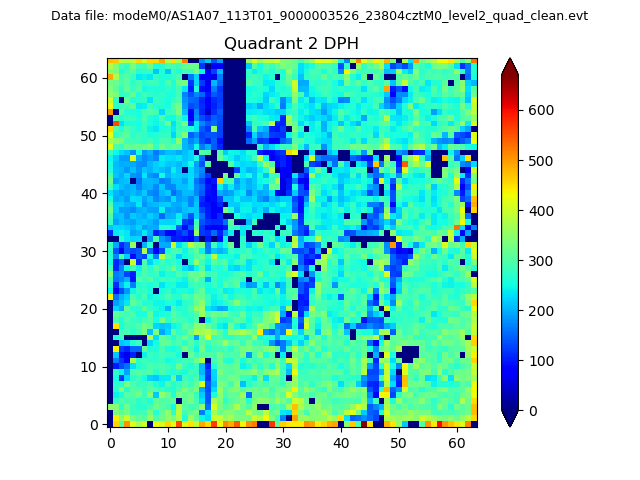
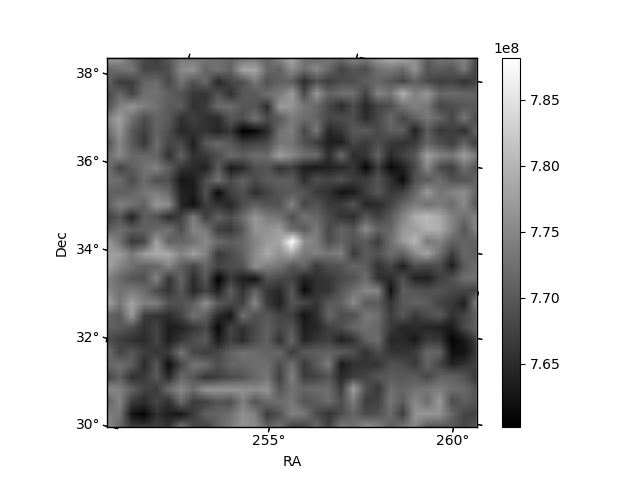
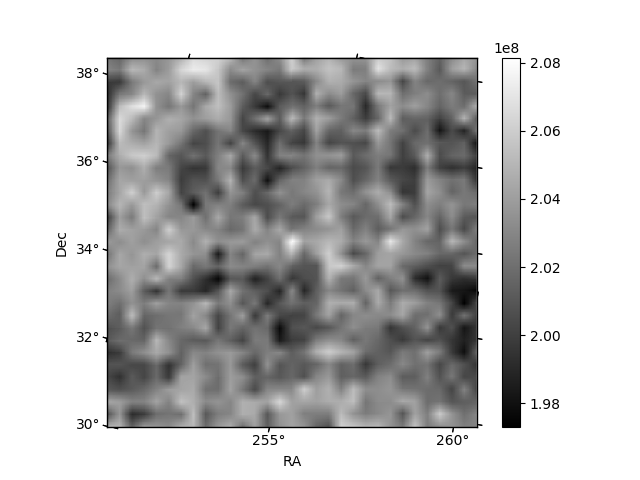
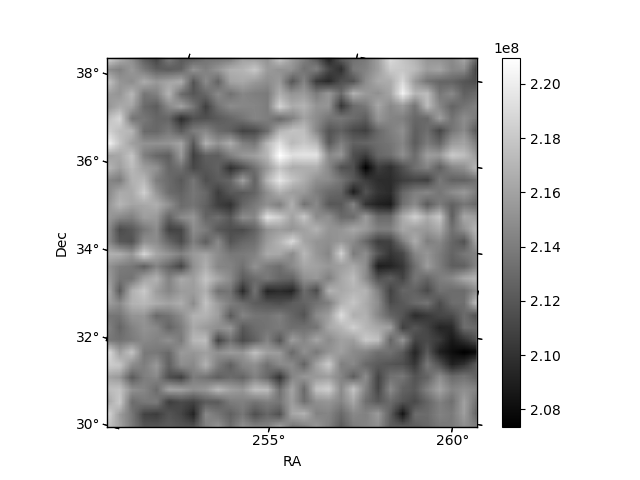
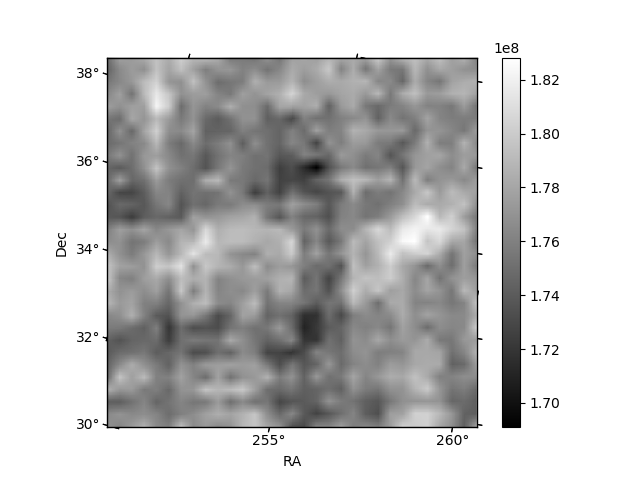
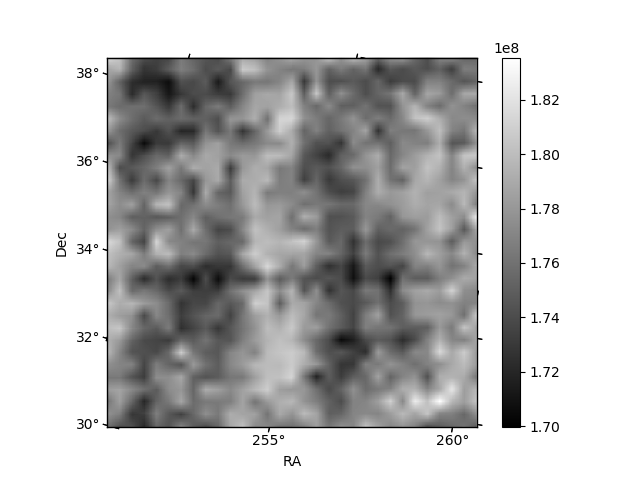
Histogram calculated using DETX and DETY for each event in the final _common_clean file
| Quadrant A |  |
 |
Quadrant B |
|---|---|---|---|
| Quadrant D | 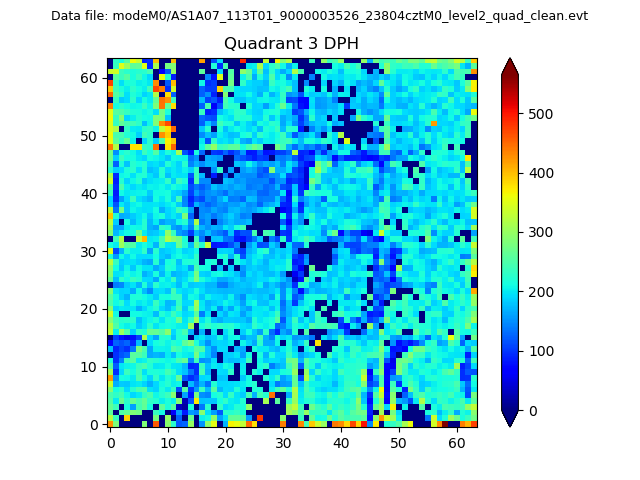 |
 |
Quadrant C |
| Plot type | Count rate plots | Images |
|---|---|---|
| Comparison with Poisson distribution Blue bars denote a histogram of data divided into 1 sec bins. Red curve is a Poisson curve with rate = median count rate of data. |
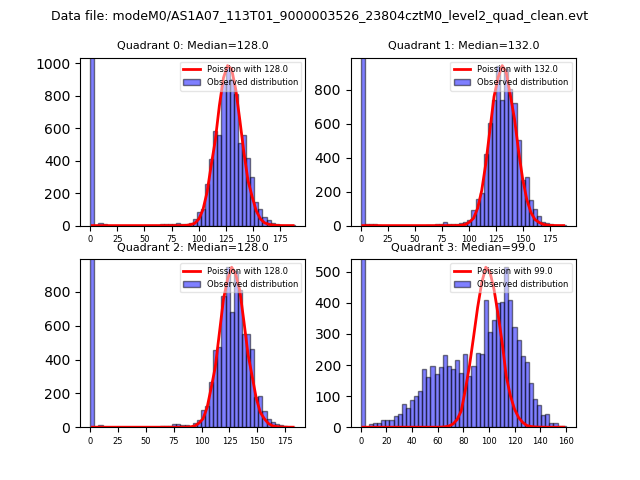 |
 |
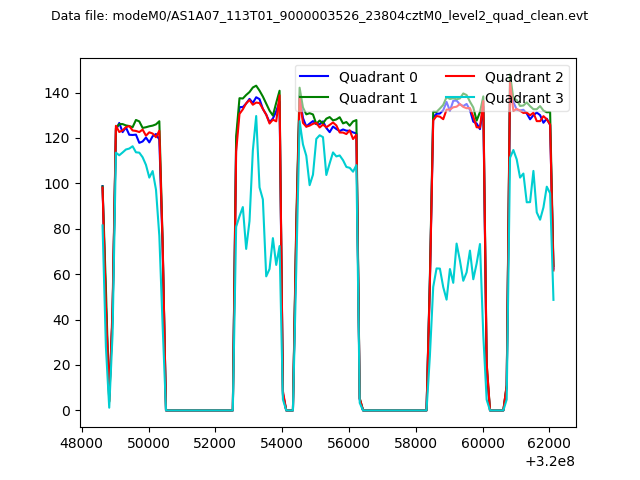
| Quadrant-wise count rates Data is divided into 100 sec bins |
 |
|
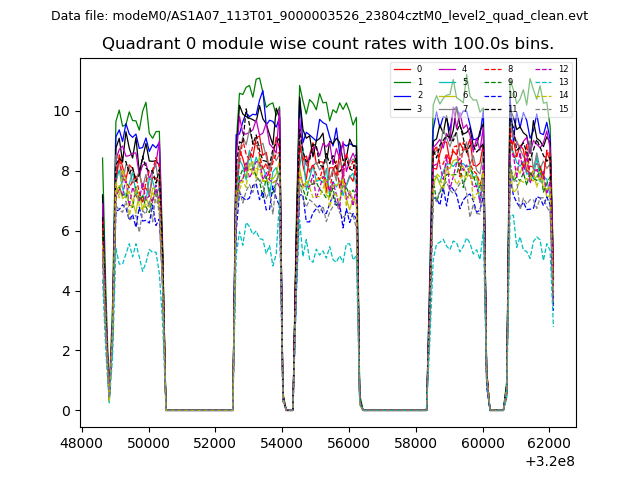
| Module-wise count rates for Quadrant A Data is divided into 100 sec bins |
 |
 |
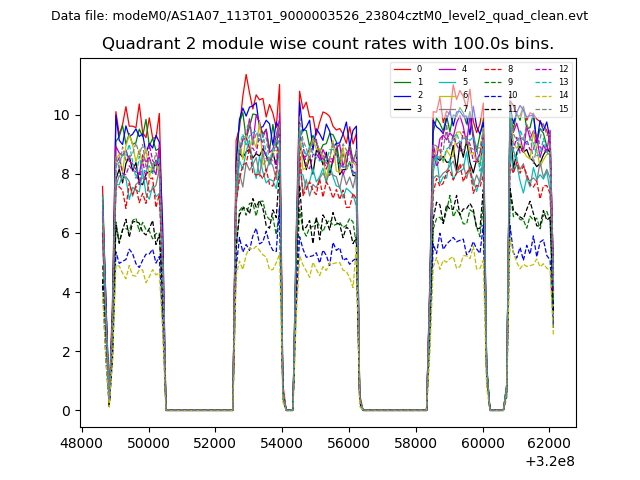
| Module-wise count rates for Quadrant B Data is divided into 100 sec bins |
 |
 |
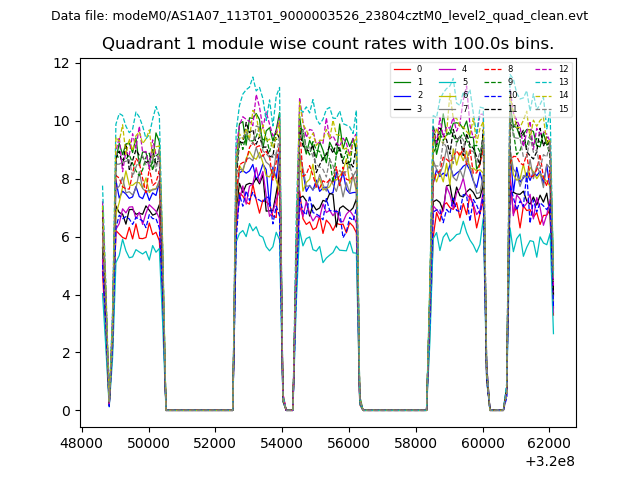
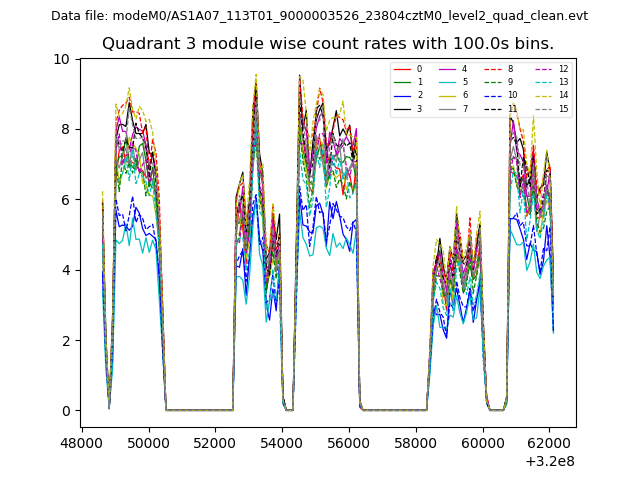
| Module-wise count rates for Quadrant C Data is divided into 100 sec bins |
 |
 |
| Module-wise count rates for Quadrant D Data is divided into 100 sec bins |
 |
 |
| Parameter | Plot |
|---|---|
| CZT HV Monitor | 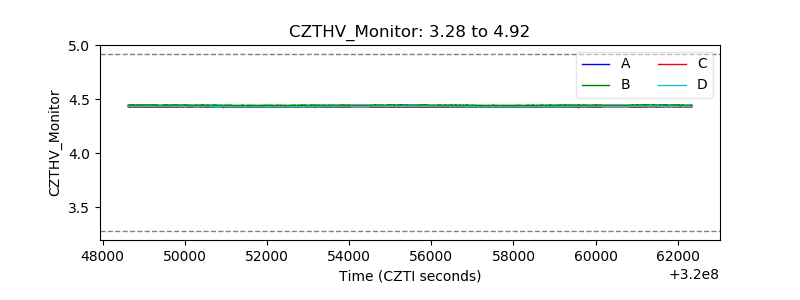 |
| D_VDD | 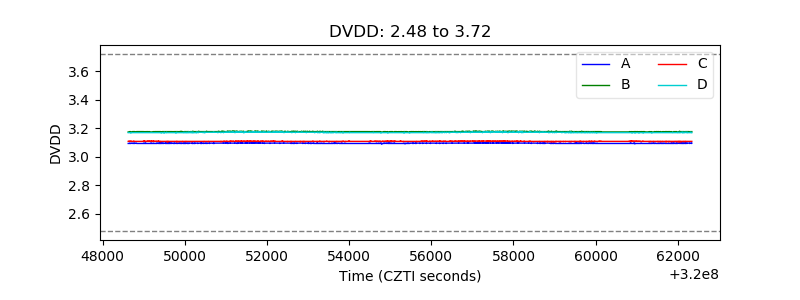 |
| Temperature 1 | 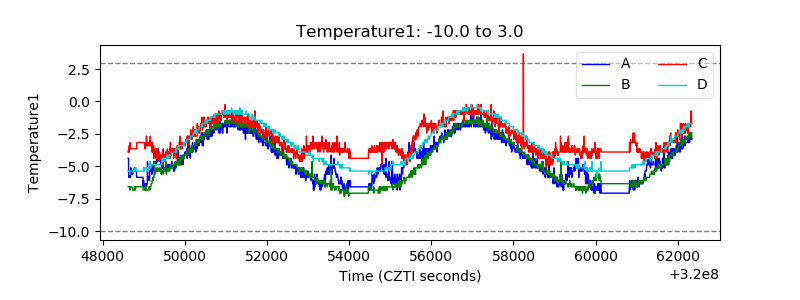 |
| Veto HV Monitor | 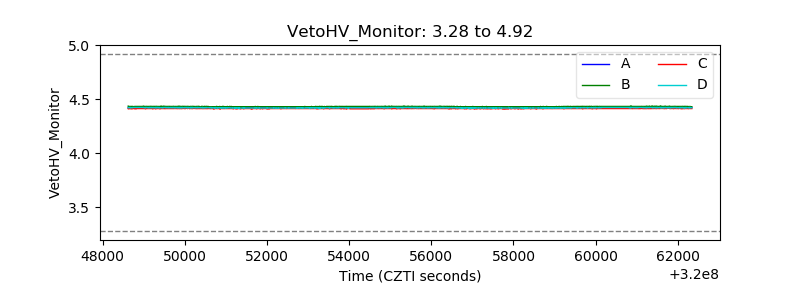 |
| Veto LLD | 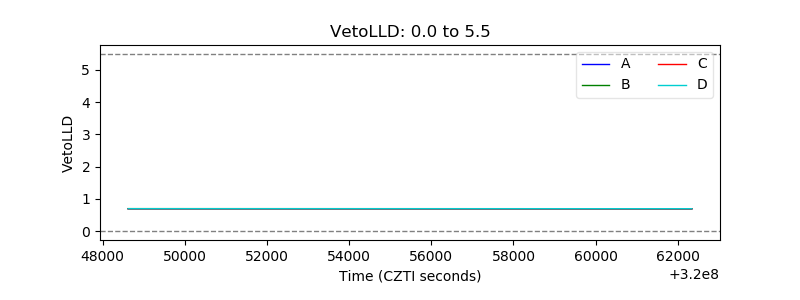 |
| Alpha Counter |  |
| _CPM_Rate | 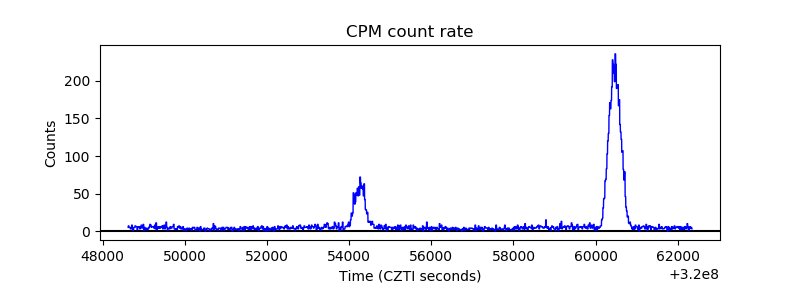 |
| CZT Counter | 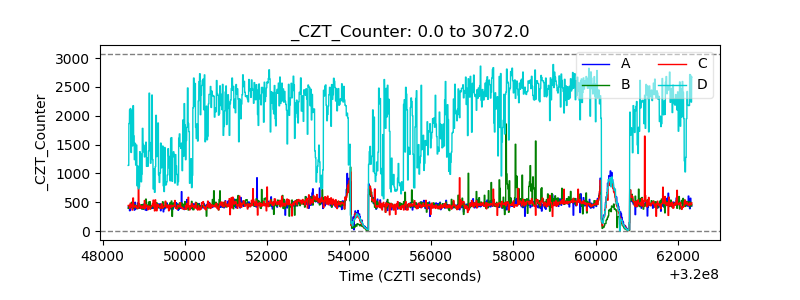 |
| +2.5 Volts monitor |  |
| +5 Volts monitor |  |
| _ROLL_ROT | 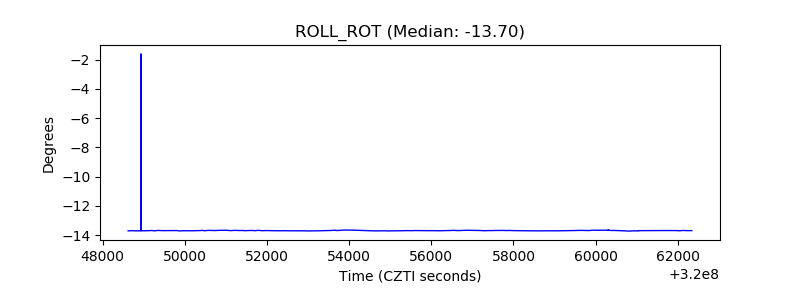 |
| _Roll_DEC | 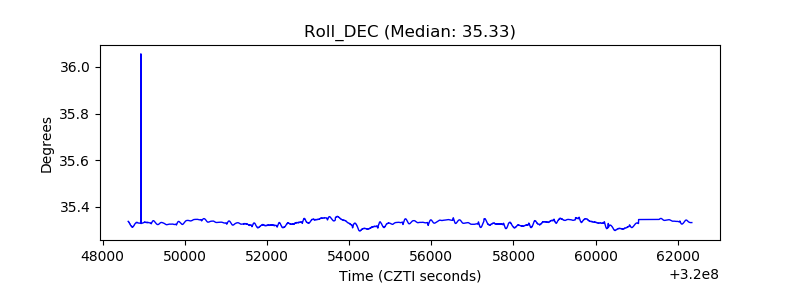 |
| _Roll_RA |  |
| Veto Counter | 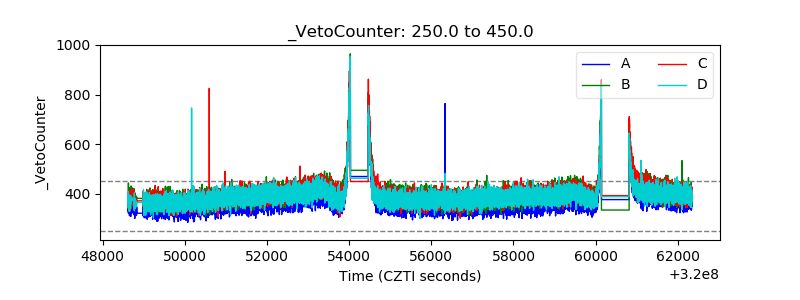 |