| Param | Original file | Final file |
|---|---|---|
| Filename | modeM0/AS1A07_113T01_9000003526_23805cztM0_level2.evt | modeM0/AS1A07_113T01_9000003526_23805cztM0_level2_quad_clean.evt |
| Size (bytes) | 789,433,920 | 70,994,880 |
| Size | 752.9 MB | 67.7 MB |
| Events in quadrant A | 2,944,048 | 477,982 |
| Events in quadrant B | 3,420,667 | 490,697 |
| Events in quadrant C | 3,074,666 | 474,693 |
| Events in quadrant D | 14,047,254 | 270,406 |
| Mode M9 | |||
|---|---|---|---|
| Quadrant | BADHDUFLAG | Total packets | Discarded packets |
| A | 0 | 9 | 0 |
| B | 0 | 9 | 0 |
| C | 0 | 9 | 0 |
| D | 0 | 9 | 0 |
| Mode SS | |||
|---|---|---|---|
| Quadrant | BADHDUFLAG | Total packets | Discarded packets |
| A | 0 | 126 | 0 |
| B | 0 | 126 | 0 |
| C | 0 | 126 | 0 |
| D | 0 | 126 | 0 |
| Mode M0 | |||
|---|---|---|---|
| Quadrant | BADHDUFLAG | Total packets | Discarded packets |
| A | 0 | 12610 | 1 |
| B | 0 | 13964 | 1 |
| C | 0 | 12878 | 1 |
| D | 0 | 45956 | 1 |
| Quadrant | Total seconds | Saturated seconds | Saturation percentage |
|---|---|---|---|
| A | 6224 | 38 | 0.610540% |
| B | 6225 | 105 | 1.686747% |
| C | 6225 | 77 | 1.236948% |
| D | 6225 | 5104 | 81.991968% |
Noise dominated data is calculated using 1-second bins in cleaned event files. If a bin has >2000 counts, and if more than 50% of those come from <1% of pixels, then it is considered to be noise-dominated and hence unusable.
| Quadrant | # 1 sec bins | Bins with >0 counts | Bins with >2000 counts | High rate bins dominated by noise | Noise dominated (total time) | Noise dominated (detector-on time) | Marked lightcurve |
|---|---|---|---|---|---|---|---|
| A | 7109 | 6224 | 0 | 0 | 0.00% | 0.00% | 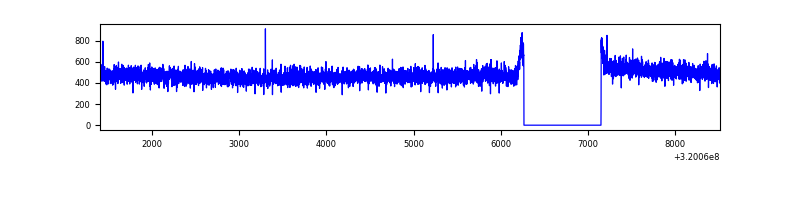 |
| B | 7110 | 6225 | 44 | 44 | 0.62% | 0.71% | 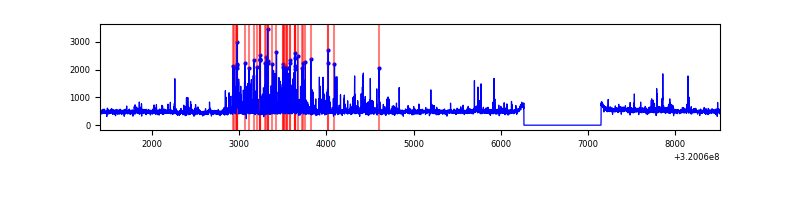 |
| C | 7110 | 6225 | 6 | 6 | 0.08% | 0.10% | 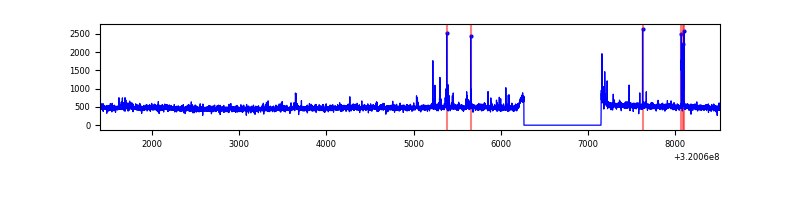 |
| D | 7110 | 6225 | 5002 | 5002 | 70.35% | 80.35% | 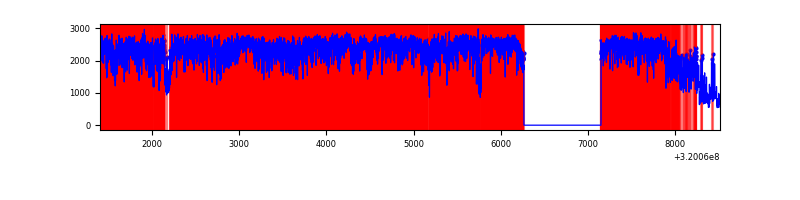 |
Top three noisy pixels from each quadrant. If the there are fewer than three noisy pixels in the level2.evt file, extra rows are filled as -1
| Pixel properties | Quadrant properties | ||||||
|---|---|---|---|---|---|---|---|
| Quadrant | DetID | PixID | Counts | Sigma | Mean | Median | Sigma |
| A | 13 | 254 | 10726 | 64.53 | 762 | 745 | 154.7 |
| A | 3 | 137 | 6788 | 39.07 | 762 | 745 | 154.7 |
| A | 0 | 226 | 6435 | 36.79 | 762 | 745 | 154.7 |
| B | 3 | 64 | 426670 | 2896.08 | 758 | 739 | 147.1 |
| B | 12 | 111 | 17538 | 114.22 | 758 | 739 | 147.1 |
| B | 11 | 111 | 15778 | 102.26 | 758 | 739 | 147.1 |
| C | 14 | 238 | 117398 | 680.98 | 731 | 736 | 171.3 |
| C | 2 | 16 | 103427 | 599.43 | 731 | 736 | 171.3 |
| C | 13 | 61 | 4952 | 24.61 | 731 | 736 | 171.3 |
| D | 8 | 195 | 7086565 | 56349.3 | 512 | 498 | 125.8 |
| D | 13 | 174 | 4807522 | 38226.06 | 512 | 498 | 125.8 |
| D | 1 | 52 | 173686 | 1377.21 | 512 | 498 | 125.8 |
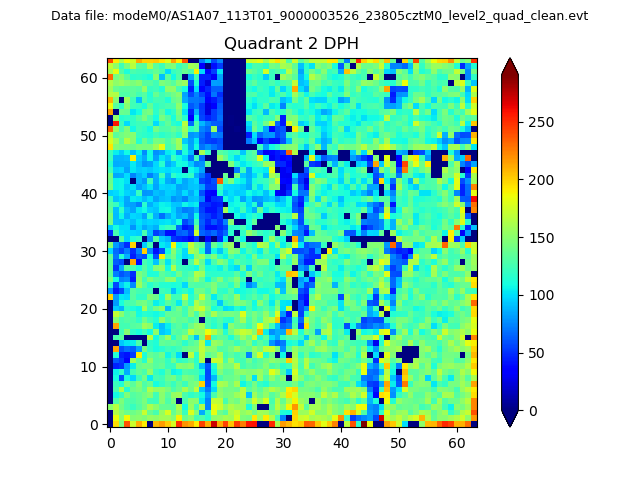
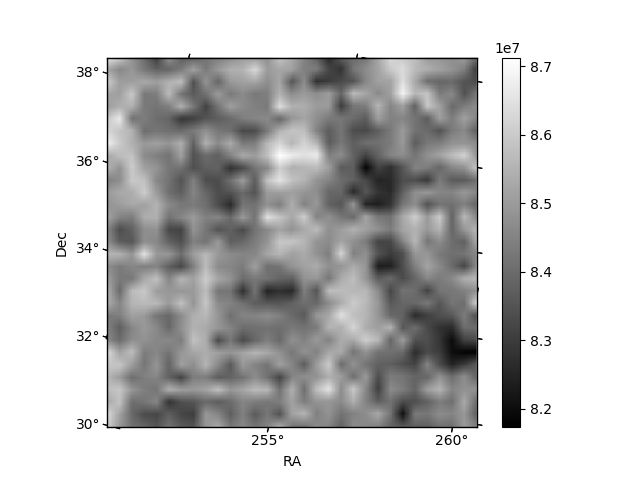
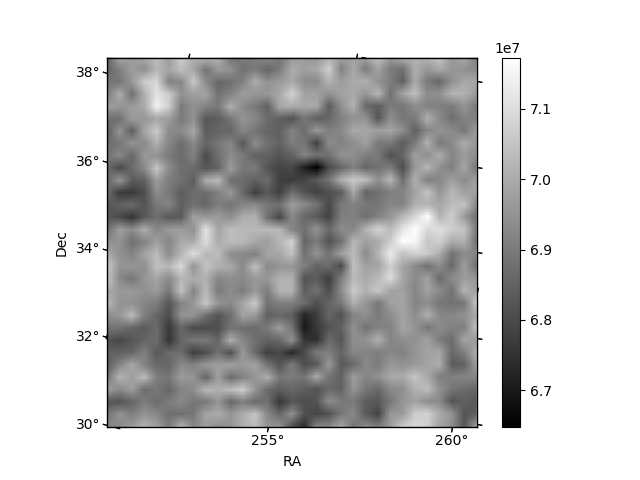
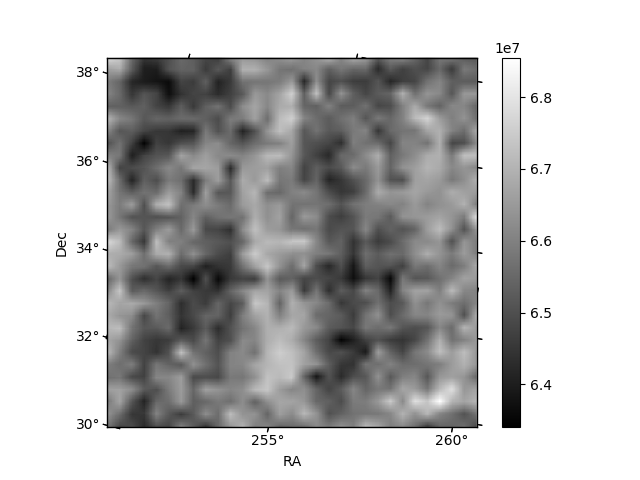
Histogram calculated using DETX and DETY for each event in the final _common_clean file
| Quadrant A | 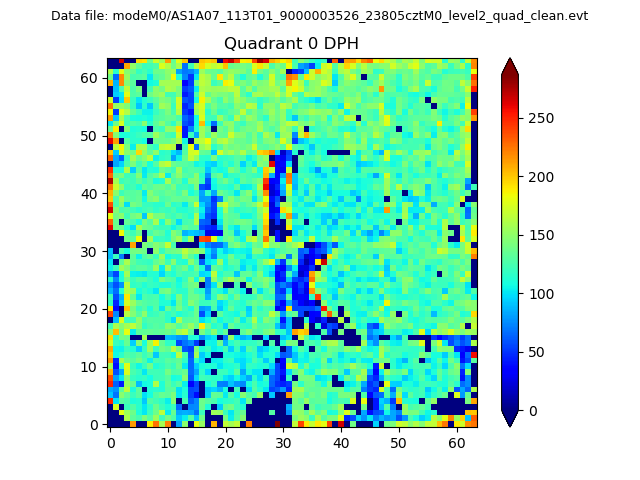 |
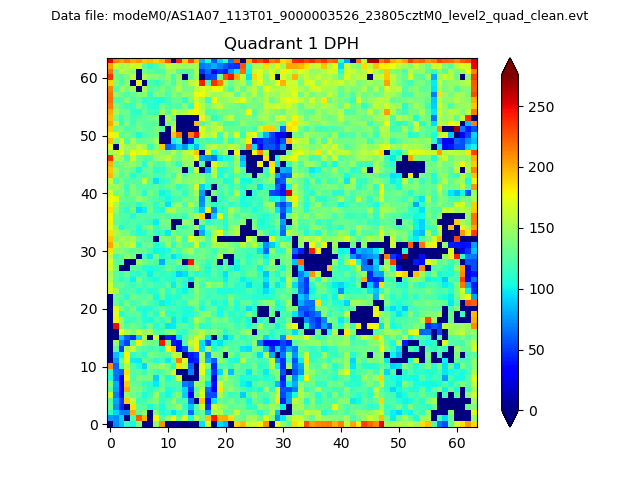 |
Quadrant B |
|---|---|---|---|
| Quadrant D | 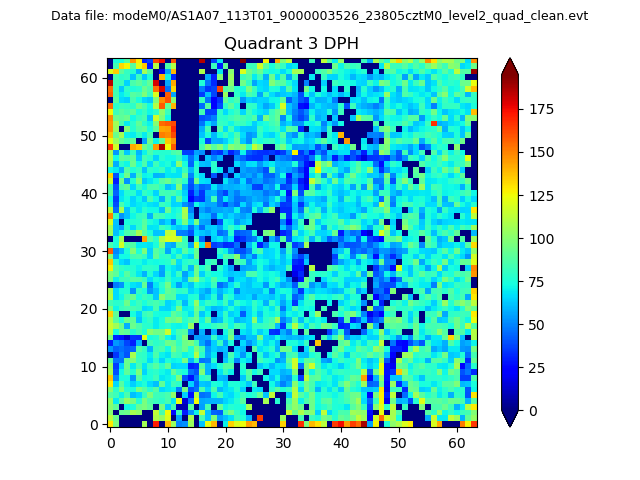 |
 |
Quadrant C |
| Plot type | Count rate plots | Images |
|---|---|---|
| Comparison with Poisson distribution Blue bars denote a histogram of data divided into 1 sec bins. Red curve is a Poisson curve with rate = median count rate of data. |
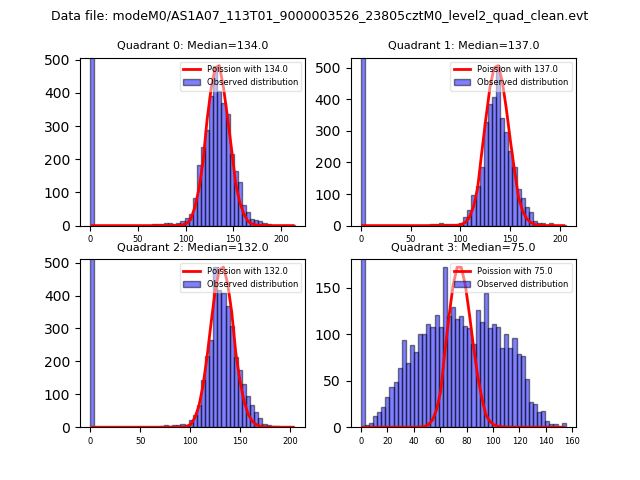 |
 |
| Quadrant-wise count rates Data is divided into 100 sec bins |
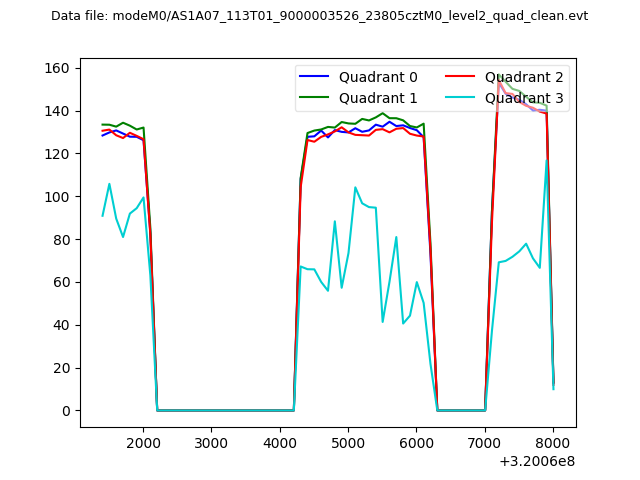 |
|
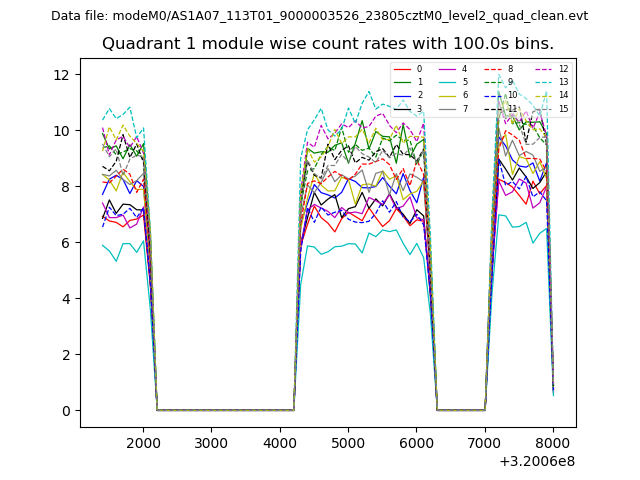
| Module-wise count rates for Quadrant A Data is divided into 100 sec bins |
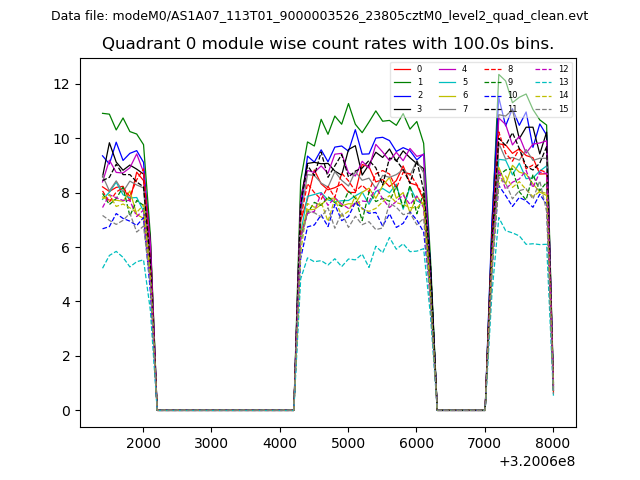 |
 |
| Module-wise count rates for Quadrant B Data is divided into 100 sec bins |
 |
 |
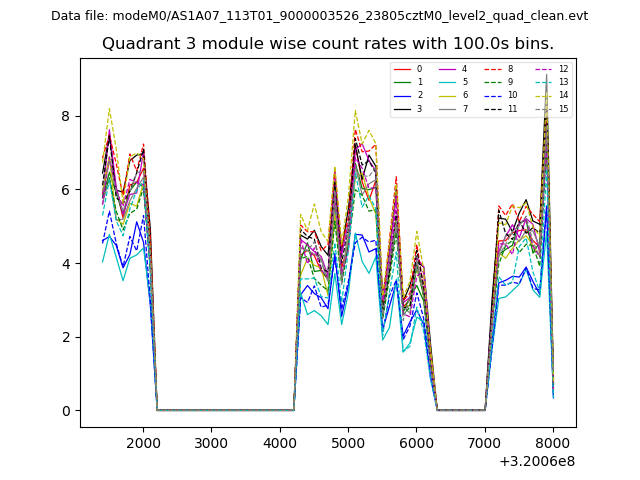
| Module-wise count rates for Quadrant C Data is divided into 100 sec bins |
 |
 |
| Module-wise count rates for Quadrant D Data is divided into 100 sec bins |
 |
 |
| Parameter | Plot |
|---|---|
| CZT HV Monitor | 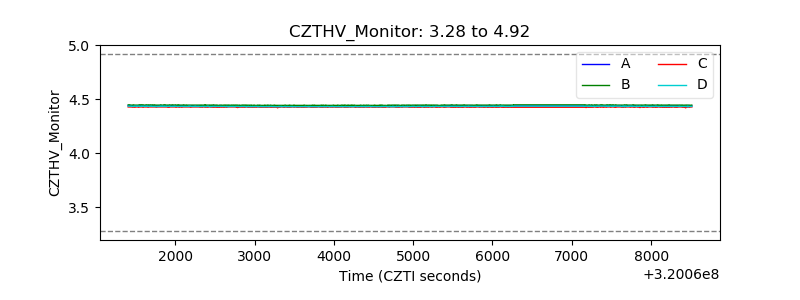 |
| D_VDD | 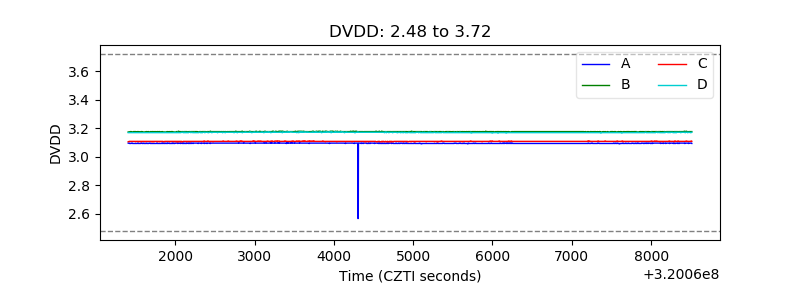 |
| Temperature 1 | 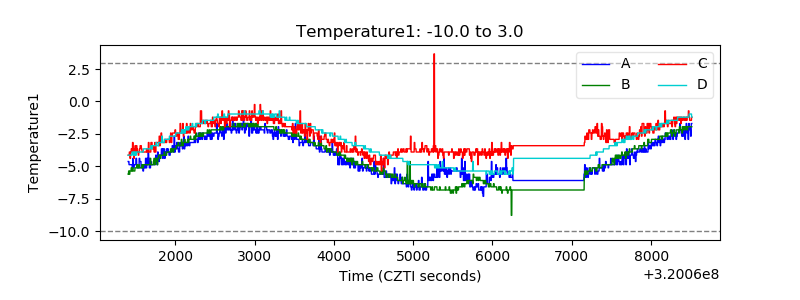 |
| Veto HV Monitor | 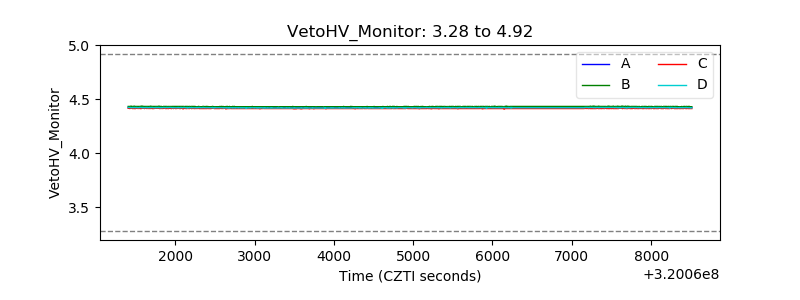 |
| Veto LLD |  |
| Alpha Counter | 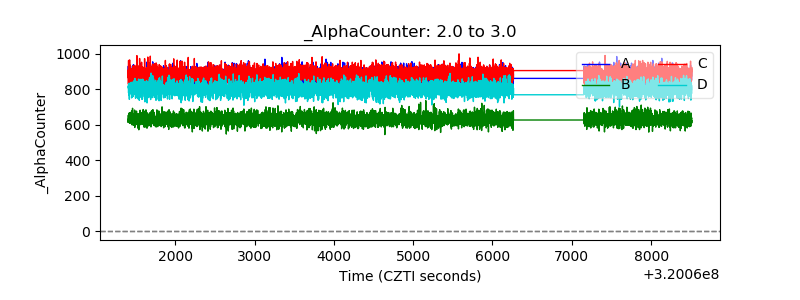 |
| _CPM_Rate | 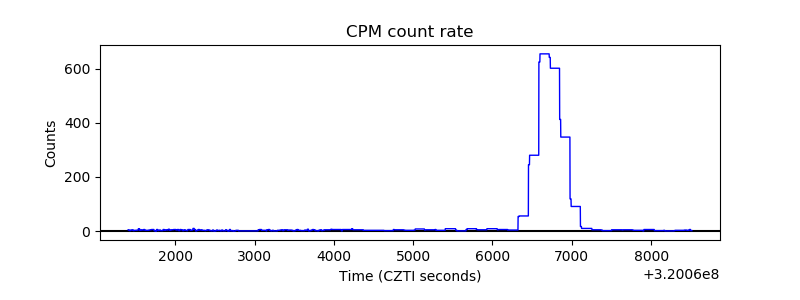 |
| CZT Counter | 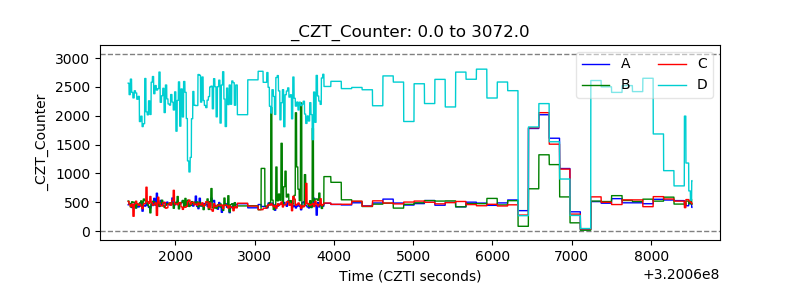 |
| +2.5 Volts monitor |  |
| +5 Volts monitor | 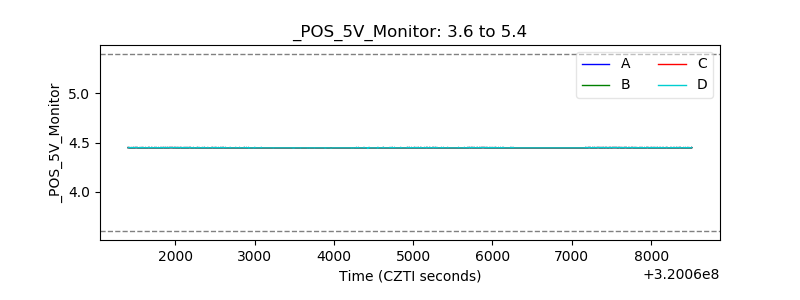 |
| _ROLL_ROT | 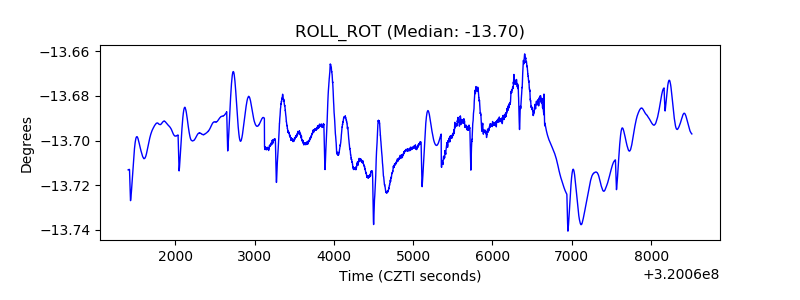 |
| _Roll_DEC | 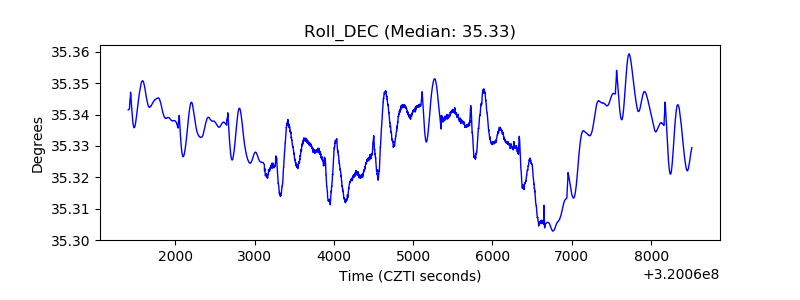 |
| _Roll_RA |  |
| Veto Counter | 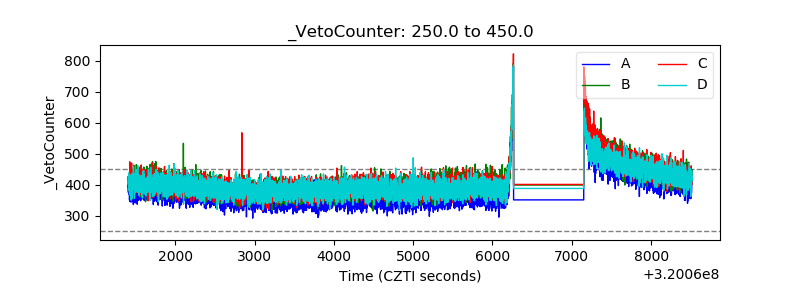 |