| Param | Original file | Final file |
|---|---|---|
| Filename | modeM0/AS1A07_113T01_9000003526_23806cztM0_level2.evt | modeM0/AS1A07_113T01_9000003526_23806cztM0_level2_quad_clean.evt |
| Size (bytes) | 750,715,200 | 75,732,480 |
| Size | 715.9 MB | 72.2 MB |
| Events in quadrant A | 3,231,451 | 489,361 |
| Events in quadrant B | 3,427,016 | 499,206 |
| Events in quadrant C | 3,332,562 | 485,291 |
| Events in quadrant D | 12,302,406 | 362,470 |
| Mode M9 | |||
|---|---|---|---|
| Quadrant | BADHDUFLAG | Total packets | Discarded packets |
| A | 0 | 10 | 0 |
| B | 0 | 10 | 0 |
| C | 0 | 10 | 0 |
| D | 0 | 10 | 0 |
| Mode SS | |||
|---|---|---|---|
| Quadrant | BADHDUFLAG | Total packets | Discarded packets |
| A | 0 | 132 | 0 |
| B | 0 | 132 | 0 |
| C | 0 | 132 | 0 |
| D | 0 | 132 | 0 |
| Mode M0 | |||
|---|---|---|---|
| Quadrant | BADHDUFLAG | Total packets | Discarded packets |
| A | 0 | 13631 | 1 |
| B | 0 | 14116 | 1 |
| C | 0 | 13869 | 1 |
| D | 0 | 41033 | 1 |
| Quadrant | Total seconds | Saturated seconds | Saturation percentage |
|---|---|---|---|
| A | 6540 | 57 | 0.871560% |
| B | 6541 | 70 | 1.070173% |
| C | 6541 | 95 | 1.452377% |
| D | 6540 | 3297 | 50.412844% |
Noise dominated data is calculated using 1-second bins in cleaned event files. If a bin has >2000 counts, and if more than 50% of those come from <1% of pixels, then it is considered to be noise-dominated and hence unusable.
| Quadrant | # 1 sec bins | Bins with >0 counts | Bins with >2000 counts | High rate bins dominated by noise | Noise dominated (total time) | Noise dominated (detector-on time) | Marked lightcurve |
|---|---|---|---|---|---|---|---|
| A | 7565 | 6540 | 0 | 0 | 0.00% | 0.00% | 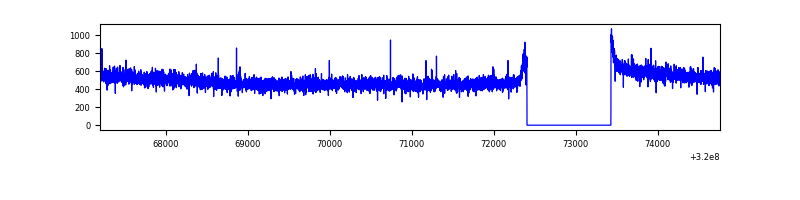 |
| B | 7566 | 6541 | 8 | 8 | 0.11% | 0.12% | 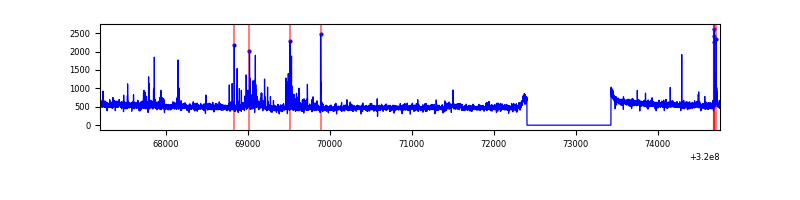 |
| C | 7566 | 6541 | 7 | 7 | 0.09% | 0.11% | 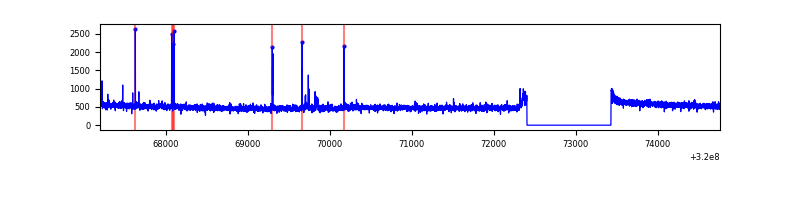 |
| D | 7565 | 6540 | 3144 | 3144 | 41.56% | 48.07% | 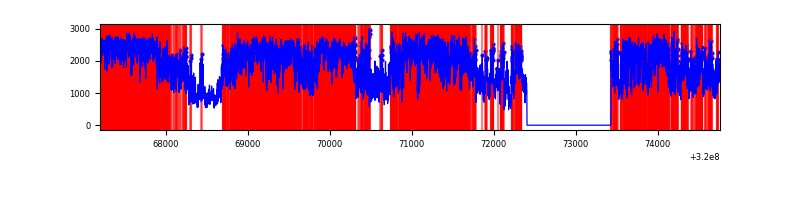 |
Top three noisy pixels from each quadrant. If the there are fewer than three noisy pixels in the level2.evt file, extra rows are filled as -1
| Pixel properties | Quadrant properties | ||||||
|---|---|---|---|---|---|---|---|
| Quadrant | DetID | PixID | Counts | Sigma | Mean | Median | Sigma |
| A | 13 | 254 | 11092 | 60.73 | 837 | 819 | 169.2 |
| A | 0 | 226 | 7104 | 37.16 | 837 | 819 | 169.2 |
| A | 3 | 137 | 7077 | 37.0 | 837 | 819 | 169.2 |
| B | 3 | 64 | 133461 | 832.66 | 829 | 808 | 159.3 |
| B | 12 | 111 | 19058 | 114.55 | 829 | 808 | 159.3 |
| B | 15 | 33 | 18082 | 108.43 | 829 | 808 | 159.3 |
| C | 14 | 238 | 127756 | 678.09 | 801 | 808 | 187.2 |
| C | 2 | 16 | 80630 | 426.37 | 801 | 808 | 187.2 |
| C | 13 | 61 | 5484 | 24.98 | 801 | 808 | 187.2 |
| D | 8 | 195 | 6473252 | 39265.26 | 685 | 667 | 164.8 |
| D | 13 | 174 | 2033833 | 12333.99 | 685 | 667 | 164.8 |
| D | 1 | 52 | 1139418 | 6908.11 | 685 | 667 | 164.8 |
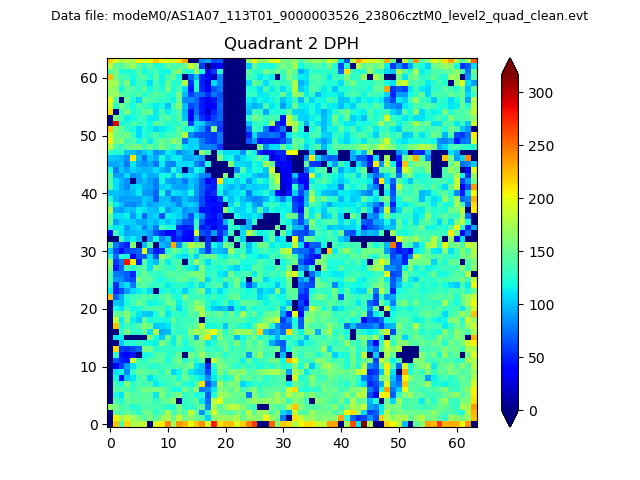
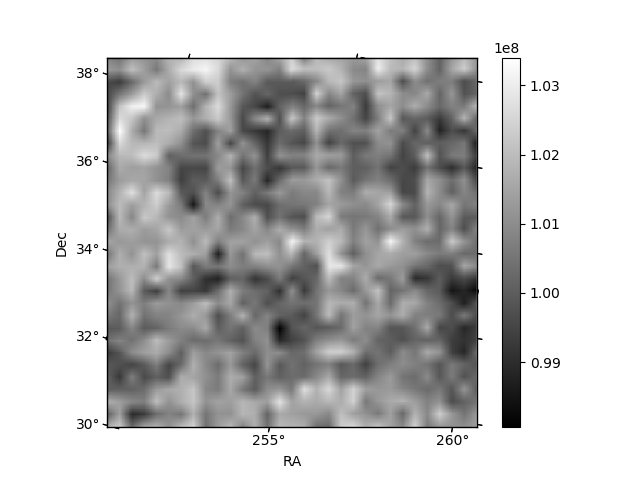
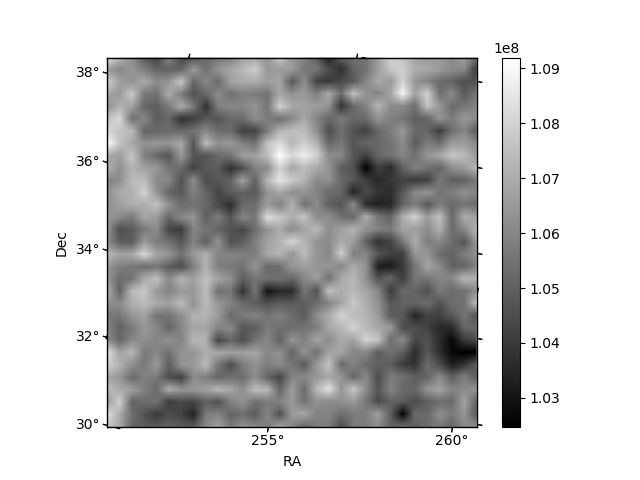
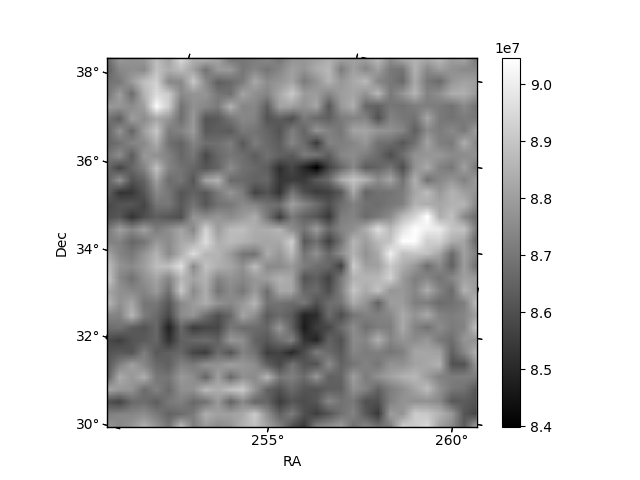
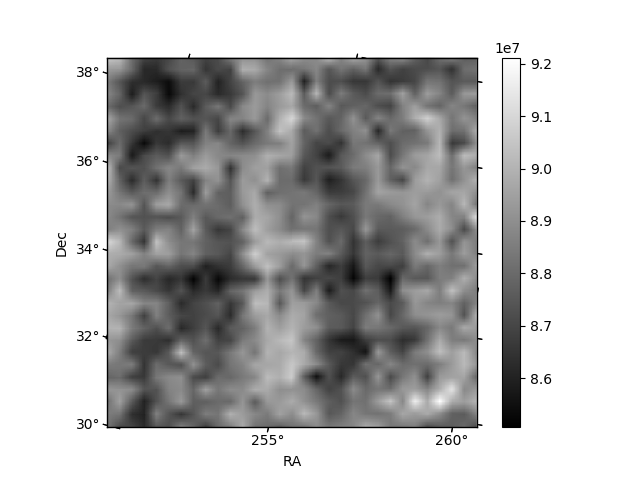
Histogram calculated using DETX and DETY for each event in the final _common_clean file
| Quadrant A | 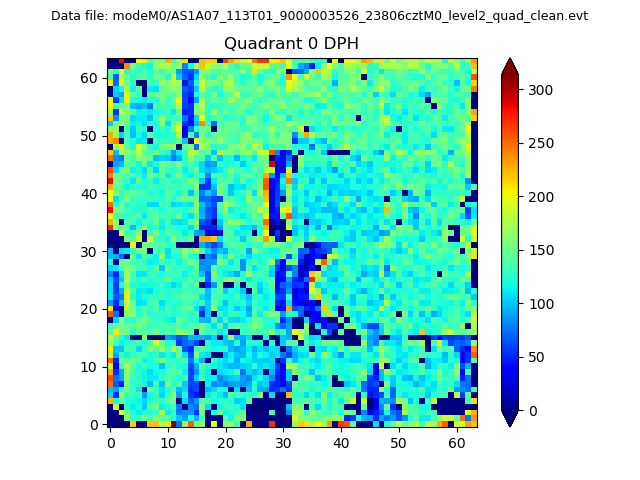 |
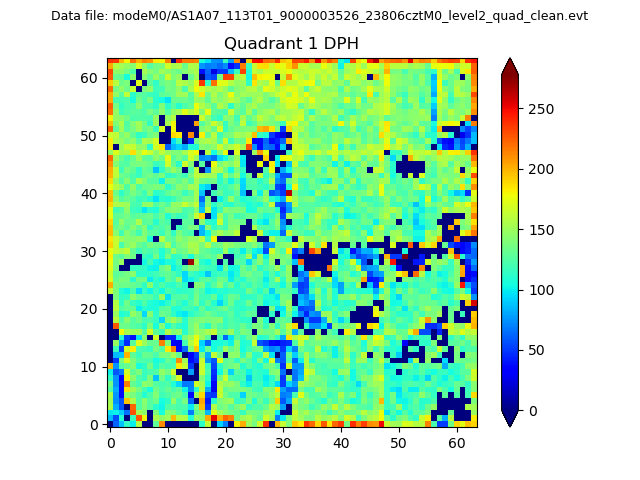 |
Quadrant B |
|---|---|---|---|
| Quadrant D | 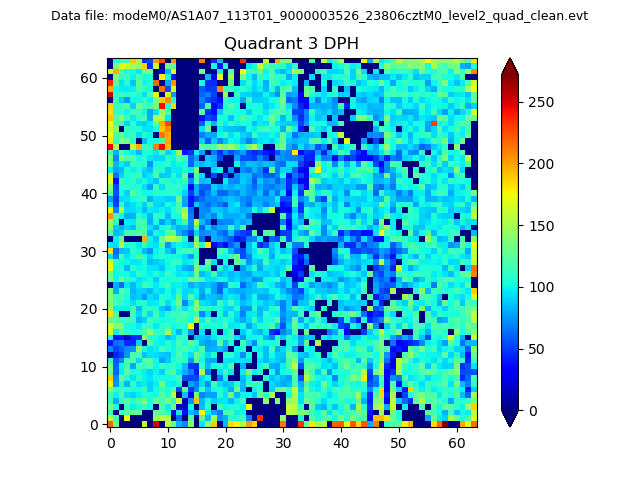 |
 |
Quadrant C |
| Plot type | Count rate plots | Images |
|---|---|---|
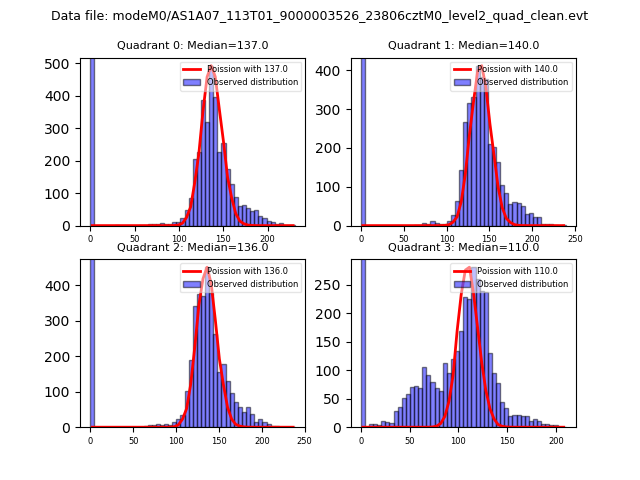
| Comparison with Poisson distribution Blue bars denote a histogram of data divided into 1 sec bins. Red curve is a Poisson curve with rate = median count rate of data. |
 |
 |
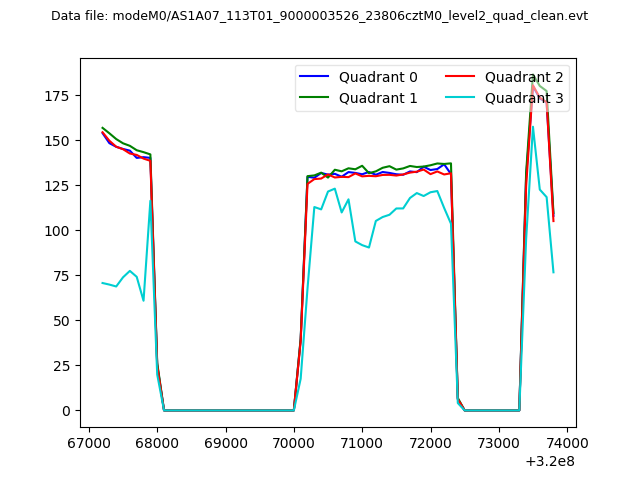
| Quadrant-wise count rates Data is divided into 100 sec bins |
 |
|
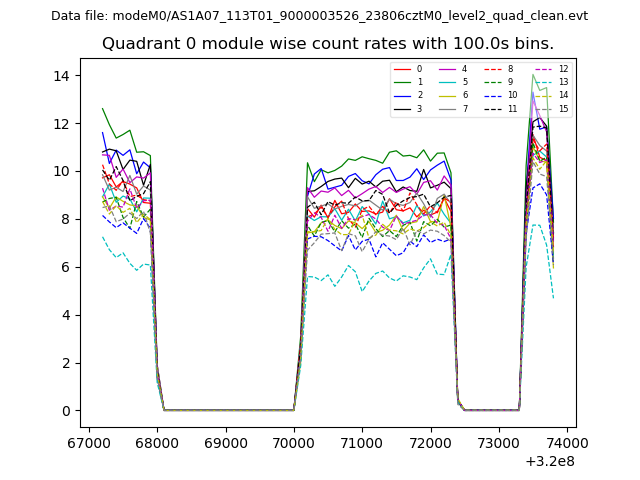
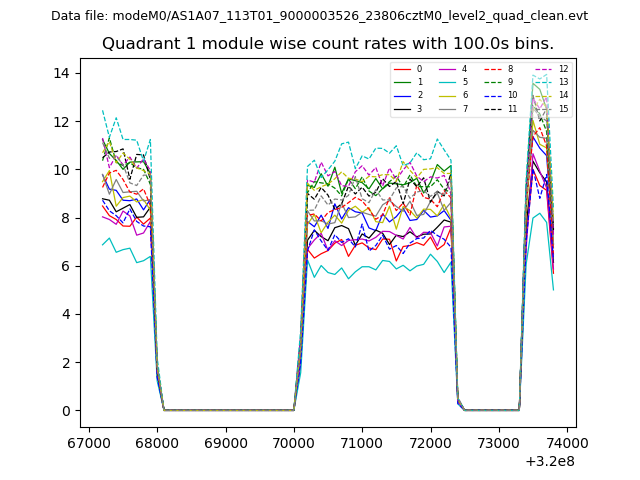
| Module-wise count rates for Quadrant A Data is divided into 100 sec bins |
 |
 |
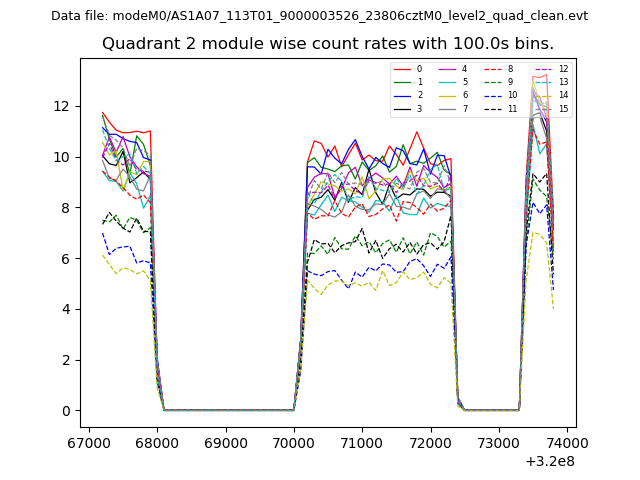
| Module-wise count rates for Quadrant B Data is divided into 100 sec bins |
 |
 |
| Module-wise count rates for Quadrant C Data is divided into 100 sec bins |
 |
 |
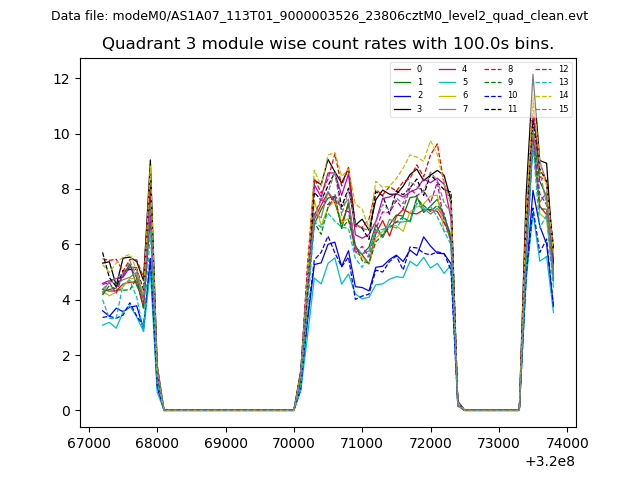
| Module-wise count rates for Quadrant D Data is divided into 100 sec bins |
 |
 |
| Parameter | Plot |
|---|---|
| CZT HV Monitor | 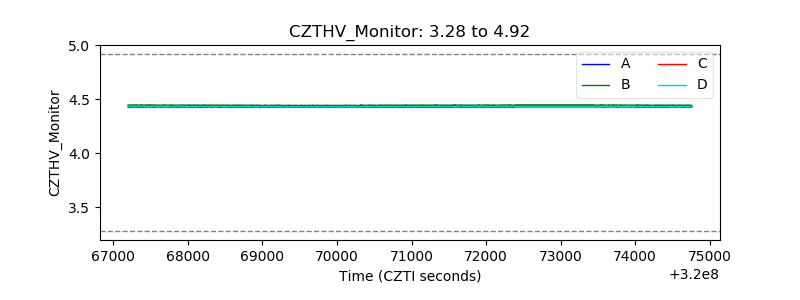 |
| D_VDD | 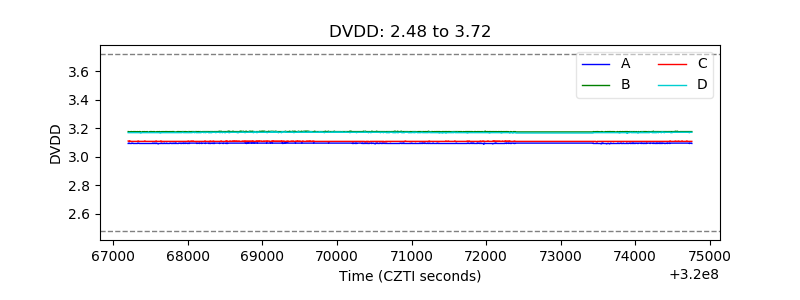 |
| Temperature 1 | 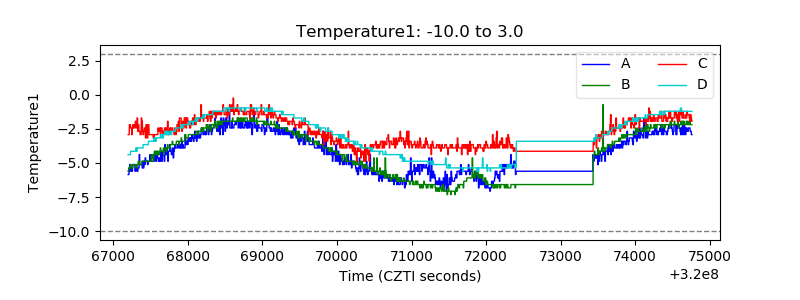 |
| Veto HV Monitor |  |
| Veto LLD | 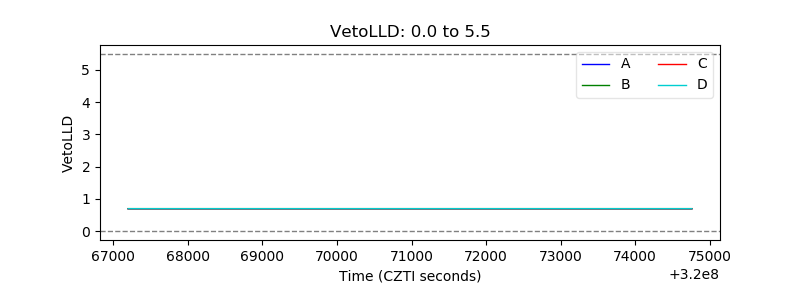 |
| Alpha Counter | 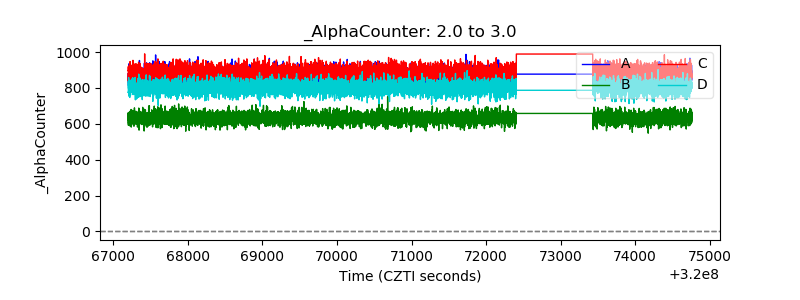 |
| _CPM_Rate | 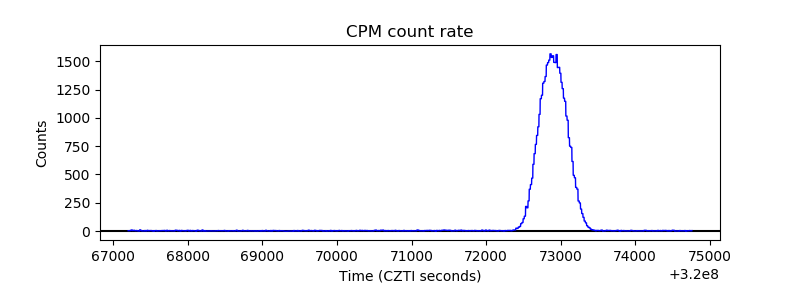 |
| CZT Counter |  |
| +2.5 Volts monitor | 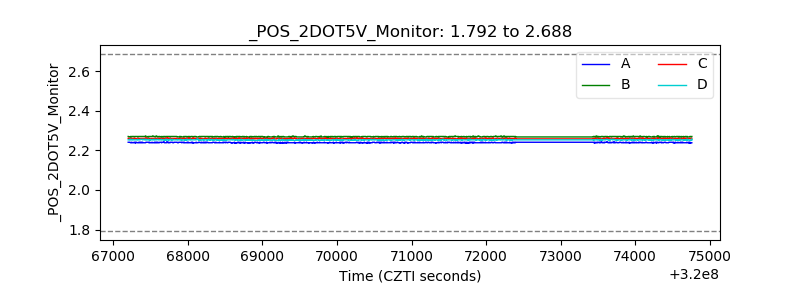 |
| +5 Volts monitor |  |
| _ROLL_ROT | 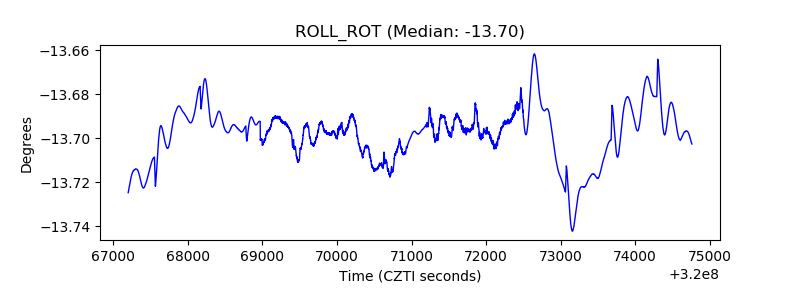 |
| _Roll_DEC | 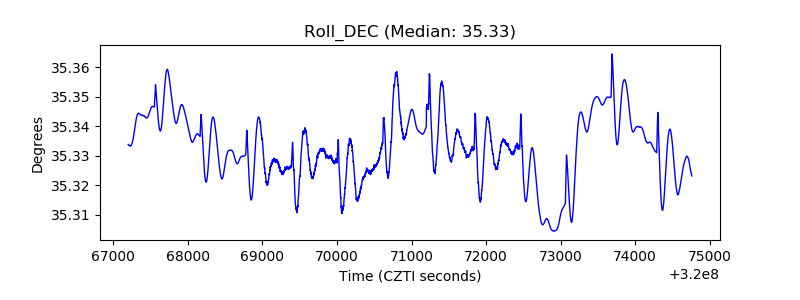 |
| _Roll_RA | 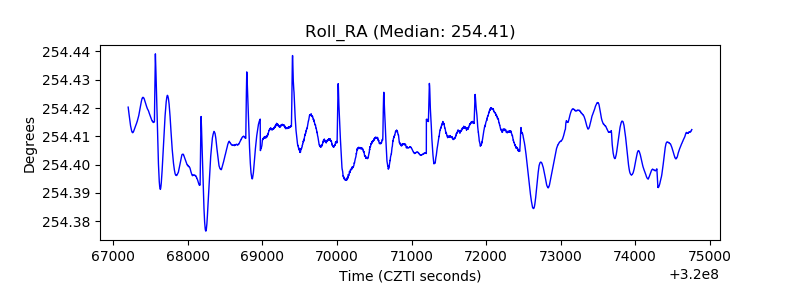 |
| Veto Counter | 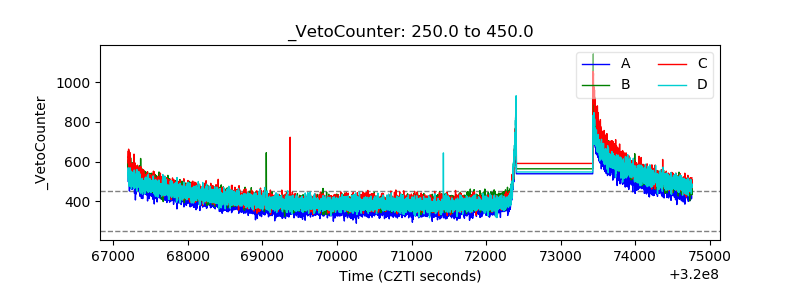 |