| Param | Original file | Final file |
|---|---|---|
| Filename | modeM0/AS1A07_113T01_9000003526_23808cztM0_level2.evt | modeM0/AS1A07_113T01_9000003526_23808cztM0_level2_quad_clean.evt |
| Size (bytes) | 782,663,040 | 66,683,520 |
| Size | 746.4 MB | 63.6 MB |
| Events in quadrant A | 3,478,264 | 417,508 |
| Events in quadrant B | 3,605,613 | 426,219 |
| Events in quadrant C | 3,553,635 | 414,163 |
| Events in quadrant D | 12,616,394 | 296,739 |
| Mode M9 | |||
|---|---|---|---|
| Quadrant | BADHDUFLAG | Total packets | Discarded packets |
| A | 0 | 14 | 0 |
| B | 0 | 15 | 0 |
| C | 0 | 15 | 0 |
| D | 0 | 15 | 0 |
| Mode SS | |||
|---|---|---|---|
| Quadrant | BADHDUFLAG | Total packets | Discarded packets |
| A | 0 | 134 | 0 |
| B | 0 | 134 | 0 |
| C | 0 | 134 | 0 |
| D | 0 | 134 | 0 |
| Mode M0 | |||
|---|---|---|---|
| Quadrant | BADHDUFLAG | Total packets | Discarded packets |
| A | 0 | 14582 | 2 |
| B | 0 | 14889 | 2 |
| C | 0 | 14734 | 2 |
| D | 0 | 42088 | 2 |
| Quadrant | Total seconds | Saturated seconds | Saturation percentage |
|---|---|---|---|
| A | 6650 | 43 | 0.646617% |
| B | 6650 | 62 | 0.932331% |
| C | 6650 | 102 | 1.533835% |
| D | 6650 | 3558 | 53.503759% |
Noise dominated data is calculated using 1-second bins in cleaned event files. If a bin has >2000 counts, and if more than 50% of those come from <1% of pixels, then it is considered to be noise-dominated and hence unusable.
| Quadrant | # 1 sec bins | Bins with >0 counts | Bins with >2000 counts | High rate bins dominated by noise | Noise dominated (total time) | Noise dominated (detector-on time) | Marked lightcurve |
|---|---|---|---|---|---|---|---|
| A | 7835 | 6650 | 0 | 0 | 0.00% | 0.00% | 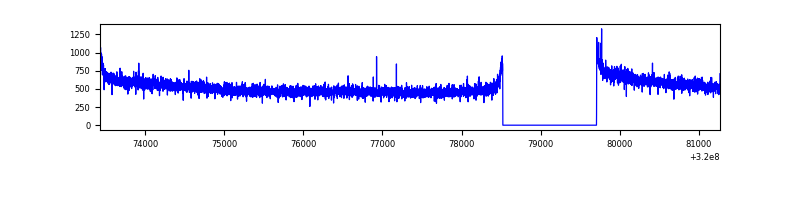 |
| B | 7835 | 6651 | 11 | 11 | 0.14% | 0.17% | 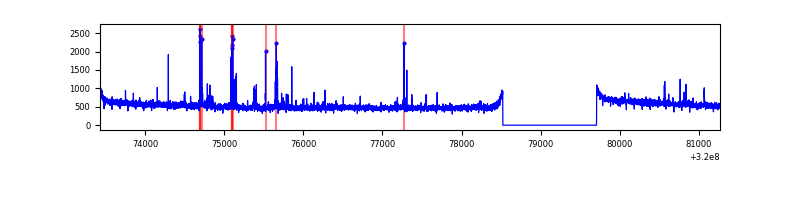 |
| C | 7835 | 6650 | 2 | 2 | 0.03% | 0.03% | 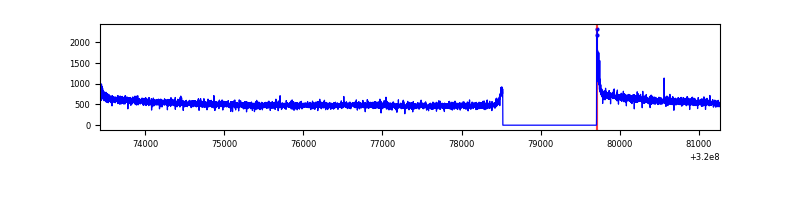 |
| D | 7834 | 6649 | 3175 | 3175 | 40.53% | 47.75% | 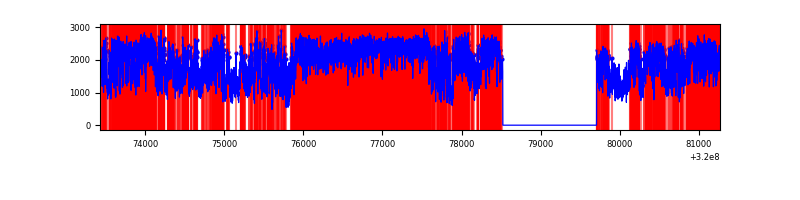 |
Top three noisy pixels from each quadrant. If the there are fewer than three noisy pixels in the level2.evt file, extra rows are filled as -1
| Pixel properties | Quadrant properties | ||||||
|---|---|---|---|---|---|---|---|
| Quadrant | DetID | PixID | Counts | Sigma | Mean | Median | Sigma |
| A | 13 | 254 | 11321 | 58.32 | 900 | 883 | 179.0 |
| A | 0 | 226 | 7905 | 39.24 | 900 | 883 | 179.0 |
| A | 3 | 137 | 7469 | 36.8 | 900 | 883 | 179.0 |
| B | 3 | 64 | 115159 | 680.45 | 890 | 869 | 168.0 |
| B | 12 | 111 | 19689 | 112.05 | 890 | 869 | 168.0 |
| B | 11 | 111 | 17950 | 101.7 | 890 | 869 | 168.0 |
| C | 14 | 238 | 139988 | 692.68 | 867 | 874 | 200.8 |
| C | 0 | 10 | 23927 | 114.79 | 867 | 874 | 200.8 |
| C | 2 | 16 | 6112 | 26.08 | 867 | 874 | 200.8 |
| D | 8 | 195 | 3725942 | 20810.97 | 748 | 728 | 179.0 |
| D | 1 | 52 | 3221664 | 17993.81 | 748 | 728 | 179.0 |
| D | 13 | 174 | 2778244 | 15516.64 | 748 | 728 | 179.0 |
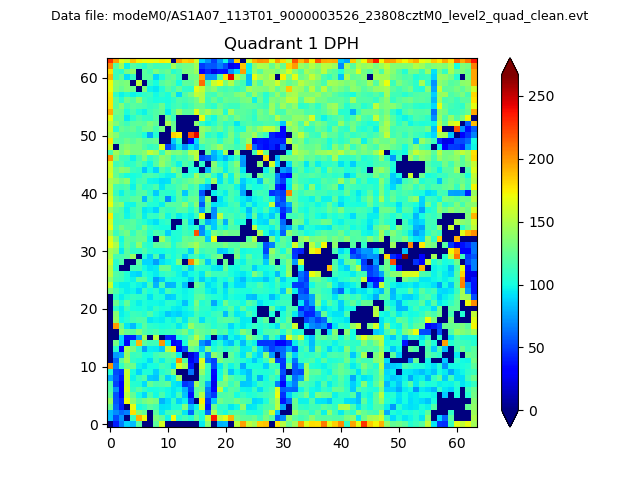
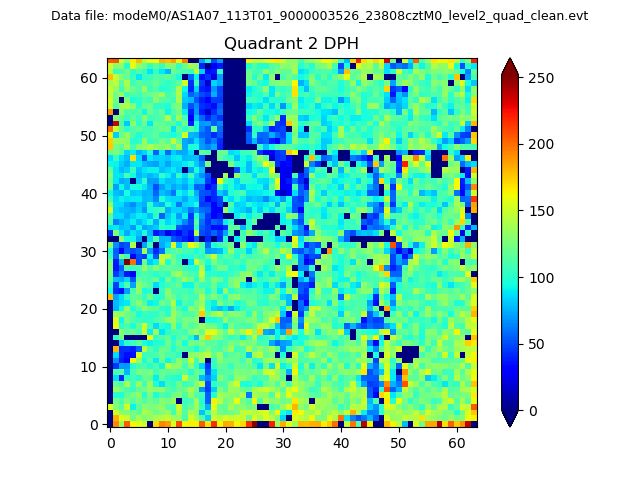
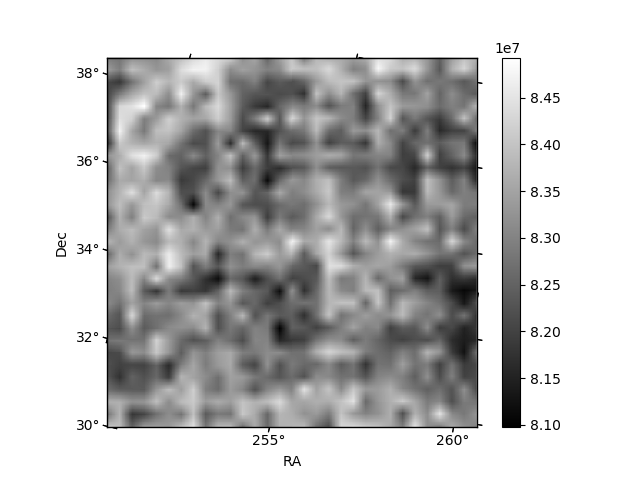
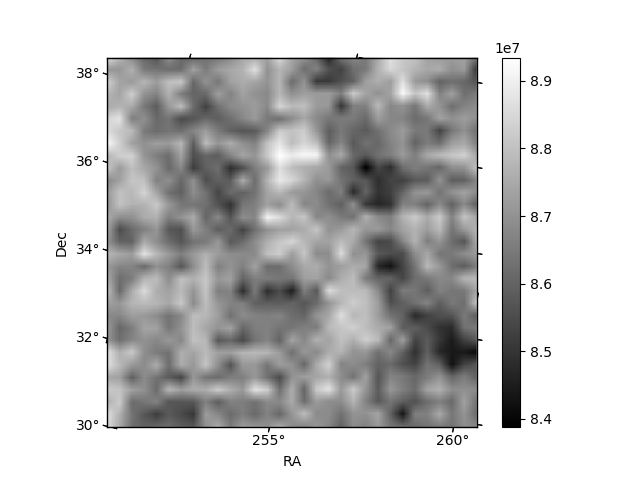
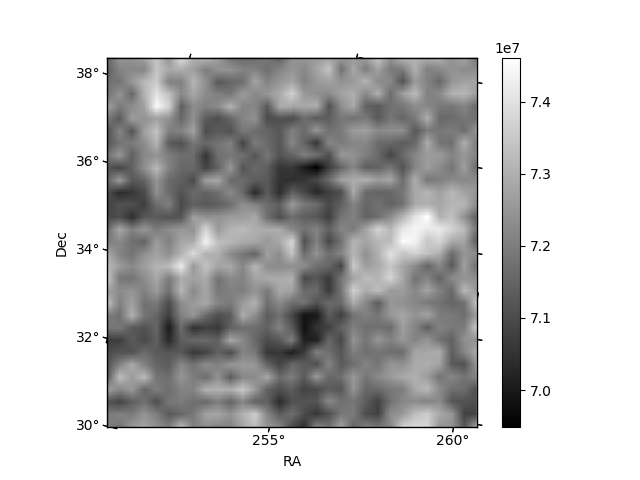
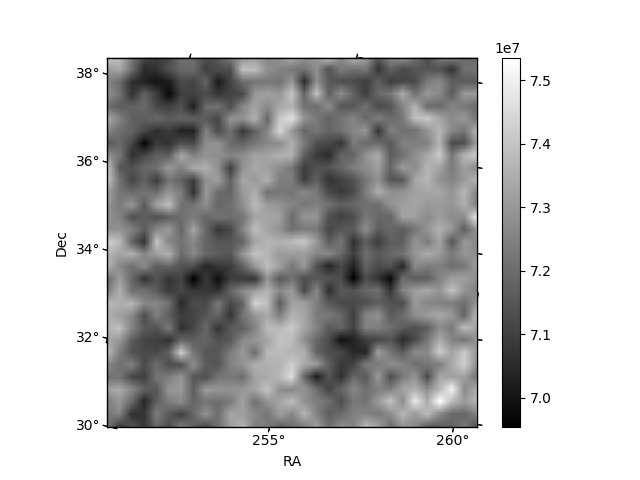
Histogram calculated using DETX and DETY for each event in the final _common_clean file
| Quadrant A |  |
 |
Quadrant B |
|---|---|---|---|
| Quadrant D |  |
 |
Quadrant C |
| Plot type | Count rate plots | Images |
|---|---|---|
| Comparison with Poisson distribution Blue bars denote a histogram of data divided into 1 sec bins. Red curve is a Poisson curve with rate = median count rate of data. |
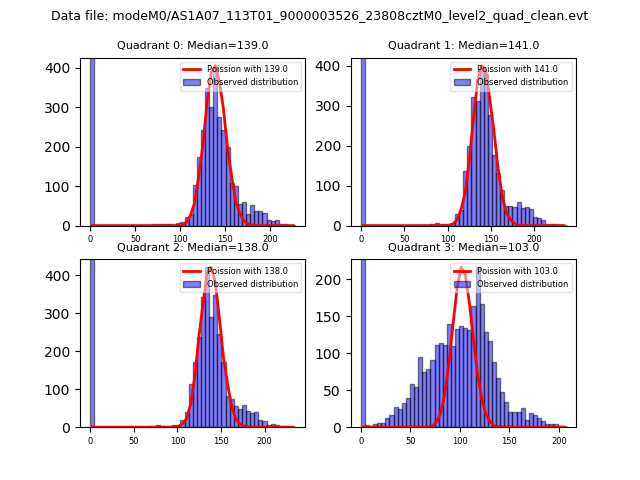 |
 |
| Quadrant-wise count rates Data is divided into 100 sec bins |
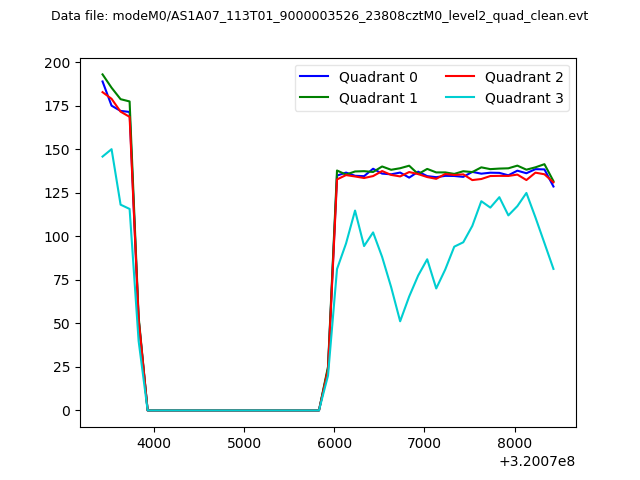 |
|
| Module-wise count rates for Quadrant A Data is divided into 100 sec bins |
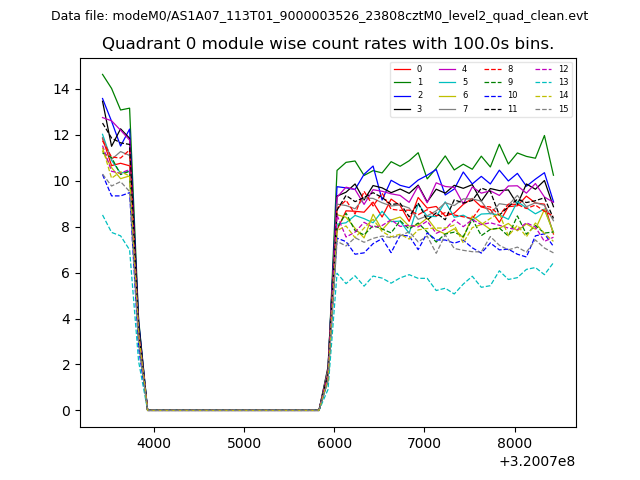 |
 |
| Module-wise count rates for Quadrant B Data is divided into 100 sec bins |
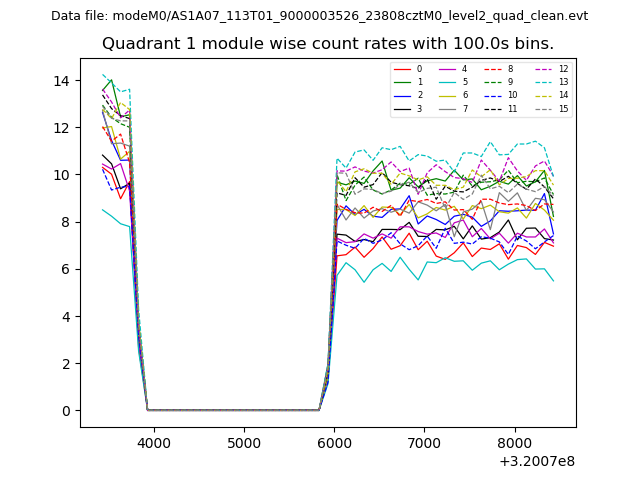 |
 |
| Module-wise count rates for Quadrant C Data is divided into 100 sec bins |
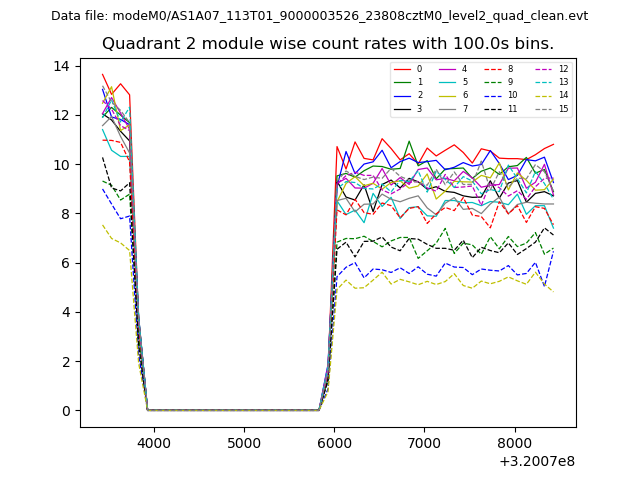 |
 |
| Module-wise count rates for Quadrant D Data is divided into 100 sec bins |
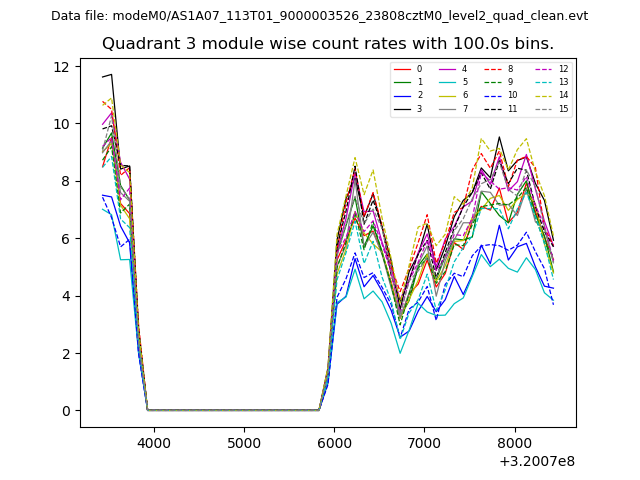 |
 |
| Parameter | Plot |
|---|---|
| CZT HV Monitor | 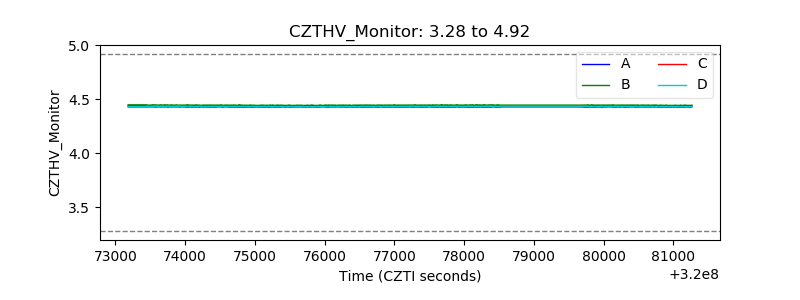 |
| D_VDD | 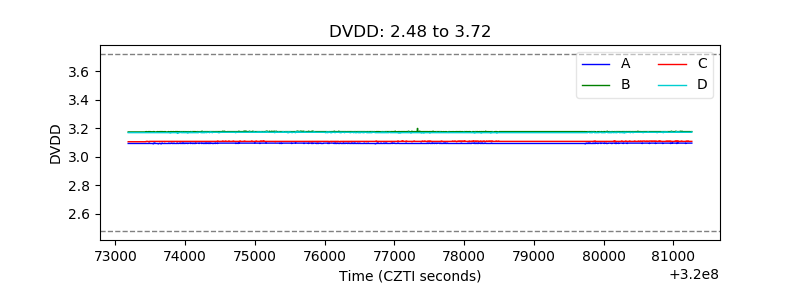 |
| Temperature 1 | 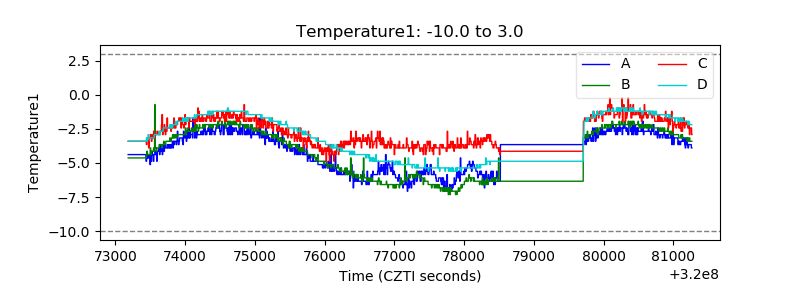 |
| Veto HV Monitor | 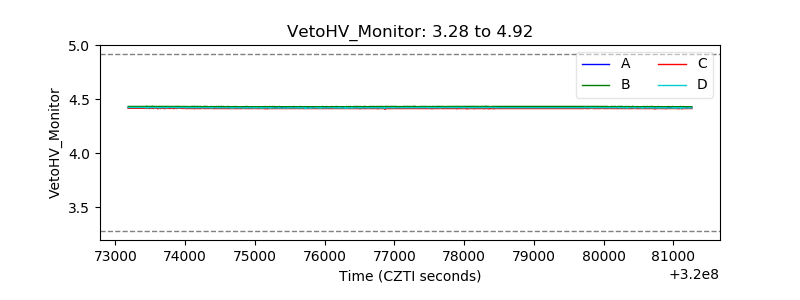 |
| Veto LLD | 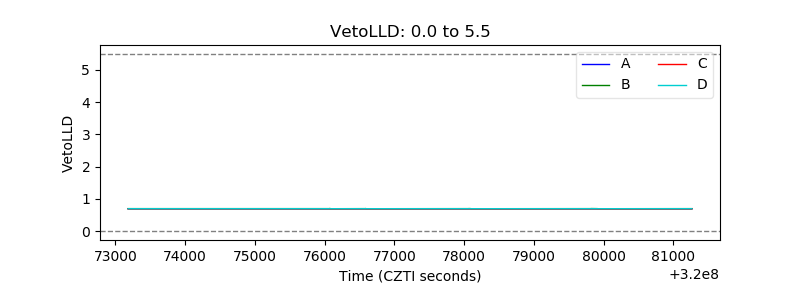 |
| Alpha Counter | 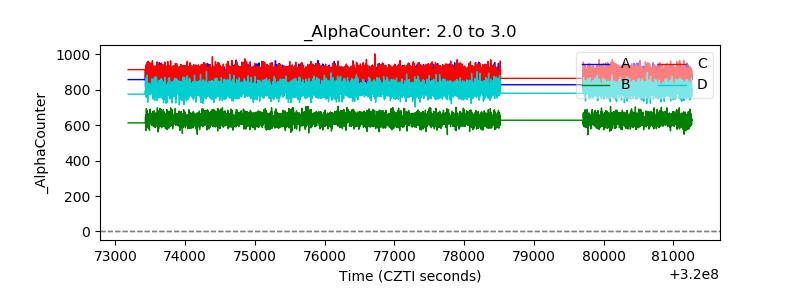 |
| _CPM_Rate | 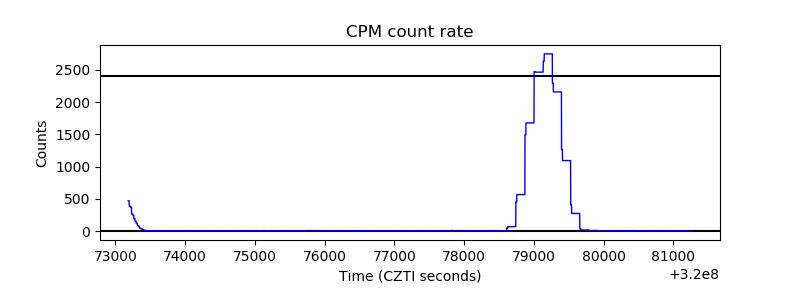 |
| CZT Counter |  |
| +2.5 Volts monitor | 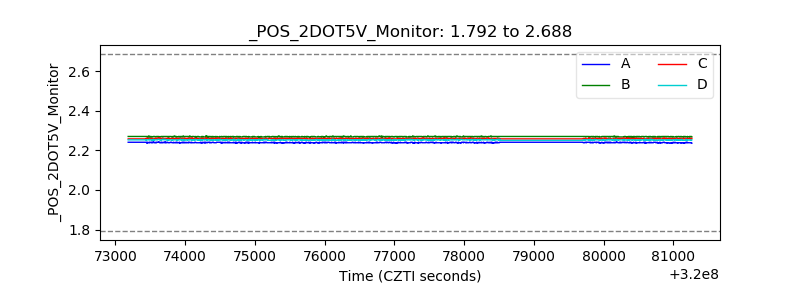 |
| +5 Volts monitor | 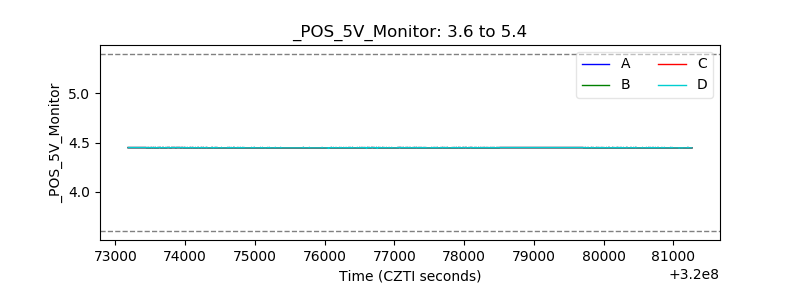 |
| _ROLL_ROT | 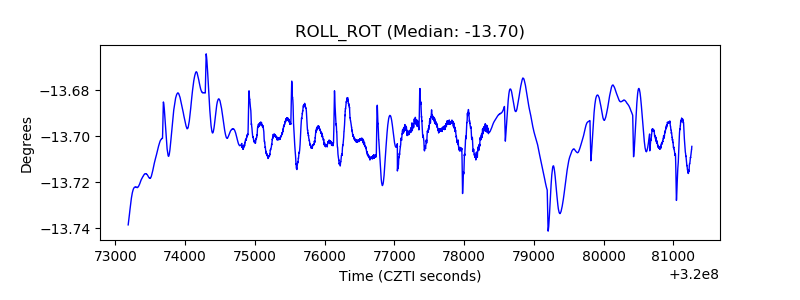 |
| _Roll_DEC | 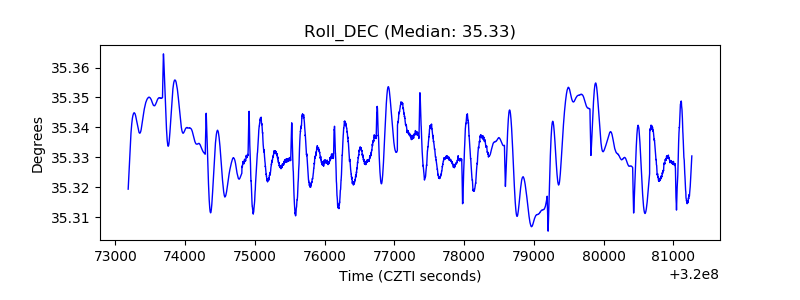 |
| _Roll_RA |  |
| Veto Counter | 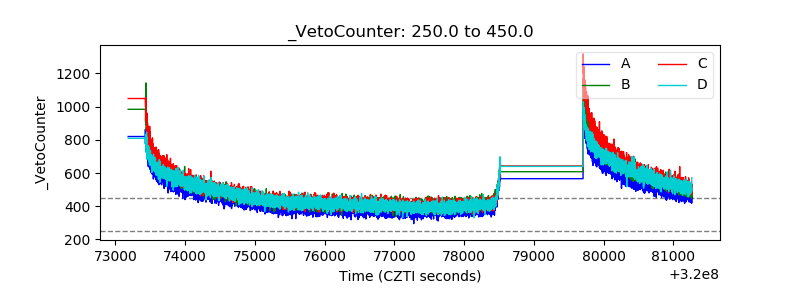 |