| Param | Original file | Final file |
|---|---|---|
| Filename | modeM0/AS1A07_113T01_9000003526_23809cztM0_level2.evt | modeM0/AS1A07_113T01_9000003526_23809cztM0_level2_quad_clean.evt |
| Size (bytes) | 608,086,080 | 66,911,040 |
| Size | 579.9 MB | 63.8 MB |
| Events in quadrant A | 3,251,046 | 405,351 |
| Events in quadrant B | 3,411,974 | 413,199 |
| Events in quadrant C | 3,354,719 | 404,318 |
| Events in quadrant D | 7,990,720 | 382,440 |
| Mode M9 | |||
|---|---|---|---|
| Quadrant | BADHDUFLAG | Total packets | Discarded packets |
| A | 0 | 12 | 0 |
| B | 0 | 12 | 0 |
| C | 0 | 12 | 0 |
| D | 0 | 12 | 0 |
| Mode SS | |||
|---|---|---|---|
| Quadrant | BADHDUFLAG | Total packets | Discarded packets |
| A | 0 | 124 | 0 |
| B | 0 | 124 | 0 |
| C | 0 | 124 | 0 |
| D | 0 | 124 | 0 |
| Mode M0 | |||
|---|---|---|---|
| Quadrant | BADHDUFLAG | Total packets | Discarded packets |
| A | 0 | 13549 | 1 |
| B | 0 | 14015 | 1 |
| C | 0 | 13821 | 1 |
| D | 0 | 28020 | 2 |
| Quadrant | Total seconds | Saturated seconds | Saturation percentage |
|---|---|---|---|
| A | 6016 | 78 | 1.296543% |
| B | 6016 | 112 | 1.861702% |
| C | 6017 | 140 | 2.326741% |
| D | 6016 | 1441 | 23.952793% |
Noise dominated data is calculated using 1-second bins in cleaned event files. If a bin has >2000 counts, and if more than 50% of those come from <1% of pixels, then it is considered to be noise-dominated and hence unusable.
| Quadrant | # 1 sec bins | Bins with >0 counts | Bins with >2000 counts | High rate bins dominated by noise | Noise dominated (total time) | Noise dominated (detector-on time) | Marked lightcurve |
|---|---|---|---|---|---|---|---|
| A | 7266 | 6016 | 1 | 1 | 0.01% | 0.02% | 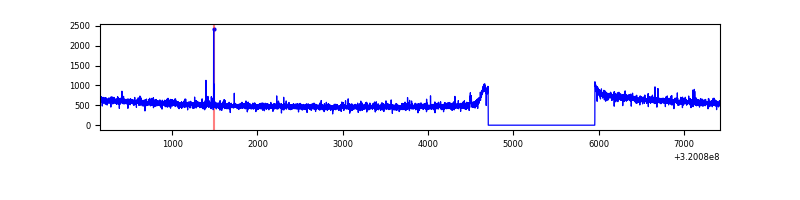 |
| B | 7266 | 6016 | 14 | 14 | 0.19% | 0.23% | 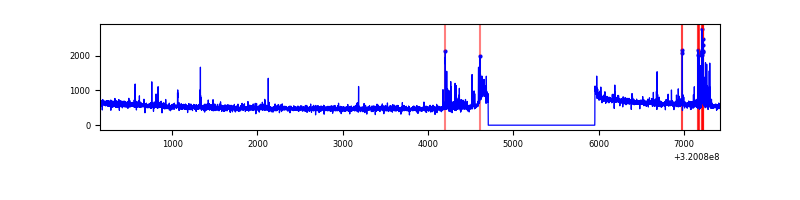 |
| C | 7267 | 6017 | 0 | 0 | 0.00% | 0.00% | 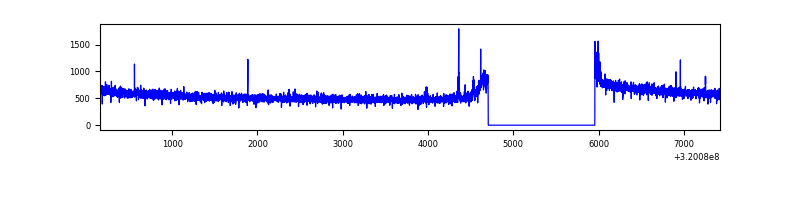 |
| D | 7266 | 6016 | 980 | 980 | 13.49% | 16.29% | 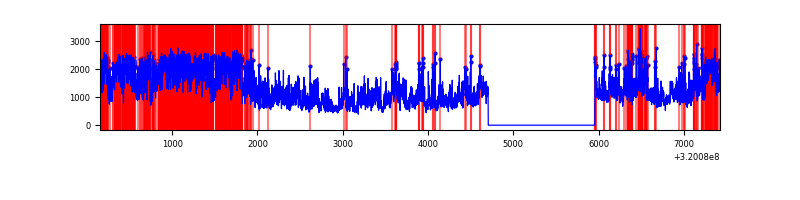 |
Top three noisy pixels from each quadrant. If the there are fewer than three noisy pixels in the level2.evt file, extra rows are filled as -1
| Pixel properties | Quadrant properties | ||||||
|---|---|---|---|---|---|---|---|
| Quadrant | DetID | PixID | Counts | Sigma | Mean | Median | Sigma |
| A | 12 | 96 | 11848 | 66.7 | 839 | 825 | 165.3 |
| A | 13 | 254 | 10328 | 57.5 | 839 | 825 | 165.3 |
| A | 0 | 226 | 7285 | 39.09 | 839 | 825 | 165.3 |
| B | 3 | 64 | 148822 | 956.36 | 834 | 817 | 154.8 |
| B | 12 | 111 | 17985 | 110.93 | 834 | 817 | 154.8 |
| B | 11 | 111 | 16173 | 99.23 | 834 | 817 | 154.8 |
| C | 14 | 238 | 131314 | 696.18 | 817 | 826 | 187.4 |
| C | 7 | 247 | 21103 | 108.18 | 817 | 826 | 187.4 |
| C | 0 | 10 | 12840 | 64.1 | 817 | 826 | 187.4 |
| D | 8 | 195 | 2187741 | 11789.06 | 774 | 754 | 185.5 |
| D | 1 | 52 | 2006836 | 10813.88 | 774 | 754 | 185.5 |
| D | 13 | 174 | 775002 | 4173.62 | 774 | 754 | 185.5 |
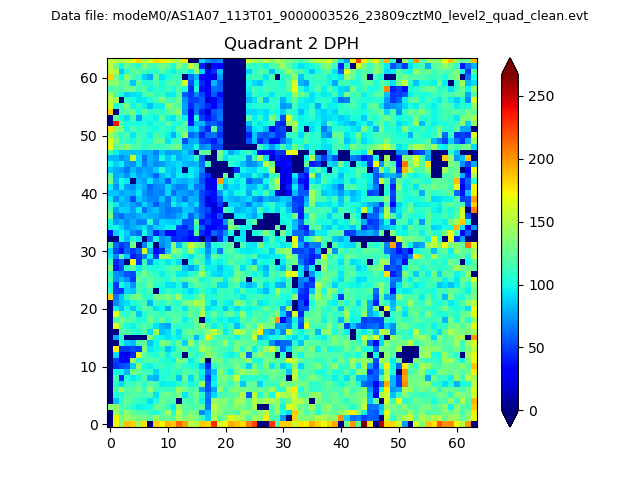
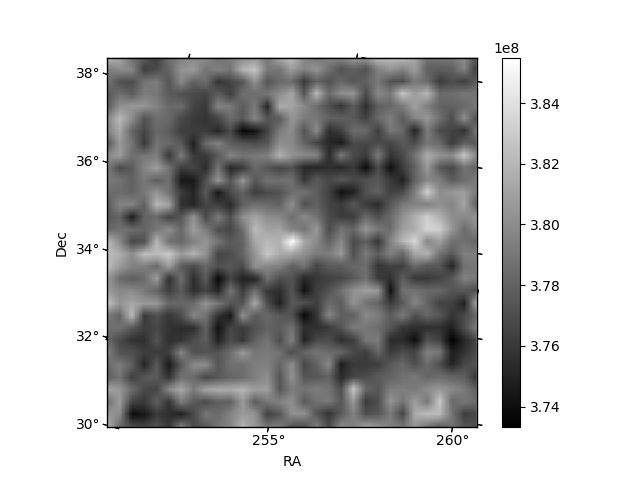
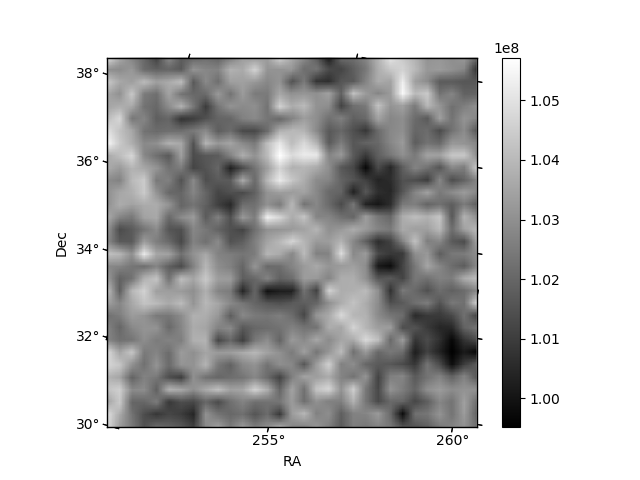
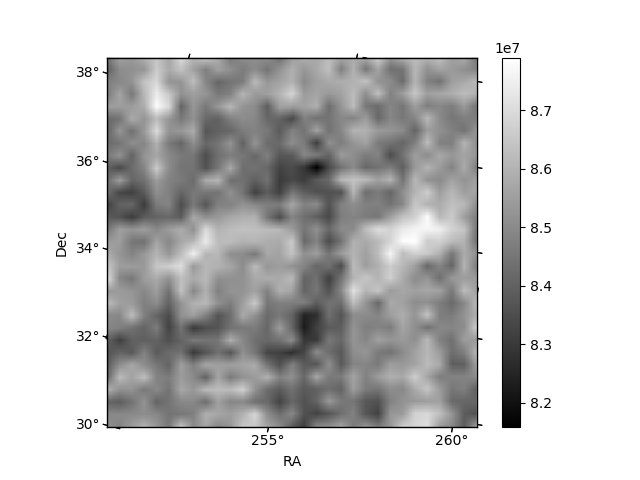
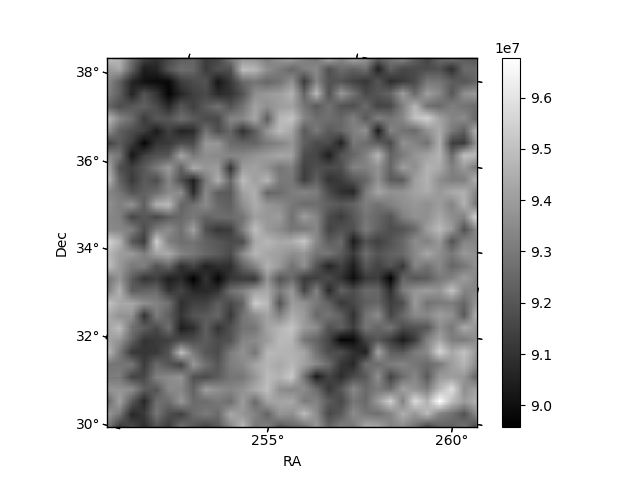
Histogram calculated using DETX and DETY for each event in the final _common_clean file
| Quadrant A | 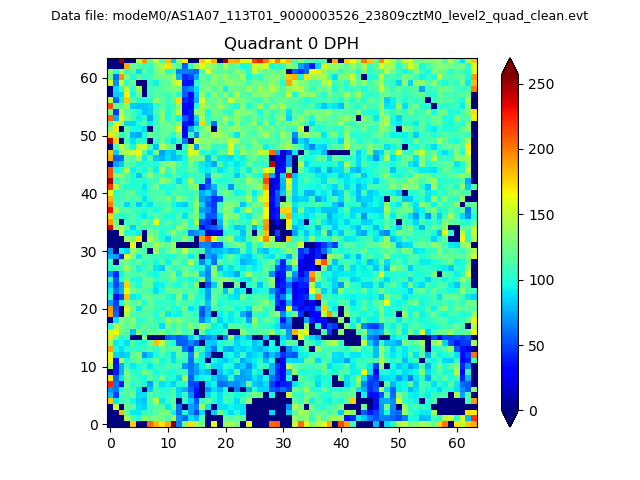 |
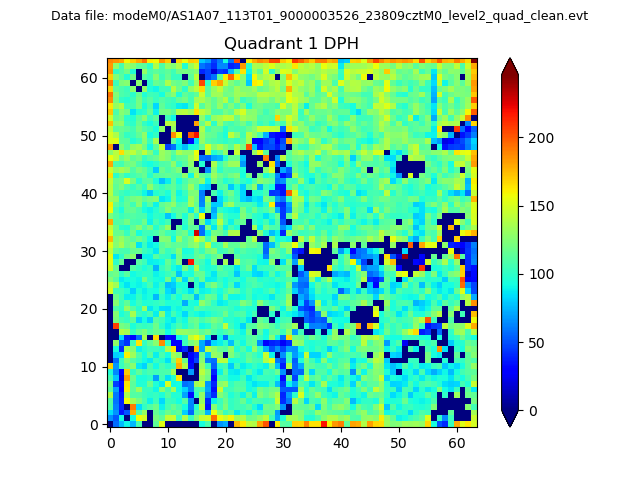 |
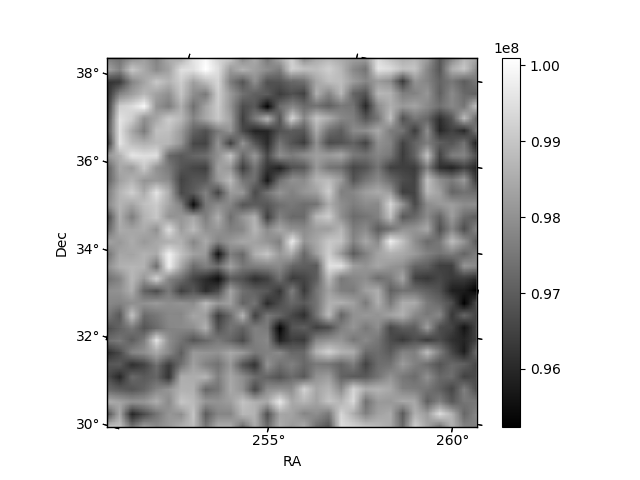
Quadrant B |
|---|---|---|---|
| Quadrant D | 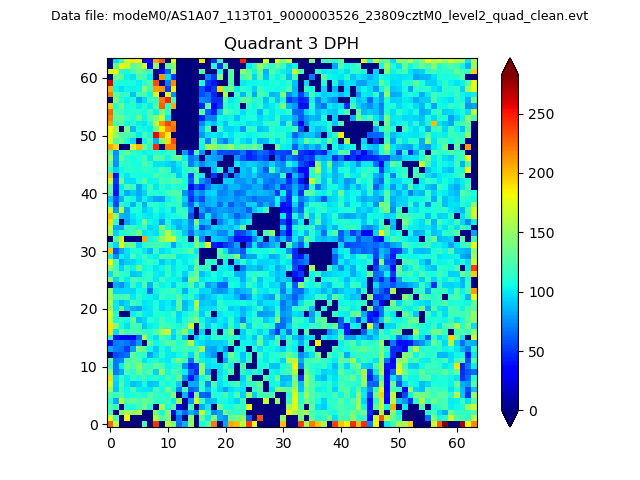 |
 |
Quadrant C |
| Plot type | Count rate plots | Images |
|---|---|---|
| Comparison with Poisson distribution Blue bars denote a histogram of data divided into 1 sec bins. Red curve is a Poisson curve with rate = median count rate of data. |
 |
 |
| Quadrant-wise count rates Data is divided into 100 sec bins |
 |
|
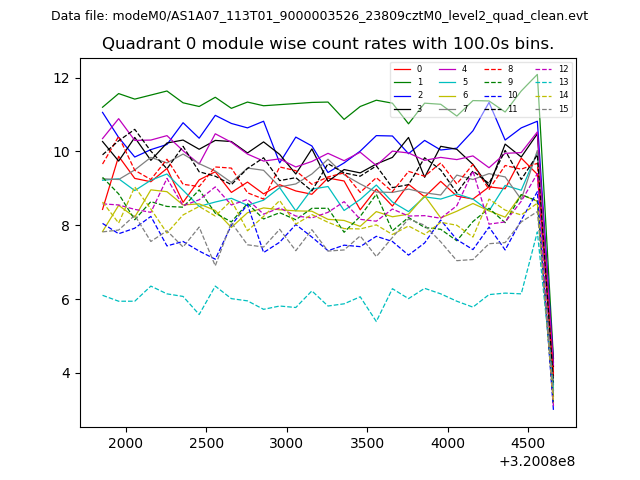
| Module-wise count rates for Quadrant A Data is divided into 100 sec bins |
 |
 |
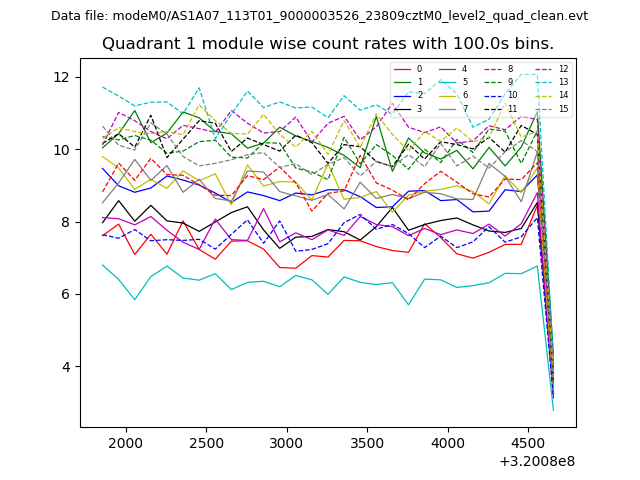
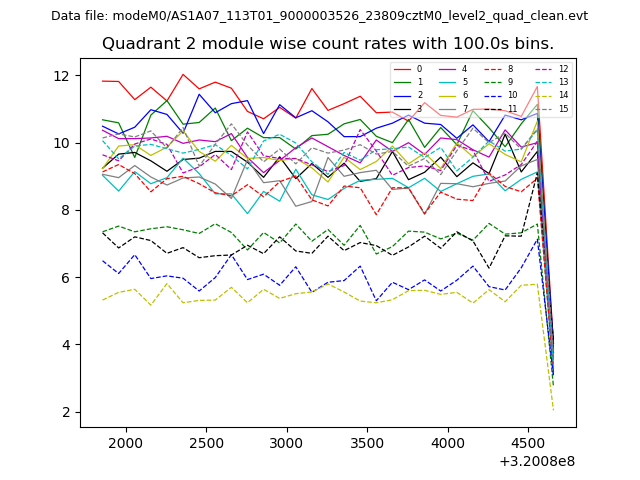
| Module-wise count rates for Quadrant B Data is divided into 100 sec bins |
 |
 |
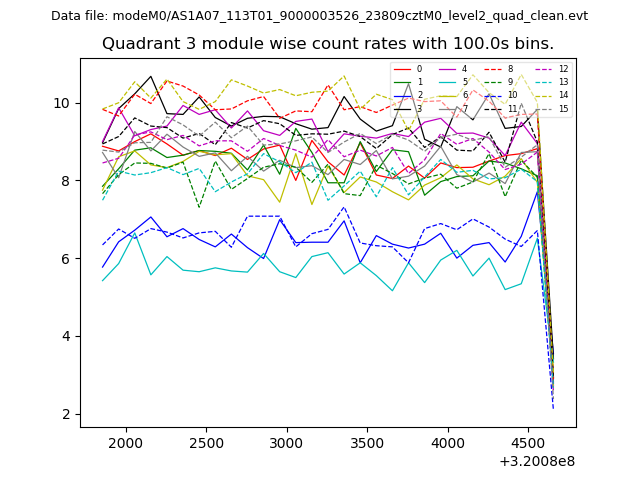
| Module-wise count rates for Quadrant C Data is divided into 100 sec bins |
 |
 |
| Module-wise count rates for Quadrant D Data is divided into 100 sec bins |
 |
 |
| Parameter | Plot |
|---|---|
| CZT HV Monitor | 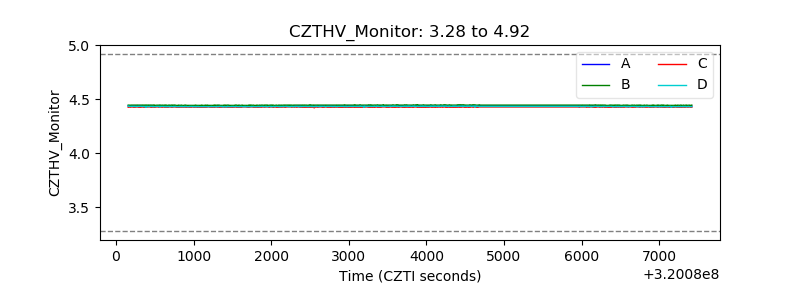 |
| D_VDD | 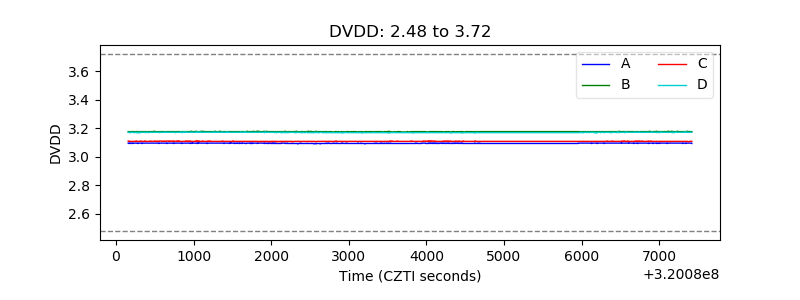 |
| Temperature 1 | 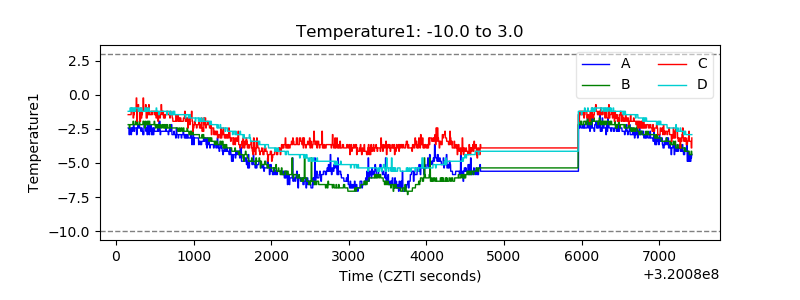 |
| Veto HV Monitor |  |
| Veto LLD | 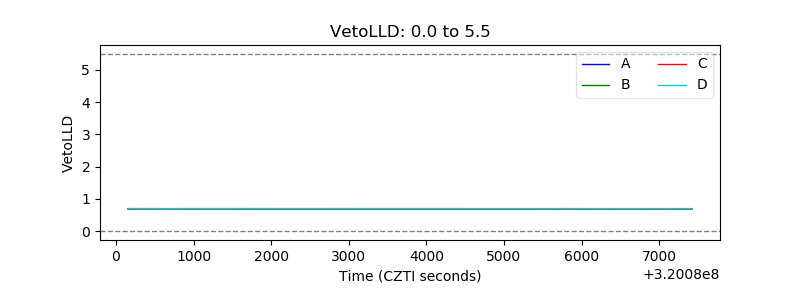 |
| Alpha Counter | 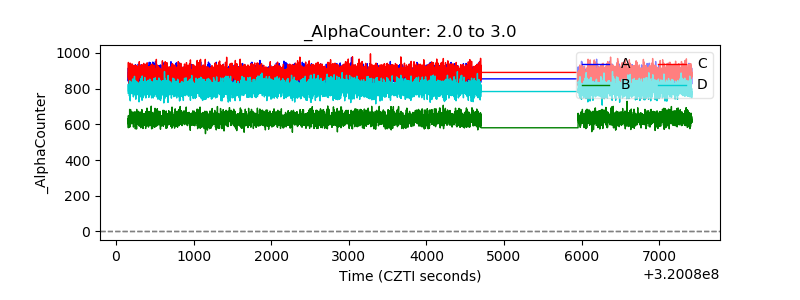 |
| _CPM_Rate |  |
| CZT Counter | 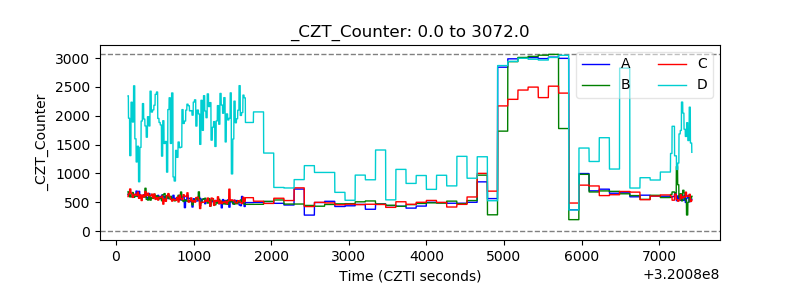 |
| +2.5 Volts monitor |  |
| +5 Volts monitor |  |
| _ROLL_ROT | 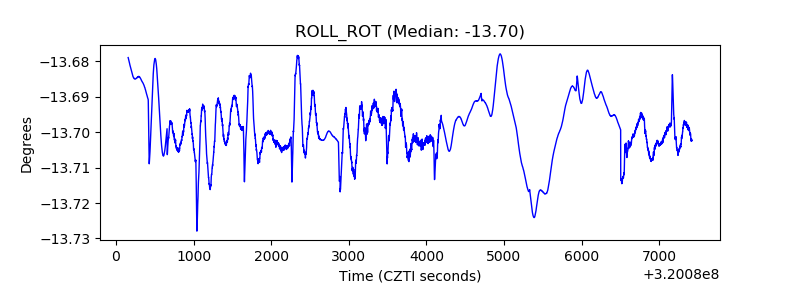 |
| _Roll_DEC | 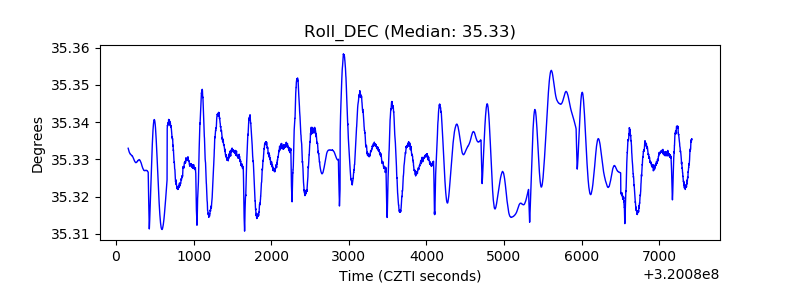 |
| _Roll_RA | 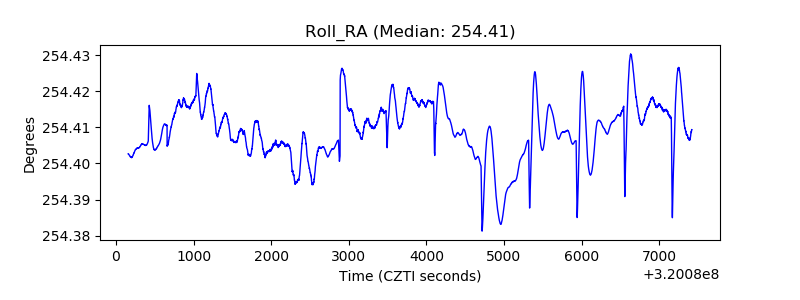 |
| Veto Counter | 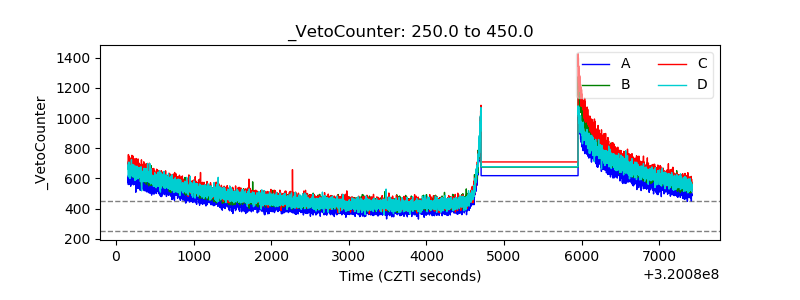 |