| Param | Original file | Final file |
|---|---|---|
| Filename | modeM0/AS1A07_113T01_9000003526_23810cztM0_level2.evt | modeM0/AS1A07_113T01_9000003526_23810cztM0_level2_quad_clean.evt |
| Size (bytes) | 671,728,320 | 75,542,400 |
| Size | 640.6 MB | 72.0 MB |
| Events in quadrant A | 3,485,942 | 473,208 |
| Events in quadrant B | 3,834,951 | 482,568 |
| Events in quadrant C | 3,635,529 | 474,136 |
| Events in quadrant D | 8,971,111 | 427,358 |
| Mode M9 | |||
|---|---|---|---|
| Quadrant | BADHDUFLAG | Total packets | Discarded packets |
| A | 0 | 20 | 0 |
| B | 0 | 21 | 0 |
| C | 0 | 21 | 0 |
| D | 0 | 21 | 0 |
| Mode SS | |||
|---|---|---|---|
| Quadrant | BADHDUFLAG | Total packets | Discarded packets |
| A | 0 | 124 | 0 |
| B | 0 | 124 | 0 |
| C | 0 | 124 | 0 |
| D | 0 | 124 | 0 |
| Mode M0 | |||
|---|---|---|---|
| Quadrant | BADHDUFLAG | Total packets | Discarded packets |
| A | 0 | 14450 | 2 |
| B | 0 | 15546 | 2 |
| C | 0 | 14933 | 2 |
| D | 0 | 30959 | 2 |
| Quadrant | Total seconds | Saturated seconds | Saturation percentage |
|---|---|---|---|
| A | 6163 | 84 | 1.362973% |
| B | 6163 | 148 | 2.401428% |
| C | 6163 | 181 | 2.936881% |
| D | 6163 | 1251 | 20.298556% |
Noise dominated data is calculated using 1-second bins in cleaned event files. If a bin has >2000 counts, and if more than 50% of those come from <1% of pixels, then it is considered to be noise-dominated and hence unusable.
| Quadrant | # 1 sec bins | Bins with >0 counts | Bins with >2000 counts | High rate bins dominated by noise | Noise dominated (total time) | Noise dominated (detector-on time) | Marked lightcurve |
|---|---|---|---|---|---|---|---|
| A | 7523 | 6163 | 5 | 5 | 0.07% | 0.08% |  |
| B | 7523 | 6163 | 48 | 48 | 0.64% | 0.78% | 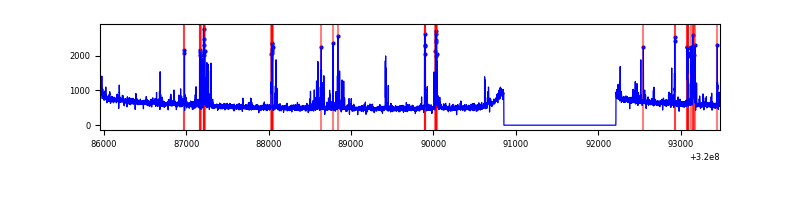 |
| C | 7523 | 6163 | 4 | 4 | 0.05% | 0.06% | 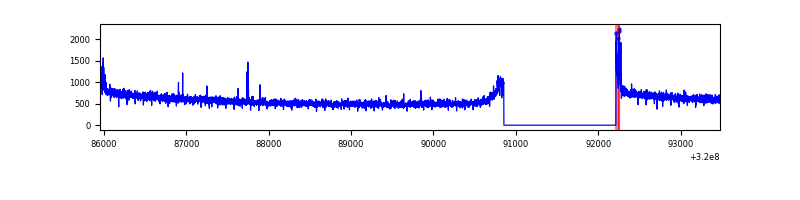 |
| D | 7523 | 6163 | 1052 | 1052 | 13.98% | 17.07% | 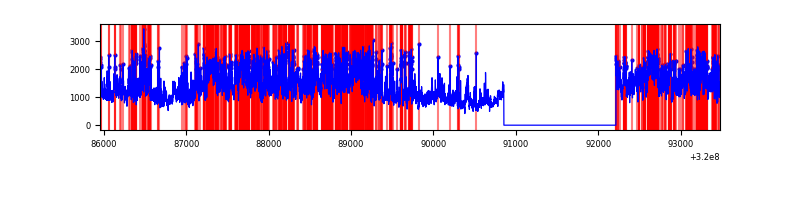 |
Top three noisy pixels from each quadrant. If the there are fewer than three noisy pixels in the level2.evt file, extra rows are filled as -1
| Pixel properties | Quadrant properties | ||||||
|---|---|---|---|---|---|---|---|
| Quadrant | DetID | PixID | Counts | Sigma | Mean | Median | Sigma |
| A | 8 | 255 | 23642 | 128.11 | 896 | 881 | 177.7 |
| A | 12 | 96 | 12302 | 64.28 | 896 | 881 | 177.7 |
| A | 13 | 254 | 10308 | 53.06 | 896 | 881 | 177.7 |
| B | 3 | 64 | 338792 | 2057.97 | 891 | 872 | 164.2 |
| B | 12 | 111 | 18412 | 106.82 | 891 | 872 | 164.2 |
| B | 11 | 111 | 16929 | 97.79 | 891 | 872 | 164.2 |
| C | 14 | 238 | 142848 | 703.93 | 879 | 890 | 201.7 |
| C | 0 | 10 | 51920 | 253.04 | 879 | 890 | 201.7 |
| C | 2 | 16 | 10547 | 47.89 | 879 | 890 | 201.7 |
| D | 8 | 195 | 3002050 | 14932.3 | 843 | 823 | 201.0 |
| D | 1 | 52 | 1512683 | 7522.11 | 843 | 823 | 201.0 |
| D | 13 | 174 | 1155763 | 5746.29 | 843 | 823 | 201.0 |
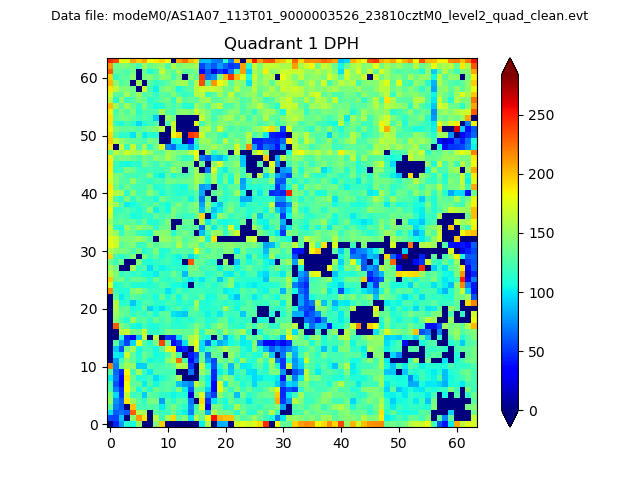
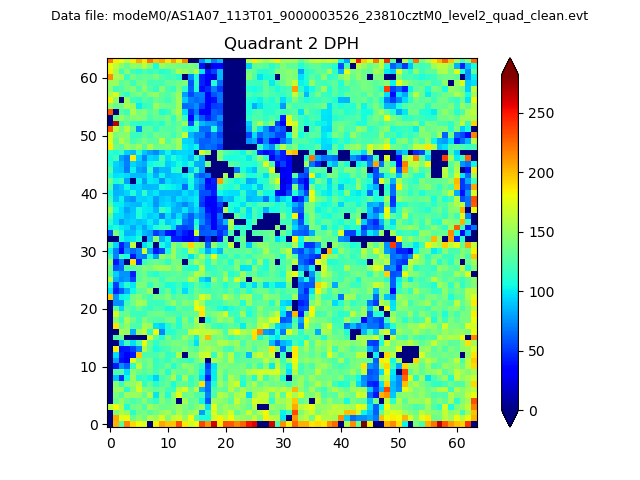
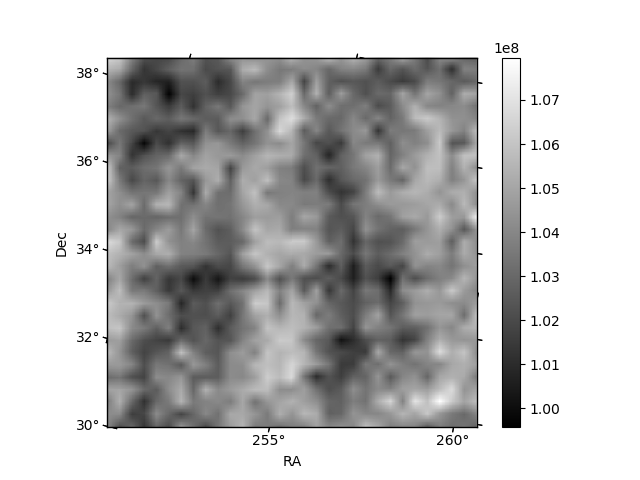
Histogram calculated using DETX and DETY for each event in the final _common_clean file
| Quadrant A | 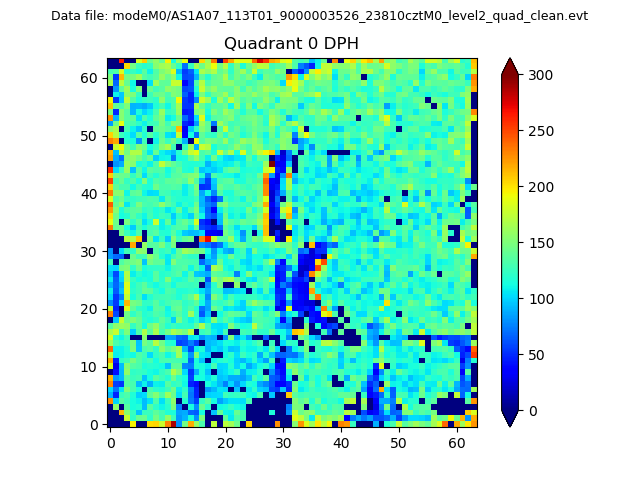 |
 |
Quadrant B |
|---|---|---|---|
| Quadrant D | 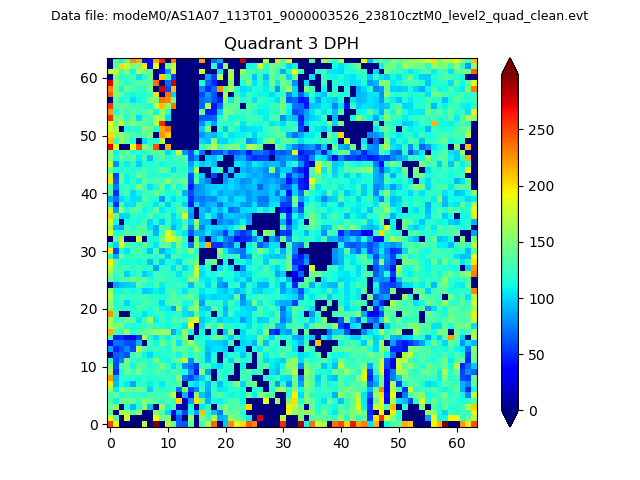 |
 |
Quadrant C |
| Plot type | Count rate plots | Images |
|---|---|---|
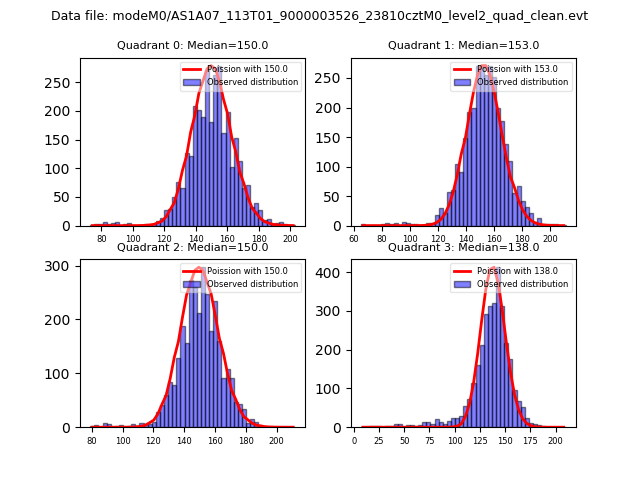
| Comparison with Poisson distribution Blue bars denote a histogram of data divided into 1 sec bins. Red curve is a Poisson curve with rate = median count rate of data. |
 |
 |
| Quadrant-wise count rates Data is divided into 100 sec bins |
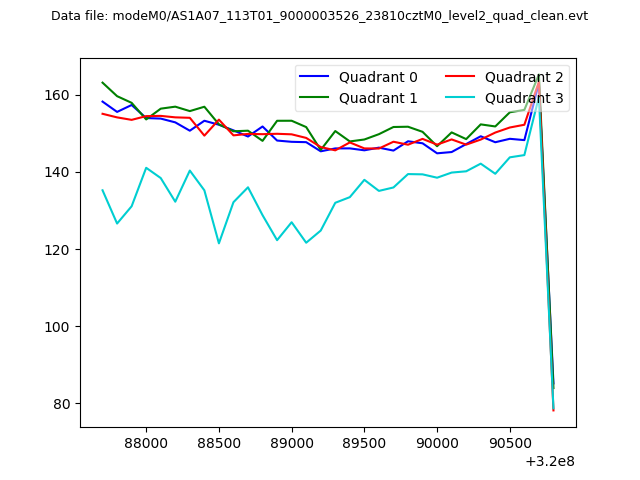 |
|
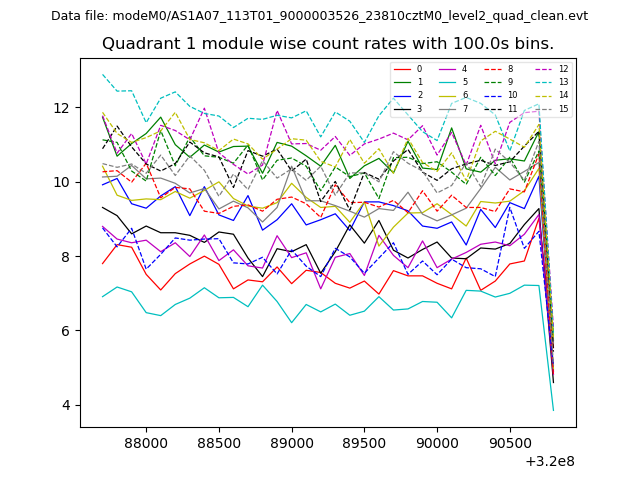
| Module-wise count rates for Quadrant A Data is divided into 100 sec bins |
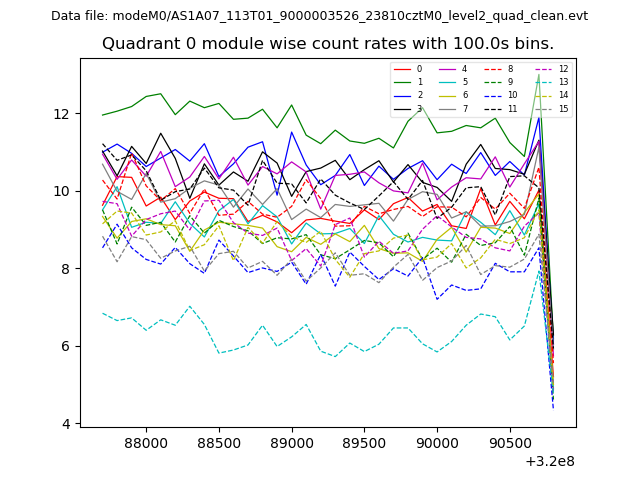 |
 |
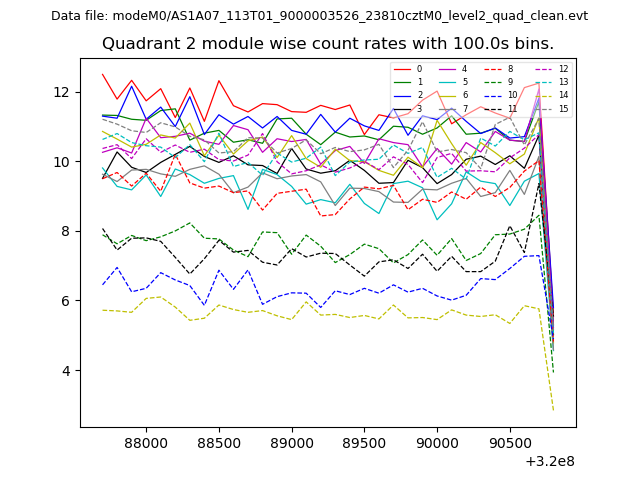
| Module-wise count rates for Quadrant B Data is divided into 100 sec bins |
 |
 |
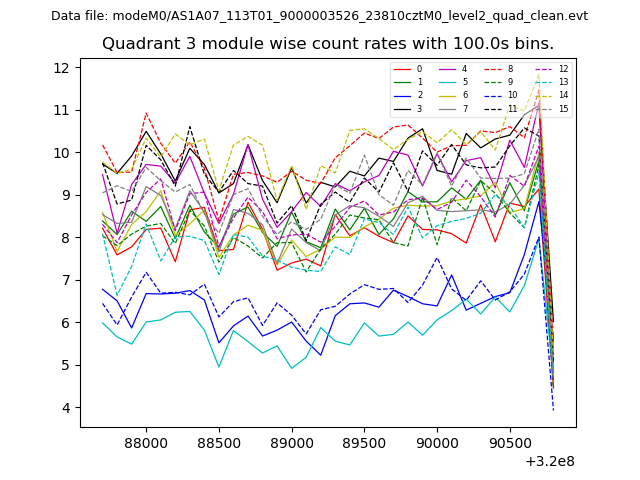
| Module-wise count rates for Quadrant C Data is divided into 100 sec bins |
 |
 |
| Module-wise count rates for Quadrant D Data is divided into 100 sec bins |
 |
 |
| Parameter | Plot |
|---|---|
| CZT HV Monitor | 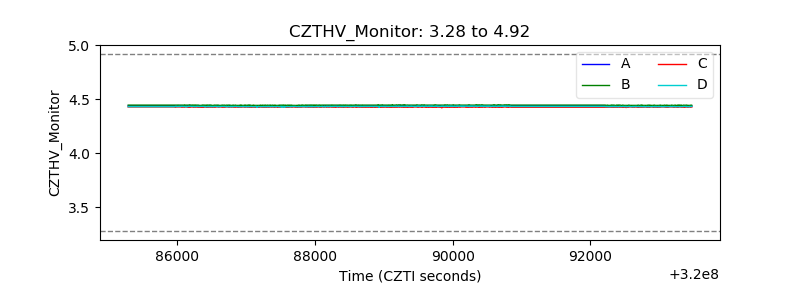 |
| D_VDD | 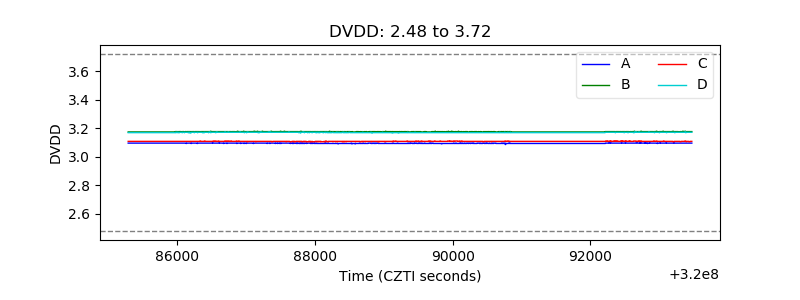 |
| Temperature 1 | 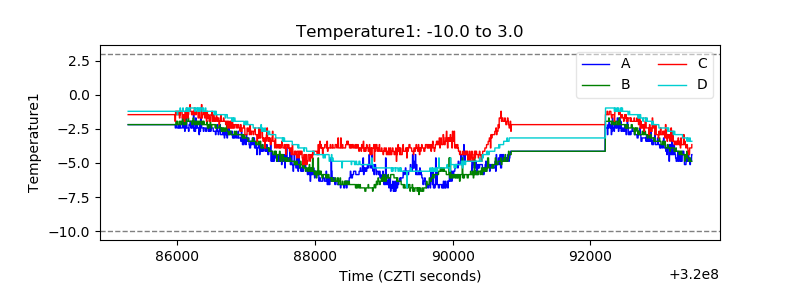 |
| Veto HV Monitor | 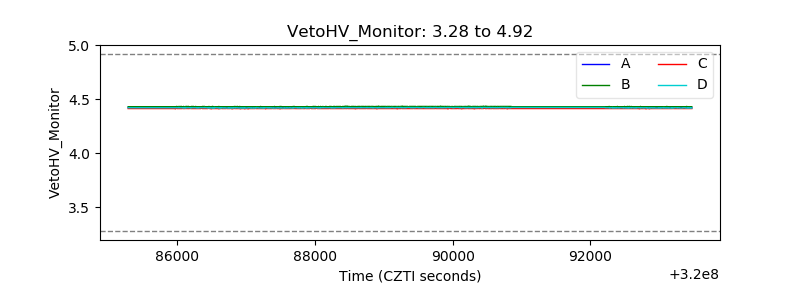 |
| Veto LLD | 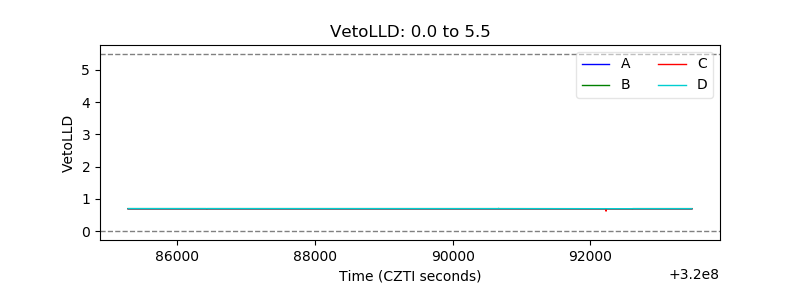 |
| Alpha Counter | 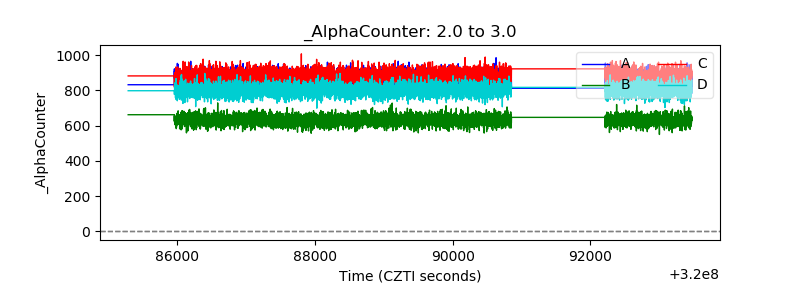 |
| _CPM_Rate | 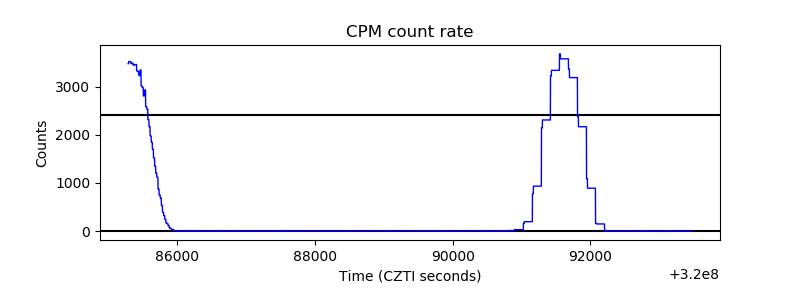 |
| CZT Counter | 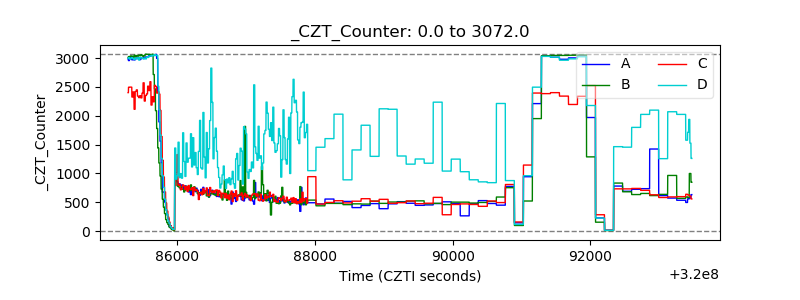 |
| +2.5 Volts monitor |  |
| +5 Volts monitor | 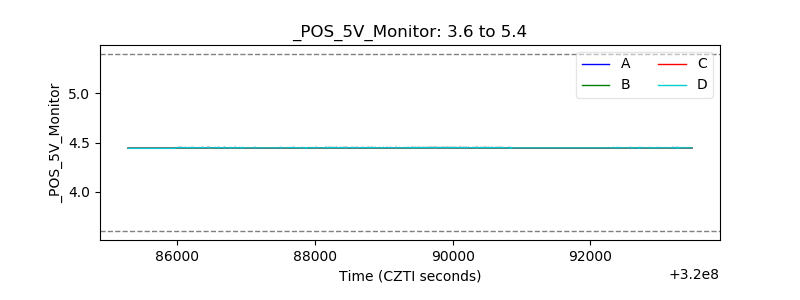 |
| _ROLL_ROT | 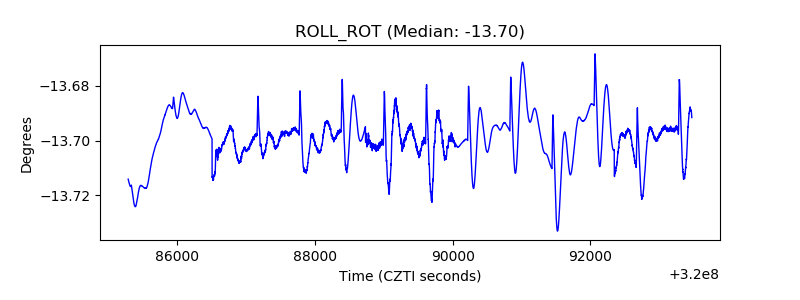 |
| _Roll_DEC | 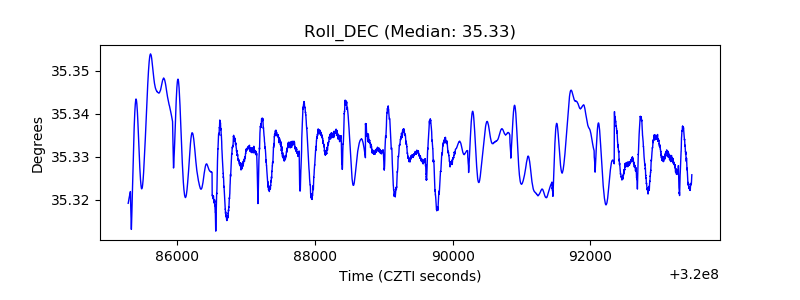 |
| _Roll_RA | 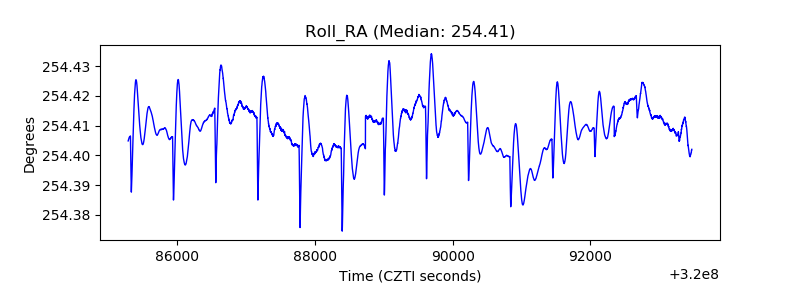 |
| Veto Counter | 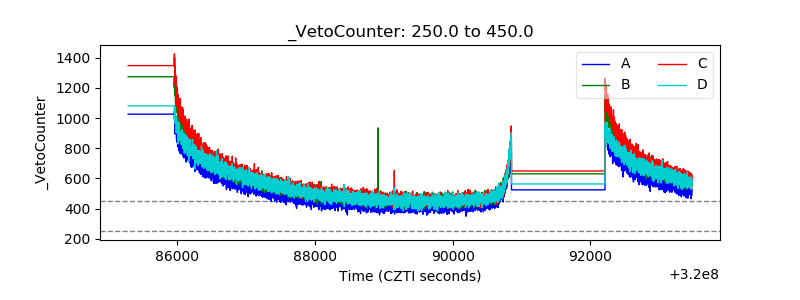 |