| Param | Original file | Final file |
|---|---|---|
| Filename | modeM0/AS1A07_113T01_9000003526_23811cztM0_level2.evt | modeM0/AS1A07_113T01_9000003526_23811cztM0_level2_quad_clean.evt |
| Size (bytes) | 622,261,440 | 90,339,840 |
| Size | 593.4 MB | 86.2 MB |
| Events in quadrant A | 3,344,023 | 581,211 |
| Events in quadrant B | 3,773,310 | 593,660 |
| Events in quadrant C | 3,573,215 | 588,659 |
| Events in quadrant D | 7,742,411 | 546,161 |
| Mode M9 | |||
|---|---|---|---|
| Quadrant | BADHDUFLAG | Total packets | Discarded packets |
| A | 0 | 21 | 0 |
| B | 0 | 22 | 0 |
| C | 0 | 22 | 0 |
| D | 0 | 22 | 0 |
| Mode SS | |||
|---|---|---|---|
| Quadrant | BADHDUFLAG | Total packets | Discarded packets |
| A | 0 | 124 | 0 |
| B | 0 | 124 | 0 |
| C | 0 | 124 | 0 |
| D | 0 | 124 | 0 |
| Mode M0 | |||
|---|---|---|---|
| Quadrant | BADHDUFLAG | Total packets | Discarded packets |
| A | 0 | 13892 | 2 |
| B | 0 | 15194 | 2 |
| C | 0 | 14638 | 2 |
| D | 0 | 27356 | 2 |
| Quadrant | Total seconds | Saturated seconds | Saturation percentage |
|---|---|---|---|
| A | 6101 | 51 | 0.835929% |
| B | 6101 | 164 | 2.688084% |
| C | 6101 | 181 | 2.966727% |
| D | 6101 | 963 | 15.784298% |
Noise dominated data is calculated using 1-second bins in cleaned event files. If a bin has >2000 counts, and if more than 50% of those come from <1% of pixels, then it is considered to be noise-dominated and hence unusable.
| Quadrant | # 1 sec bins | Bins with >0 counts | Bins with >2000 counts | High rate bins dominated by noise | Noise dominated (total time) | Noise dominated (detector-on time) | Marked lightcurve |
|---|---|---|---|---|---|---|---|
| A | 7496 | 6101 | 0 | 0 | 0.00% | 0.00% | 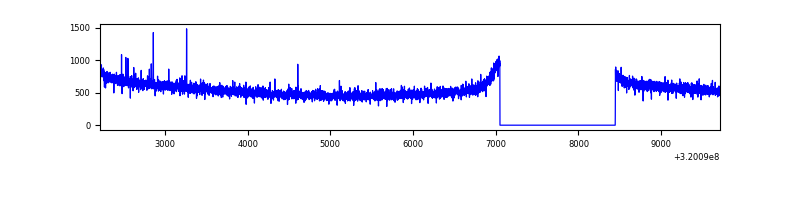 |
| B | 7496 | 6101 | 82 | 82 | 1.09% | 1.34% | 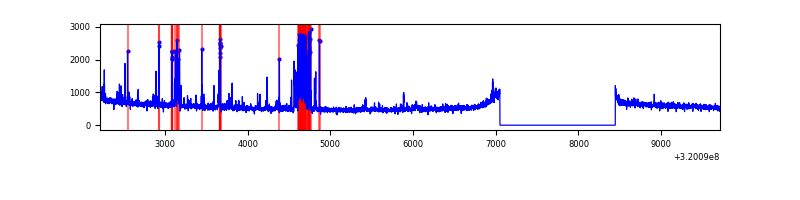 |
| C | 7496 | 6101 | 13 | 13 | 0.17% | 0.21% | 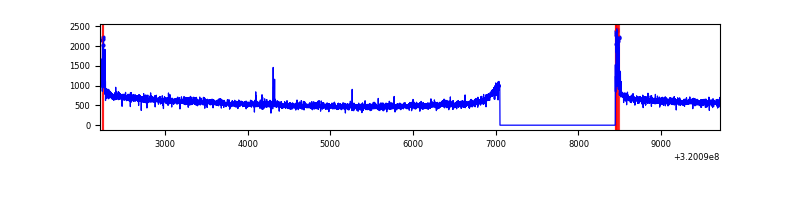 |
| D | 7496 | 6101 | 662 | 662 | 8.83% | 10.85% | 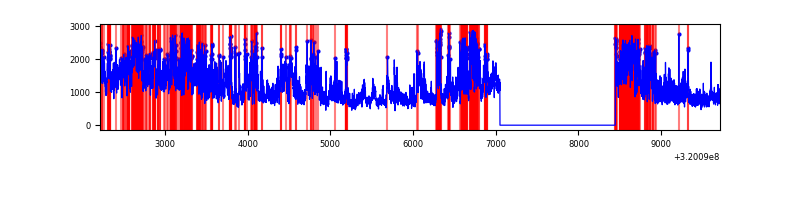 |
Top three noisy pixels from each quadrant. If the there are fewer than three noisy pixels in the level2.evt file, extra rows are filled as -1
| Pixel properties | Quadrant properties | ||||||
|---|---|---|---|---|---|---|---|
| Quadrant | DetID | PixID | Counts | Sigma | Mean | Median | Sigma |
| A | 12 | 96 | 10358 | 55.07 | 865 | 852 | 172.6 |
| A | 13 | 254 | 10265 | 54.53 | 865 | 852 | 172.6 |
| A | 0 | 226 | 7518 | 38.62 | 865 | 852 | 172.6 |
| B | 3 | 64 | 395232 | 2492.32 | 861 | 845 | 158.2 |
| B | 12 | 111 | 17983 | 108.3 | 861 | 845 | 158.2 |
| B | 11 | 111 | 16229 | 97.22 | 861 | 845 | 158.2 |
| C | 14 | 238 | 139684 | 709.8 | 854 | 867 | 195.6 |
| C | 0 | 10 | 94122 | 476.83 | 854 | 867 | 195.6 |
| C | 5 | 4 | 6564 | 29.13 | 854 | 867 | 195.6 |
| D | 8 | 195 | 2585370 | 13012.63 | 824 | 802 | 198.6 |
| D | 1 | 52 | 1065263 | 5359.28 | 824 | 802 | 198.6 |
| D | 13 | 174 | 556305 | 2796.81 | 824 | 802 | 198.6 |
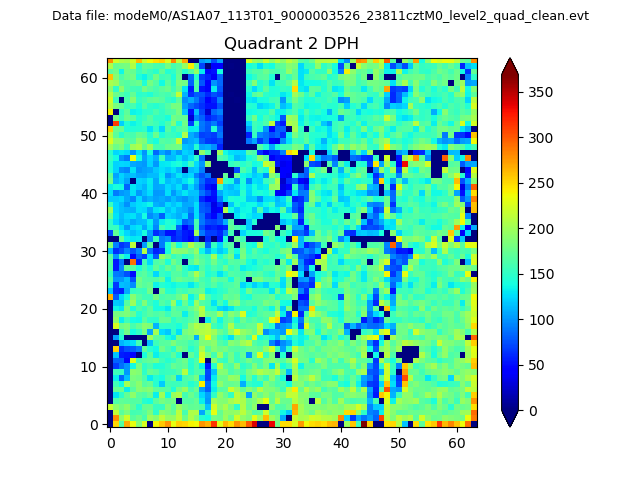
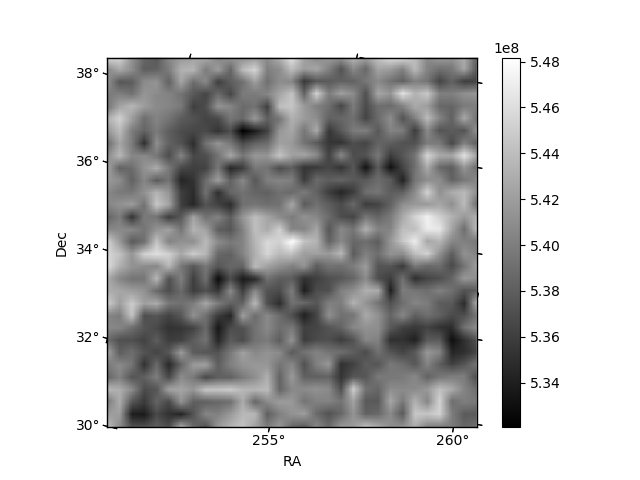
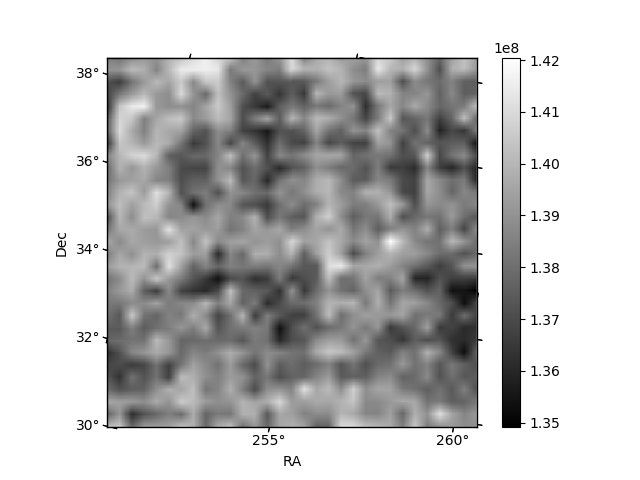
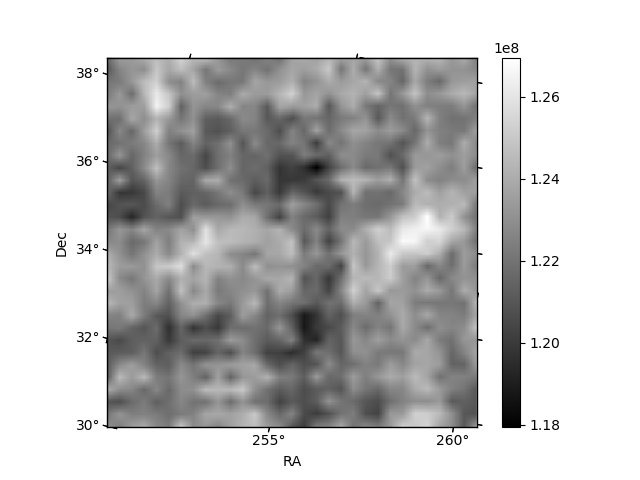
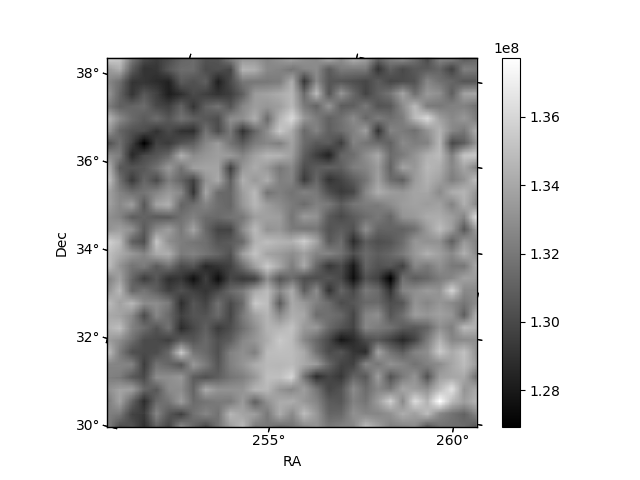
Histogram calculated using DETX and DETY for each event in the final _common_clean file
| Quadrant A | 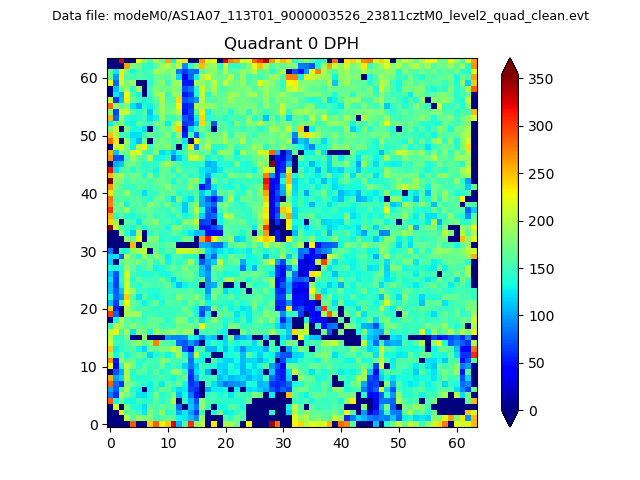 |
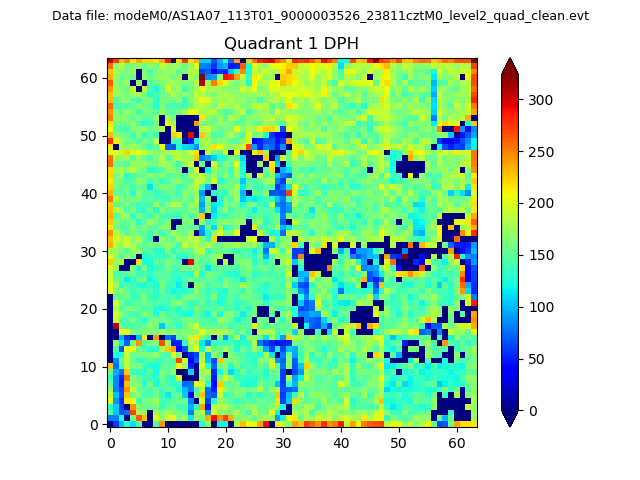 |
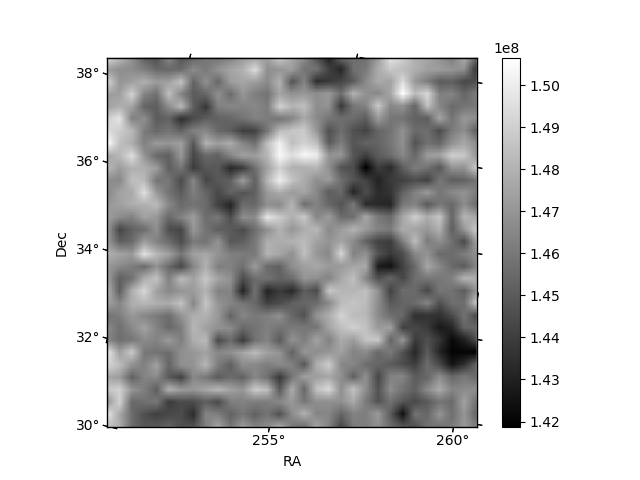
Quadrant B |
|---|---|---|---|
| Quadrant D | 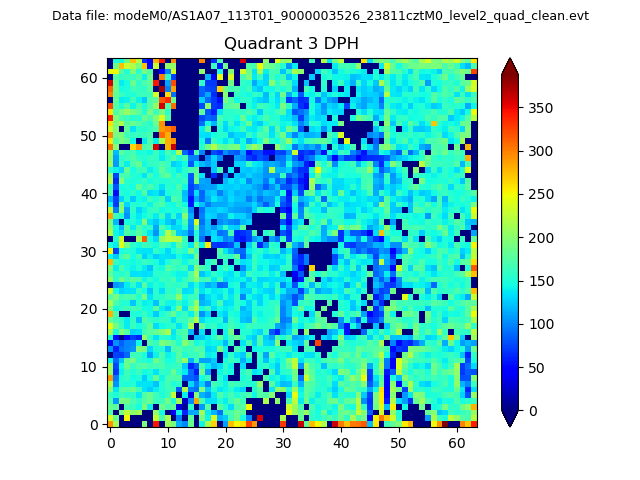 |
 |
Quadrant C |
| Plot type | Count rate plots | Images |
|---|---|---|
| Comparison with Poisson distribution Blue bars denote a histogram of data divided into 1 sec bins. Red curve is a Poisson curve with rate = median count rate of data. |
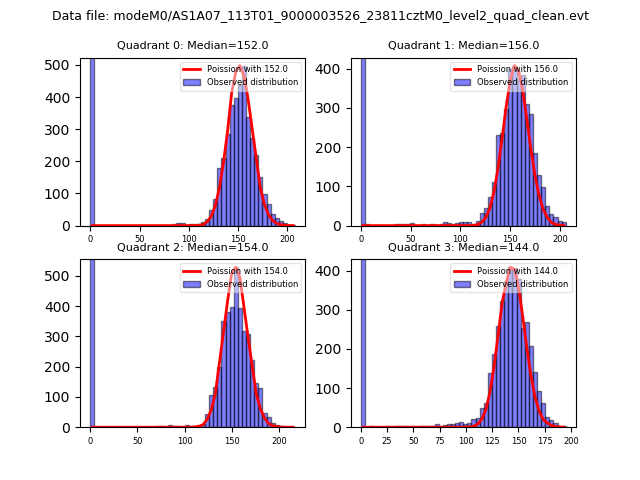 |
 |
| Quadrant-wise count rates Data is divided into 100 sec bins |
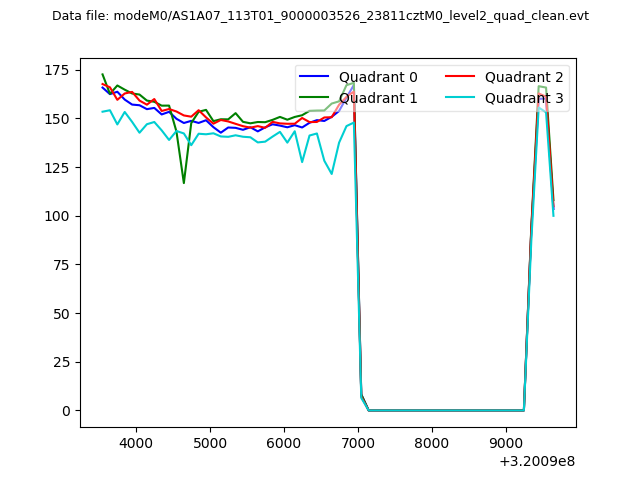 |
|
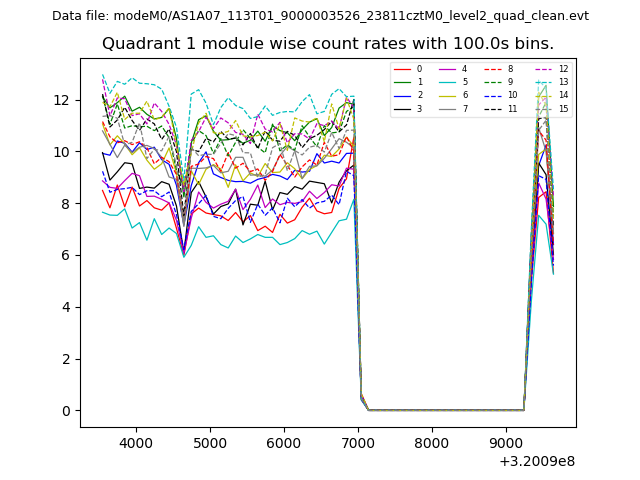
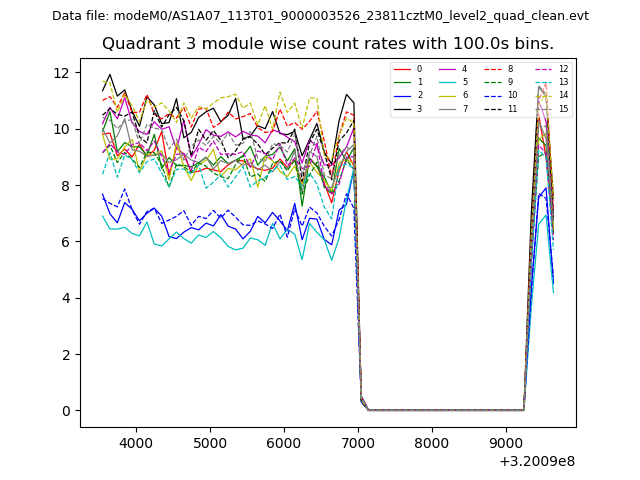
| Module-wise count rates for Quadrant A Data is divided into 100 sec bins |
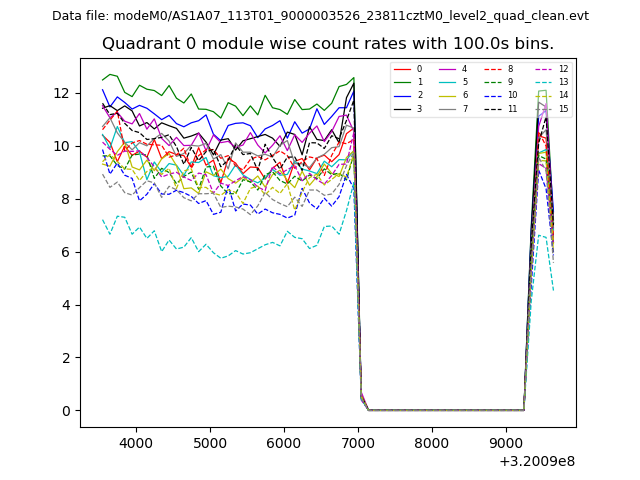 |
 |
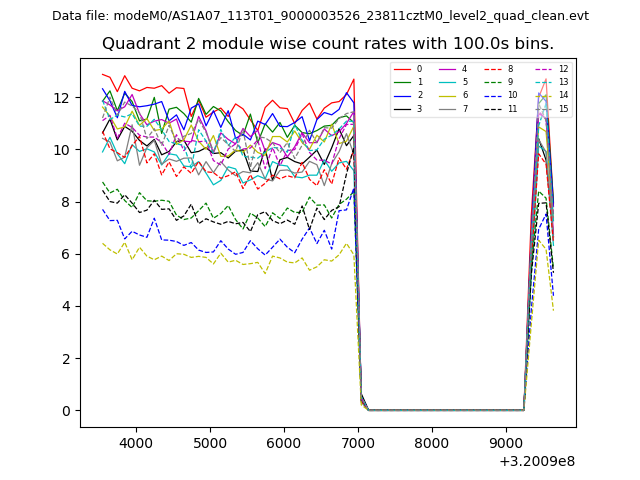
| Module-wise count rates for Quadrant B Data is divided into 100 sec bins |
 |
 |
| Module-wise count rates for Quadrant C Data is divided into 100 sec bins |
 |
 |
| Module-wise count rates for Quadrant D Data is divided into 100 sec bins |
 |
 |
| Parameter | Plot |
|---|---|
| CZT HV Monitor | 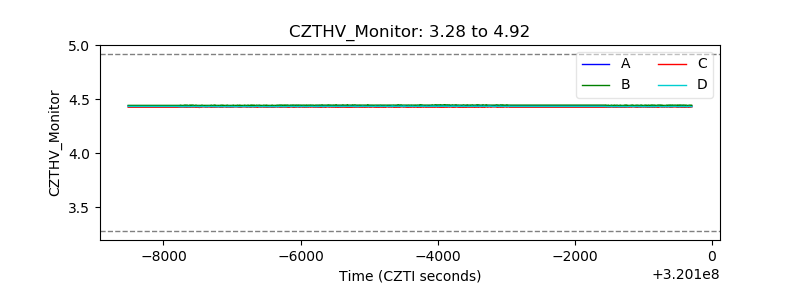 |
| D_VDD | 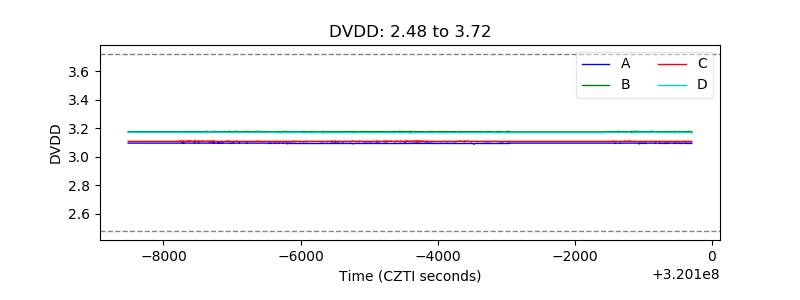 |
| Temperature 1 | 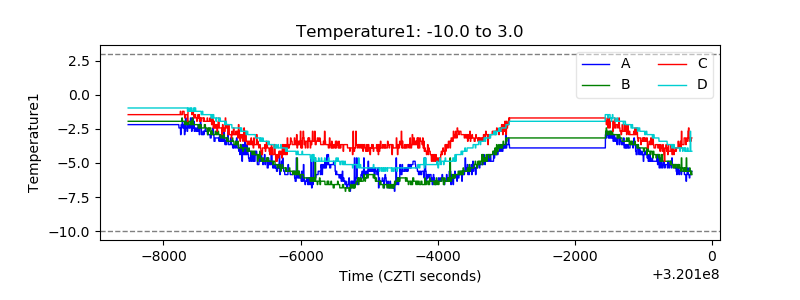 |
| Veto HV Monitor | 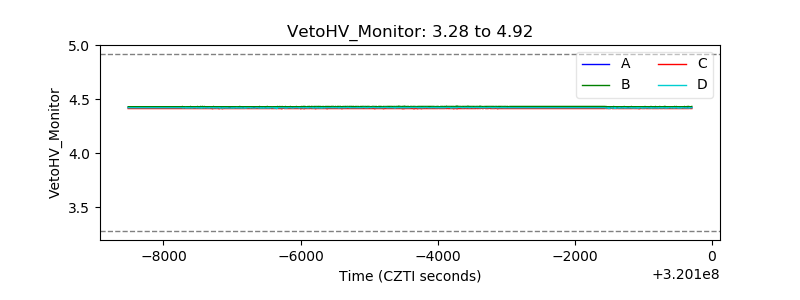 |
| Veto LLD | 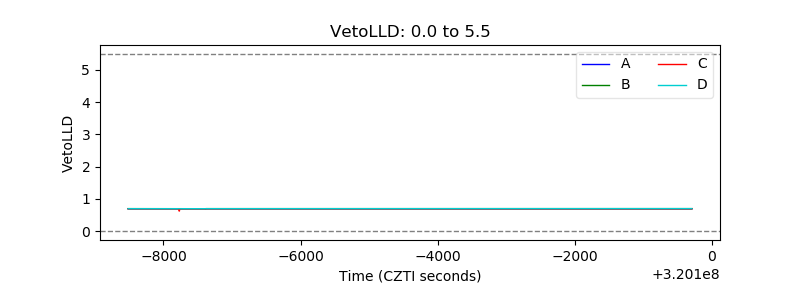 |
| Alpha Counter | 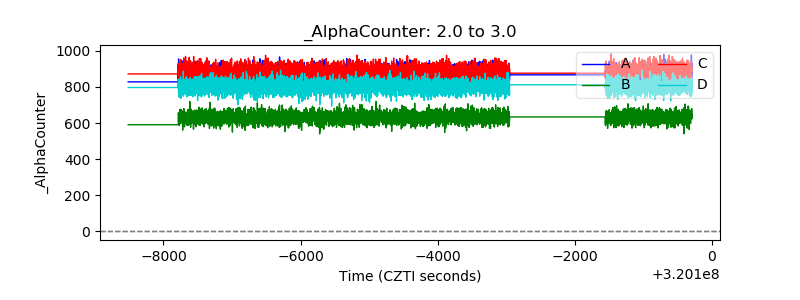 |
| _CPM_Rate | 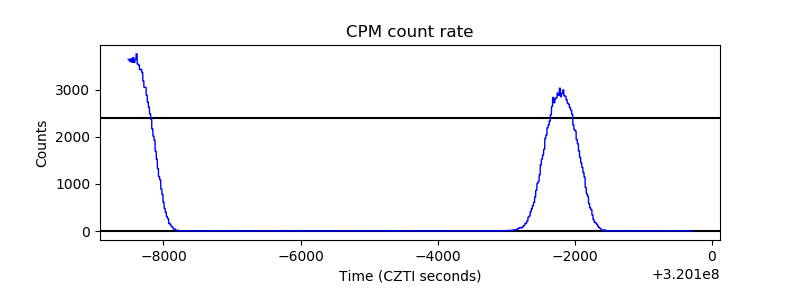 |
| CZT Counter | 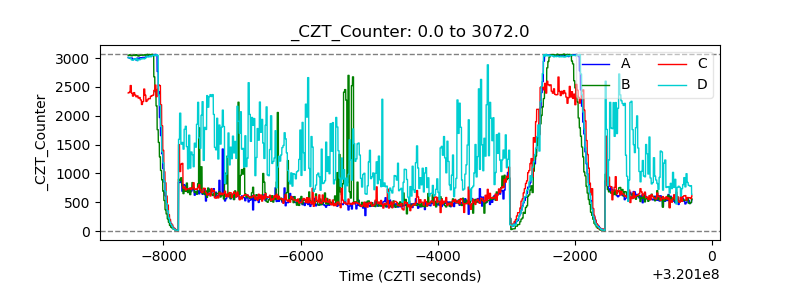 |
| +2.5 Volts monitor |  |
| +5 Volts monitor |  |
| _ROLL_ROT | 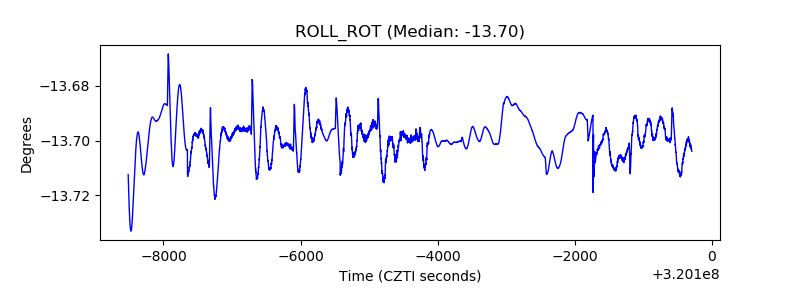 |
| _Roll_DEC | 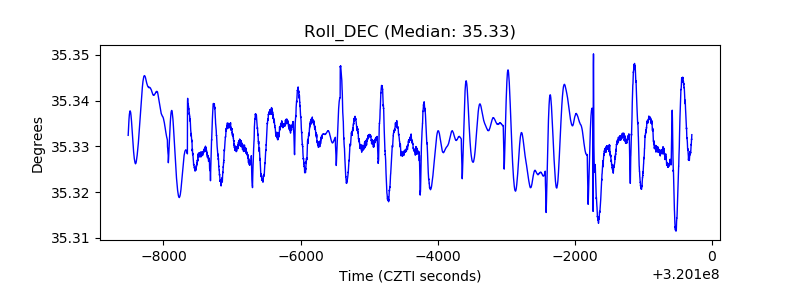 |
| _Roll_RA | 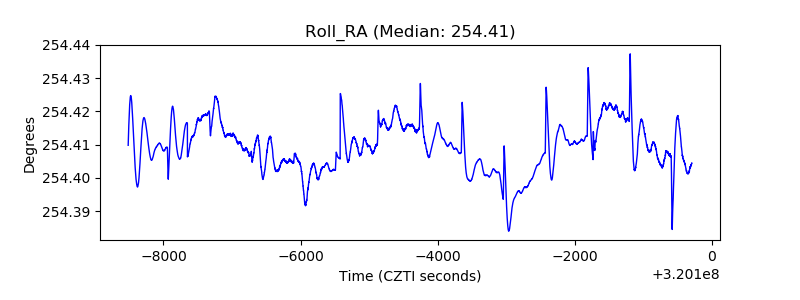 |
| Veto Counter | 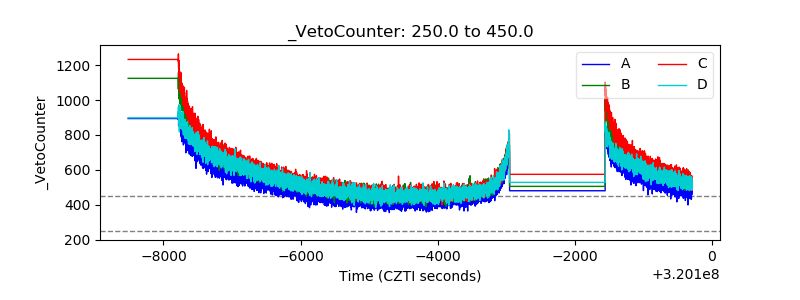 |