| Param | Original file | Final file |
|---|---|---|
| Filename | modeM0/AS1A07_113T01_9000003526_23812cztM0_level2.evt | modeM0/AS1A07_113T01_9000003526_23812cztM0_level2_quad_clean.evt |
| Size (bytes) | 576,570,240 | 100,915,200 |
| Size | 549.9 MB | 96.2 MB |
| Events in quadrant A | 3,272,010 | 655,090 |
| Events in quadrant B | 3,434,518 | 676,442 |
| Events in quadrant C | 3,474,575 | 664,684 |
| Events in quadrant D | 6,854,336 | 620,686 |
| Mode M9 | |||
|---|---|---|---|
| Quadrant | BADHDUFLAG | Total packets | Discarded packets |
| A | 0 | 13 | 0 |
| B | 0 | 14 | 0 |
| C | 0 | 14 | 0 |
| D | 0 | 14 | 0 |
| Mode SS | |||
|---|---|---|---|
| Quadrant | BADHDUFLAG | Total packets | Discarded packets |
| A | 0 | 128 | 0 |
| B | 0 | 128 | 0 |
| C | 0 | 128 | 0 |
| D | 0 | 128 | 0 |
| Mode M0 | |||
|---|---|---|---|
| Quadrant | BADHDUFLAG | Total packets | Discarded packets |
| A | 0 | 13675 | 2 |
| B | 0 | 14111 | 2 |
| C | 0 | 14259 | 2 |
| D | 0 | 24879 | 2 |
| Quadrant | Total seconds | Saturated seconds | Saturation percentage |
|---|---|---|---|
| A | 6293 | 64 | 1.017003% |
| B | 6293 | 104 | 1.652630% |
| C | 6293 | 162 | 2.574289% |
| D | 6292 | 823 | 13.080102% |
Noise dominated data is calculated using 1-second bins in cleaned event files. If a bin has >2000 counts, and if more than 50% of those come from <1% of pixels, then it is considered to be noise-dominated and hence unusable.
| Quadrant | # 1 sec bins | Bins with >0 counts | Bins with >2000 counts | High rate bins dominated by noise | Noise dominated (total time) | Noise dominated (detector-on time) | Marked lightcurve |
|---|---|---|---|---|---|---|---|
| A | 7593 | 6293 | 0 | 0 | 0.00% | 0.00% | 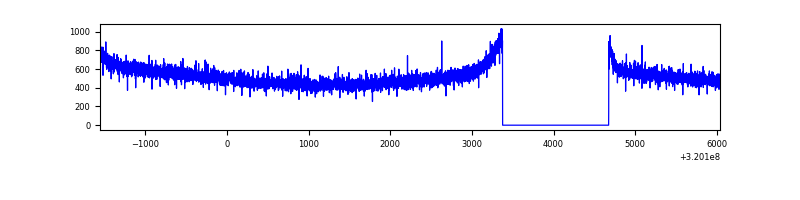 |
| B | 7593 | 6293 | 14 | 14 | 0.18% | 0.22% | 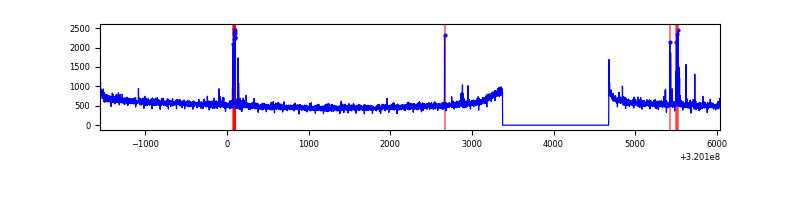 |
| C | 7593 | 6293 | 11 | 11 | 0.14% | 0.17% | 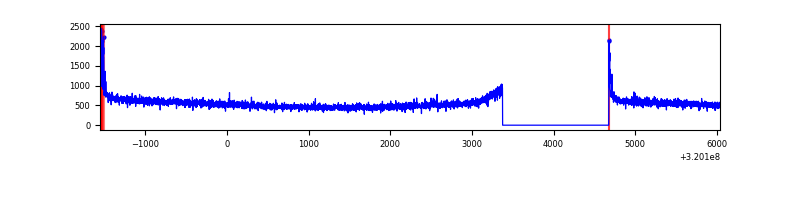 |
| D | 7592 | 6293 | 519 | 519 | 6.84% | 8.25% |  |
Top three noisy pixels from each quadrant. If the there are fewer than three noisy pixels in the level2.evt file, extra rows are filled as -1
| Pixel properties | Quadrant properties | ||||||
|---|---|---|---|---|---|---|---|
| Quadrant | DetID | PixID | Counts | Sigma | Mean | Median | Sigma |
| A | 13 | 254 | 10891 | 59.76 | 848 | 833 | 168.3 |
| A | 3 | 137 | 7180 | 37.71 | 848 | 833 | 168.3 |
| A | 0 | 226 | 7147 | 37.52 | 848 | 833 | 168.3 |
| B | 3 | 64 | 98484 | 607.33 | 851 | 832 | 160.8 |
| B | 12 | 111 | 18704 | 111.15 | 851 | 832 | 160.8 |
| B | 11 | 111 | 16836 | 99.53 | 851 | 832 | 160.8 |
| C | 14 | 238 | 133842 | 689.98 | 834 | 843 | 192.8 |
| C | 0 | 10 | 71497 | 366.54 | 834 | 843 | 192.8 |
| C | 7 | 247 | 7745 | 35.81 | 834 | 843 | 192.8 |
| D | 8 | 195 | 1613914 | 8195.45 | 813 | 792 | 196.8 |
| D | 13 | 174 | 919675 | 4668.38 | 813 | 792 | 196.8 |
| D | 1 | 52 | 714692 | 3626.96 | 813 | 792 | 196.8 |
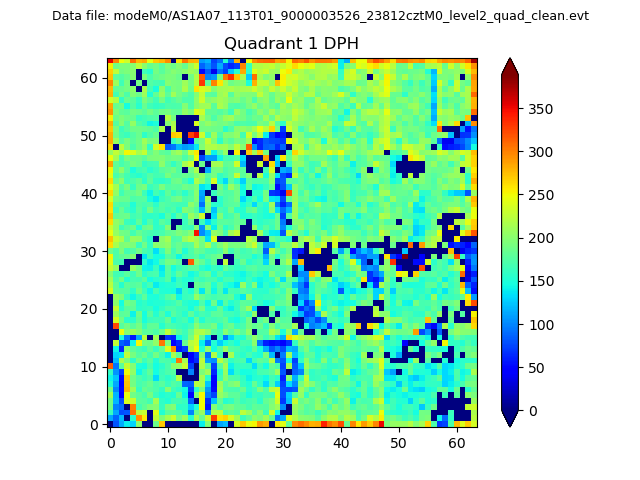
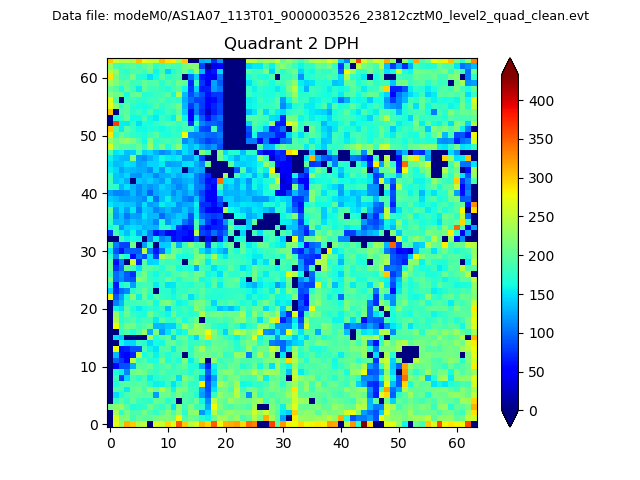
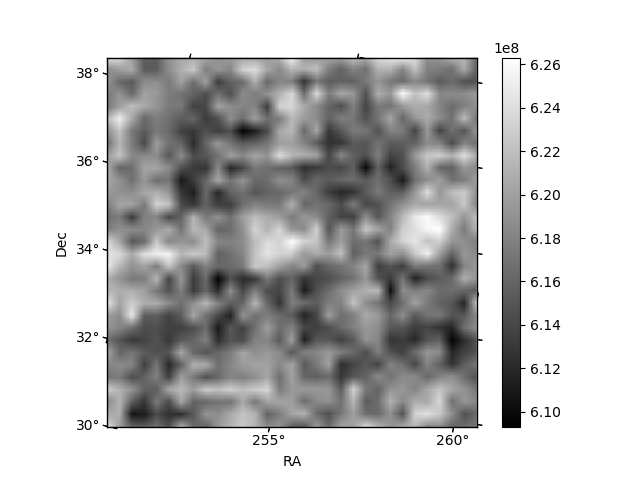
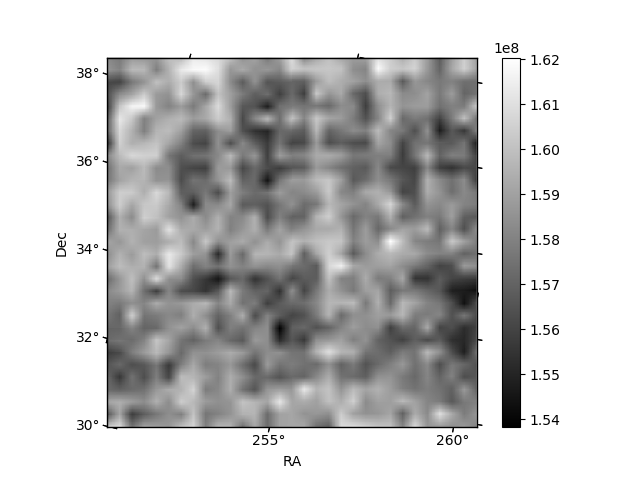
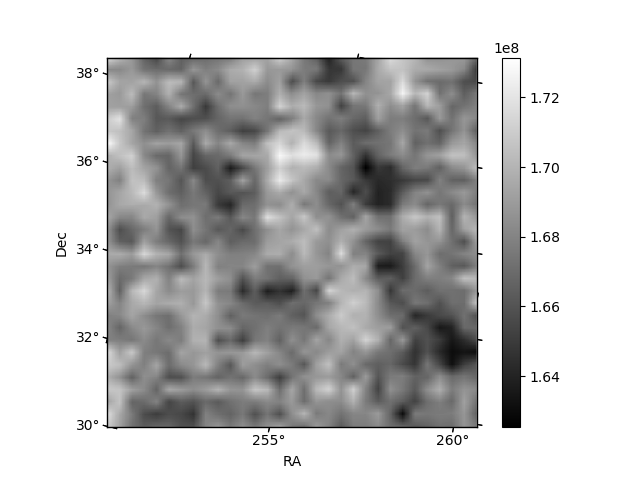
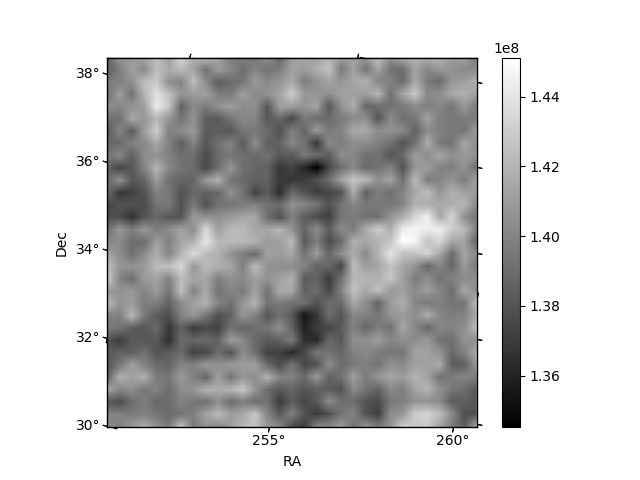
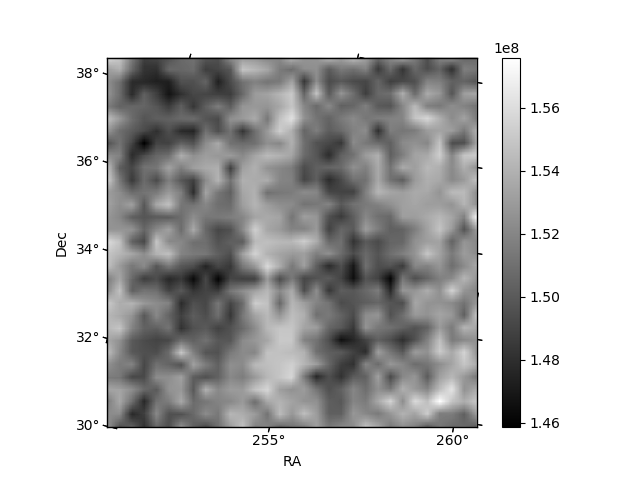
Histogram calculated using DETX and DETY for each event in the final _common_clean file
| Quadrant A | 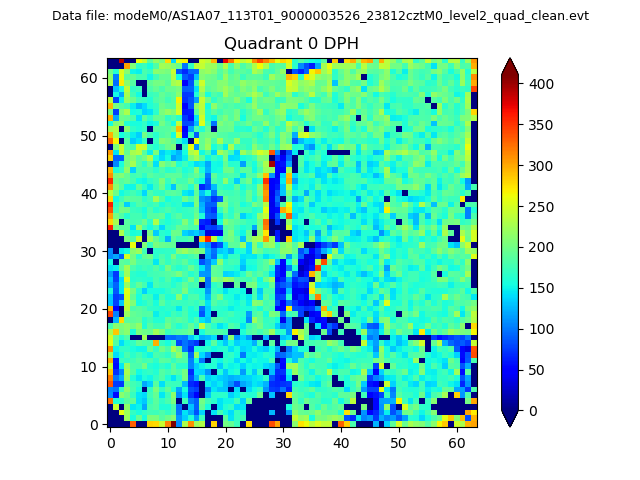 |
 |
Quadrant B |
|---|---|---|---|
| Quadrant D | 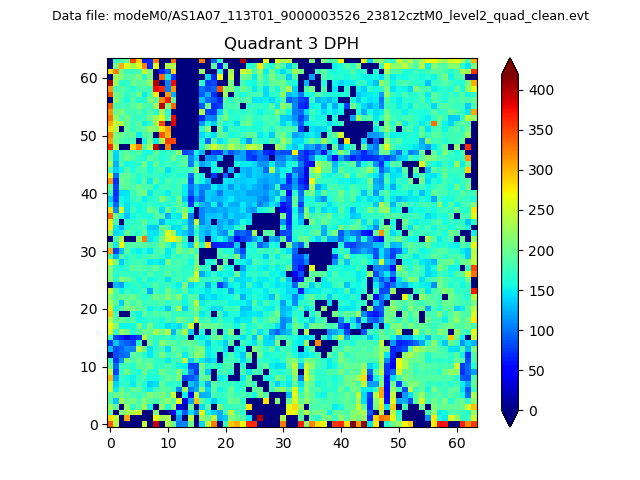 |
 |
Quadrant C |
| Plot type | Count rate plots | Images |
|---|---|---|
| Comparison with Poisson distribution Blue bars denote a histogram of data divided into 1 sec bins. Red curve is a Poisson curve with rate = median count rate of data. |
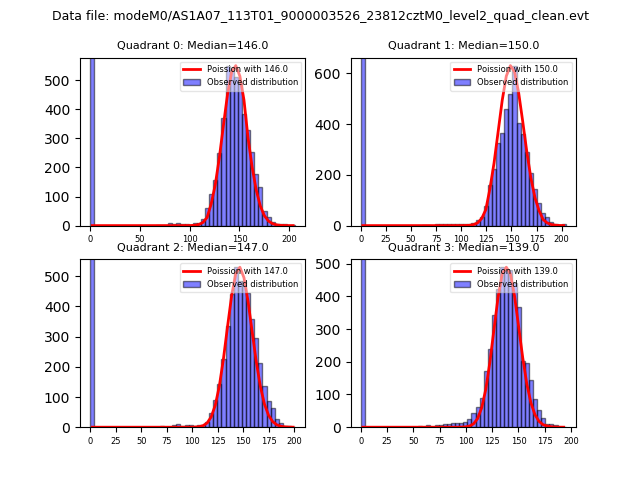 |
 |
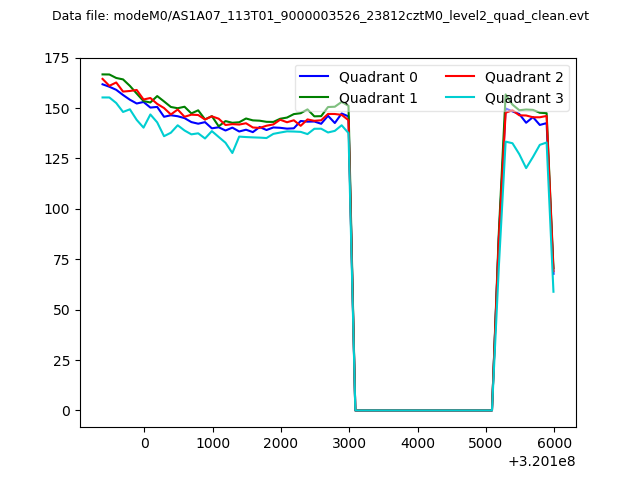
| Quadrant-wise count rates Data is divided into 100 sec bins |
 |
|
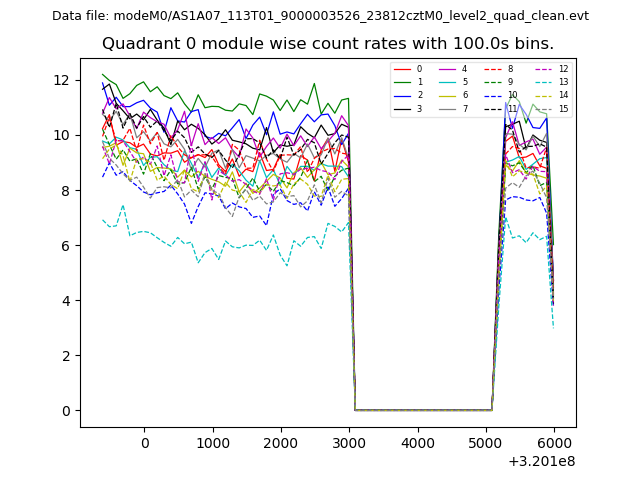
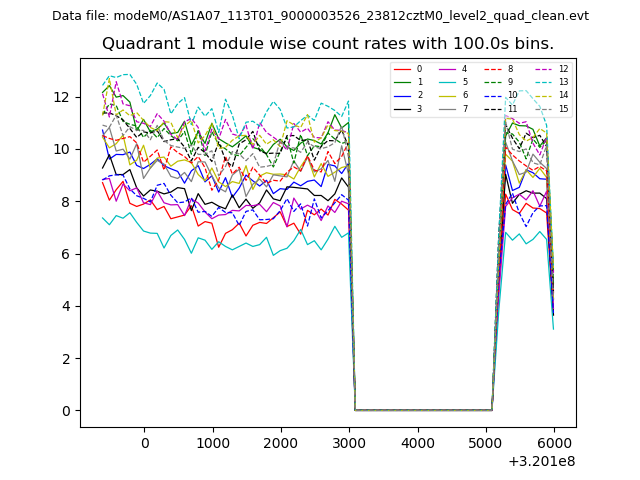
| Module-wise count rates for Quadrant A Data is divided into 100 sec bins |
 |
 |
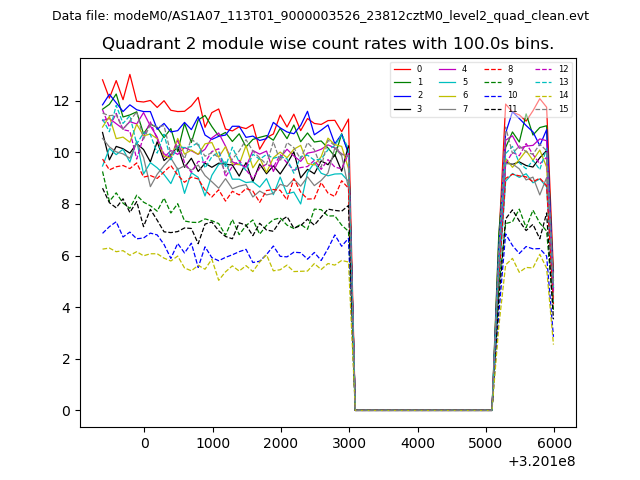
| Module-wise count rates for Quadrant B Data is divided into 100 sec bins |
 |
 |
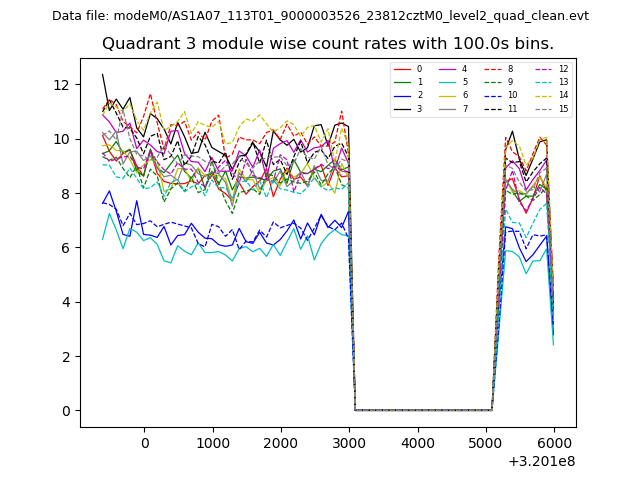
| Module-wise count rates for Quadrant C Data is divided into 100 sec bins |
 |
 |
| Module-wise count rates for Quadrant D Data is divided into 100 sec bins |
 |
 |
| Parameter | Plot |
|---|---|
| CZT HV Monitor | 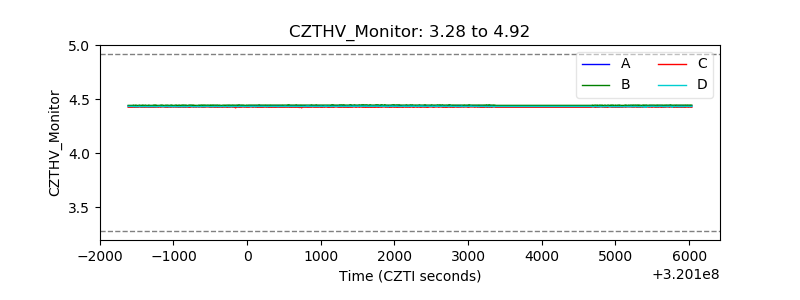 |
| D_VDD | 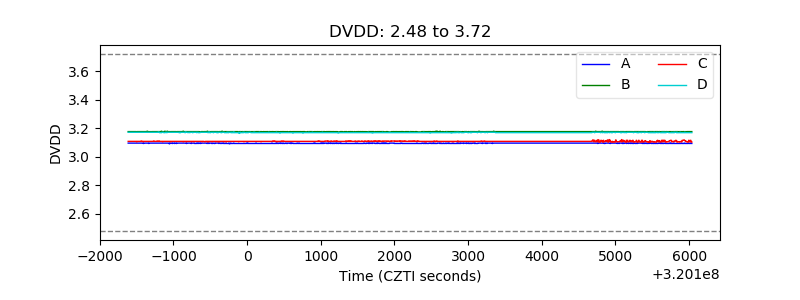 |
| Temperature 1 | 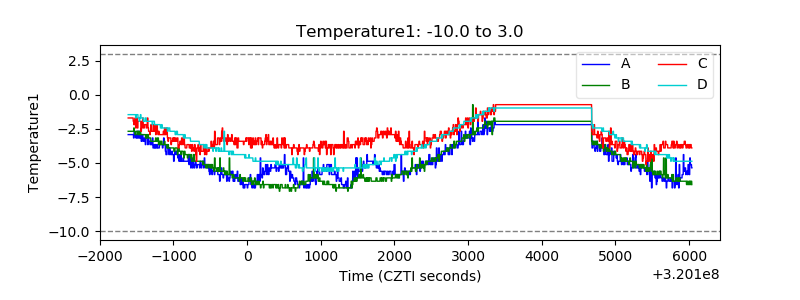 |
| Veto HV Monitor | 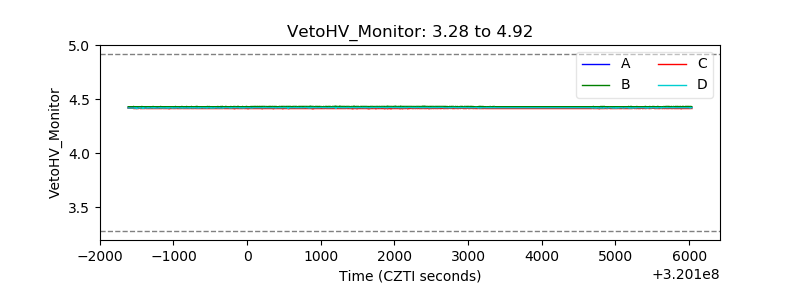 |
| Veto LLD | 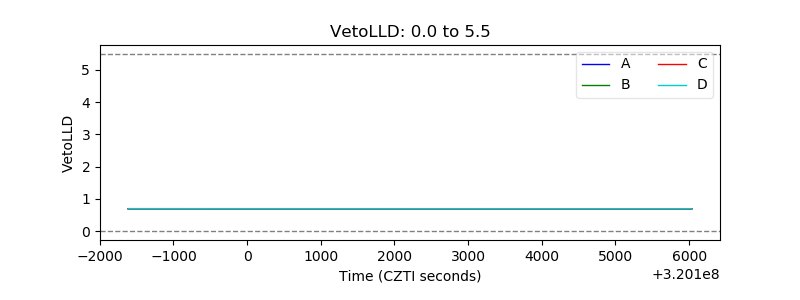 |
| Alpha Counter | 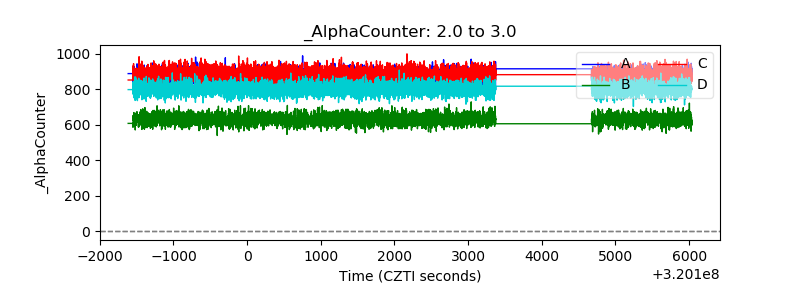 |
| _CPM_Rate | 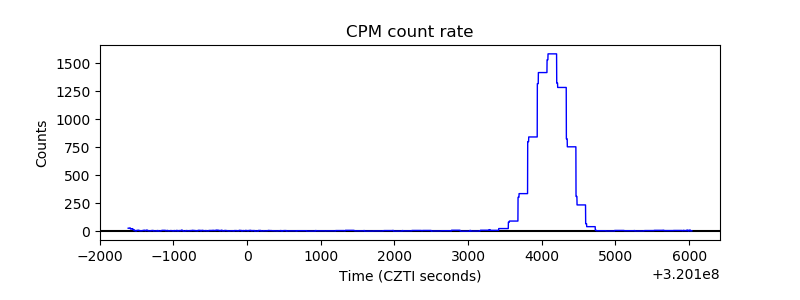 |
| CZT Counter | 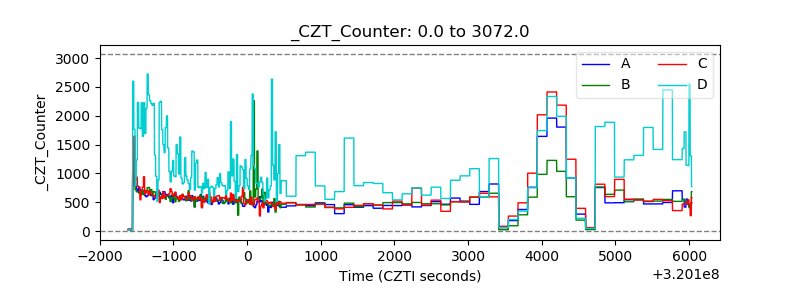 |
| +2.5 Volts monitor |  |
| +5 Volts monitor |  |
| _ROLL_ROT | 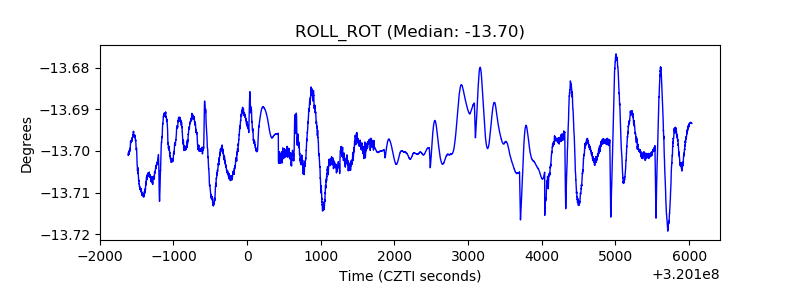 |
| _Roll_DEC | 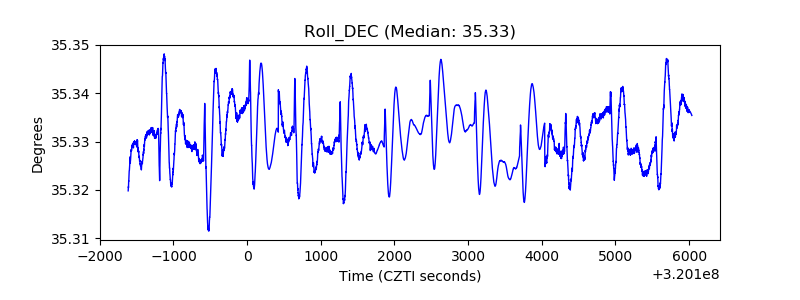 |
| _Roll_RA | 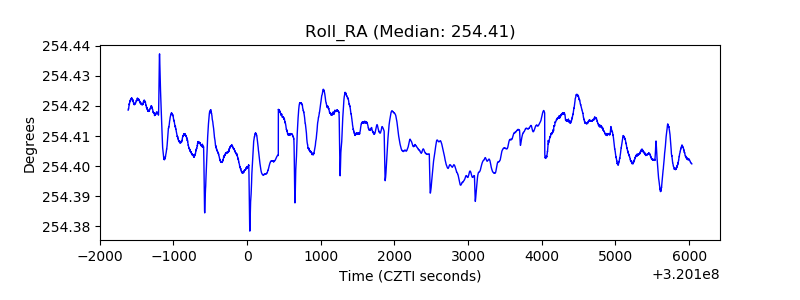 |
| Veto Counter | 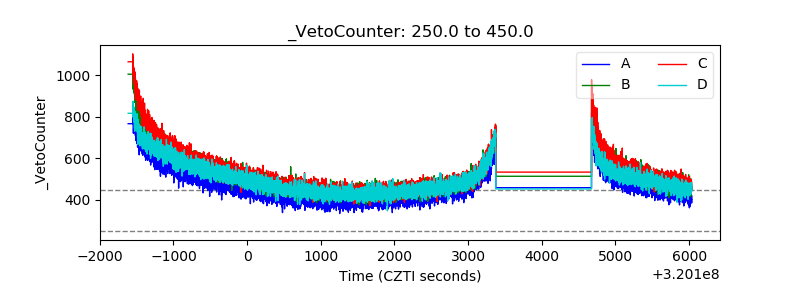 |