| Param | Original file | Final file |
|---|---|---|
| Filename | modeM0/AS1A07_113T01_9000003526_23813cztM0_level2.evt | modeM0/AS1A07_113T01_9000003526_23813cztM0_level2_quad_clean.evt |
| Size (bytes) | 657,463,680 | 100,497,600 |
| Size | 627.0 MB | 95.8 MB |
| Events in quadrant A | 3,378,550 | 657,417 |
| Events in quadrant B | 4,008,739 | 676,598 |
| Events in quadrant C | 3,536,803 | 661,595 |
| Events in quadrant D | 8,529,455 | 576,059 |
| Mode M9 | |||
|---|---|---|---|
| Quadrant | BADHDUFLAG | Total packets | Discarded packets |
| A | 0 | 23 | 0 |
| B | 0 | 23 | 0 |
| C | 0 | 23 | 0 |
| D | 0 | 23 | 0 |
| Mode SS | |||
|---|---|---|---|
| Quadrant | BADHDUFLAG | Total packets | Discarded packets |
| A | 0 | 140 | 0 |
| B | 0 | 140 | 0 |
| C | 0 | 140 | 0 |
| D | 0 | 140 | 0 |
| Mode M0 | |||
|---|---|---|---|
| Quadrant | BADHDUFLAG | Total packets | Discarded packets |
| A | 0 | 14371 | 2 |
| B | 0 | 16157 | 2 |
| C | 0 | 14692 | 2 |
| D | 0 | 30175 | 3 |
| Quadrant | Total seconds | Saturated seconds | Saturation percentage |
|---|---|---|---|
| A | 6764 | 91 | 1.345358% |
| B | 6764 | 404 | 5.972797% |
| C | 6764 | 181 | 2.675931% |
| D | 6764 | 1354 | 20.017741% |
Noise dominated data is calculated using 1-second bins in cleaned event files. If a bin has >2000 counts, and if more than 50% of those come from <1% of pixels, then it is considered to be noise-dominated and hence unusable.
| Quadrant | # 1 sec bins | Bins with >0 counts | Bins with >2000 counts | High rate bins dominated by noise | Noise dominated (total time) | Noise dominated (detector-on time) | Marked lightcurve |
|---|---|---|---|---|---|---|---|
| A | 9049 | 6765 | 0 | 0 | 0.00% | 0.00% | 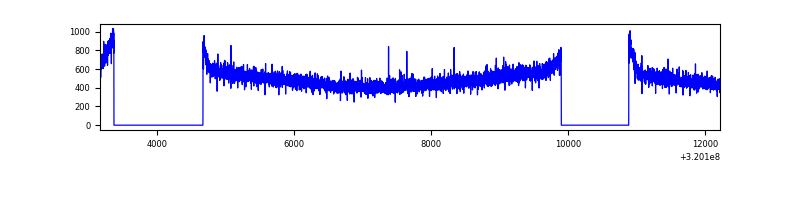 |
| B | 9049 | 6764 | 164 | 164 | 1.81% | 2.42% | 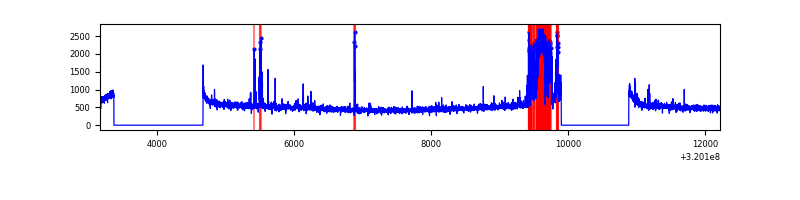 |
| C | 9049 | 6764 | 2 | 2 | 0.02% | 0.03% | 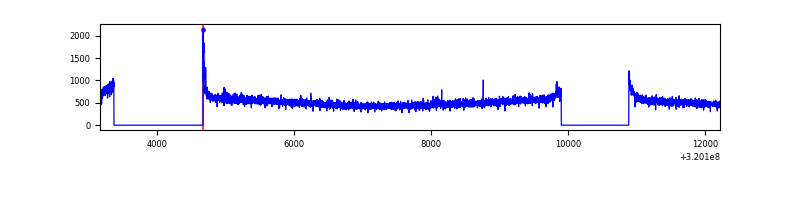 |
| D | 9049 | 6765 | 1028 | 1028 | 11.36% | 15.20% | 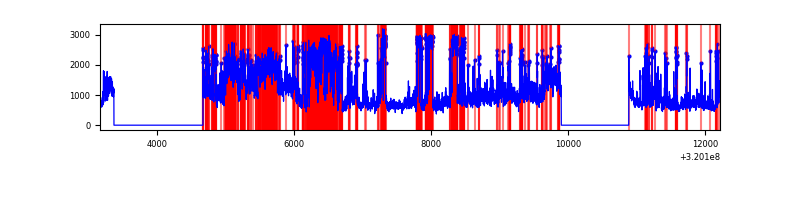 |
Top three noisy pixels from each quadrant. If the there are fewer than three noisy pixels in the level2.evt file, extra rows are filled as -1
| Pixel properties | Quadrant properties | ||||||
|---|---|---|---|---|---|---|---|
| Quadrant | DetID | PixID | Counts | Sigma | Mean | Median | Sigma |
| A | 13 | 254 | 11827 | 62.04 | 876 | 856 | 176.8 |
| A | 3 | 137 | 7731 | 38.88 | 876 | 856 | 176.8 |
| A | 0 | 226 | 7481 | 37.47 | 876 | 856 | 176.8 |
| B | 3 | 64 | 590239 | 3583.11 | 864 | 845 | 164.5 |
| B | 12 | 111 | 19769 | 115.04 | 864 | 845 | 164.5 |
| B | 11 | 111 | 17610 | 101.92 | 864 | 845 | 164.5 |
| C | 14 | 238 | 136826 | 681.2 | 858 | 866 | 199.6 |
| C | 0 | 10 | 19776 | 94.74 | 858 | 866 | 199.6 |
| C | 8 | 128 | 14068 | 66.15 | 858 | 866 | 199.6 |
| D | 1 | 52 | 2228481 | 11345.83 | 808 | 785 | 196.3 |
| D | 8 | 195 | 1901203 | 9678.97 | 808 | 785 | 196.3 |
| D | 13 | 174 | 1133295 | 5767.96 | 808 | 785 | 196.3 |
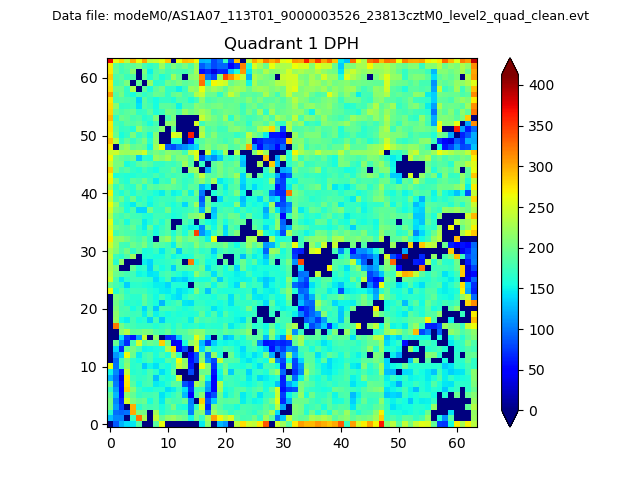
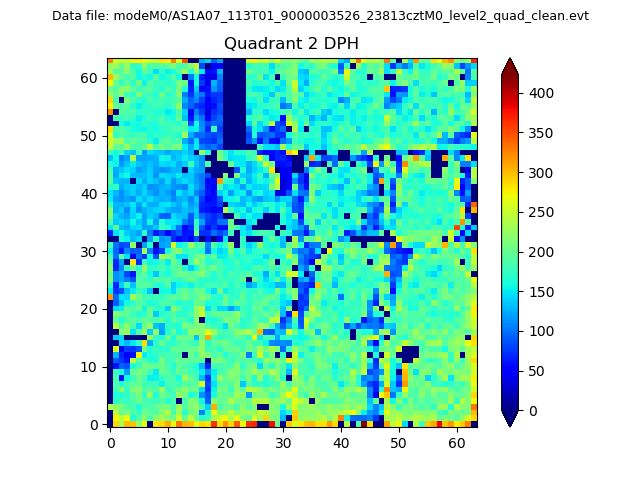
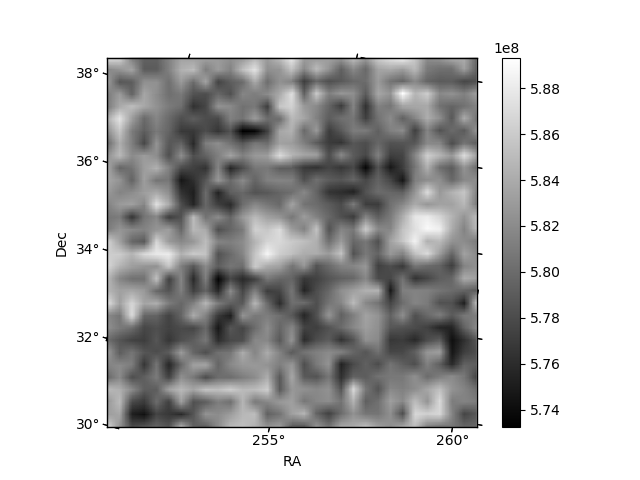
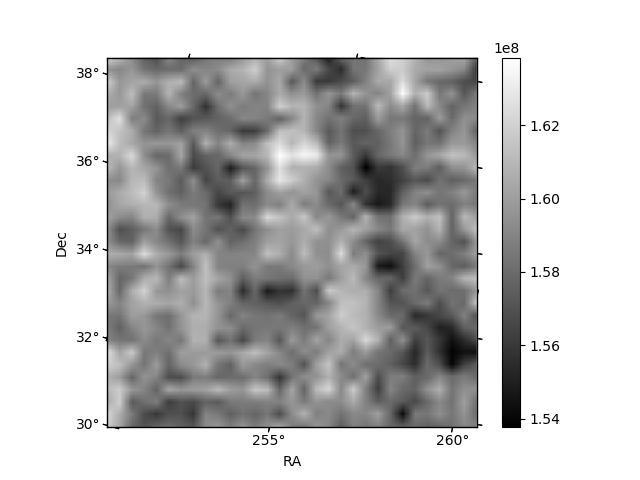
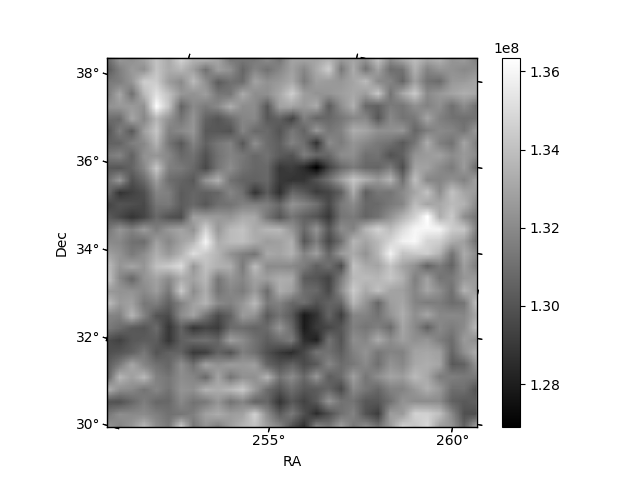
Histogram calculated using DETX and DETY for each event in the final _common_clean file
| Quadrant A |  |
 |
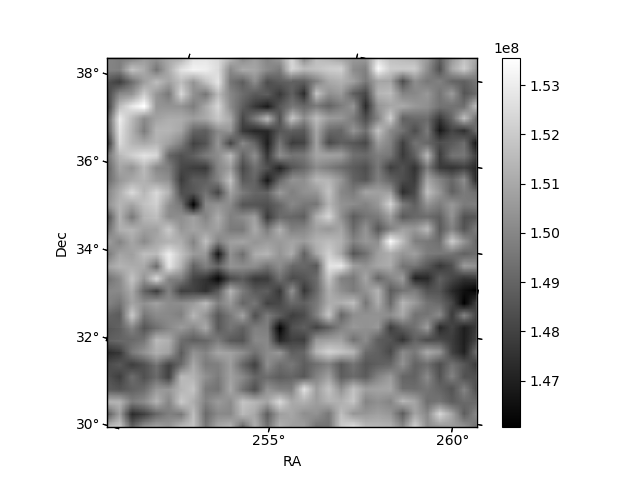
Quadrant B |
|---|---|---|---|
| Quadrant D | 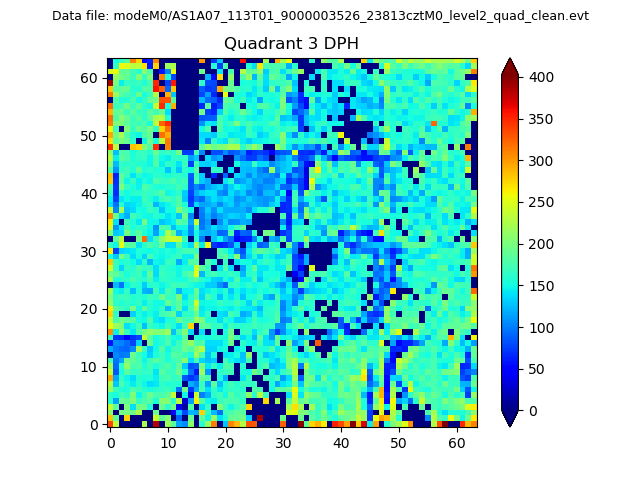 |
 |
Quadrant C |
| Plot type | Count rate plots | Images |
|---|---|---|
| Comparison with Poisson distribution Blue bars denote a histogram of data divided into 1 sec bins. Red curve is a Poisson curve with rate = median count rate of data. |
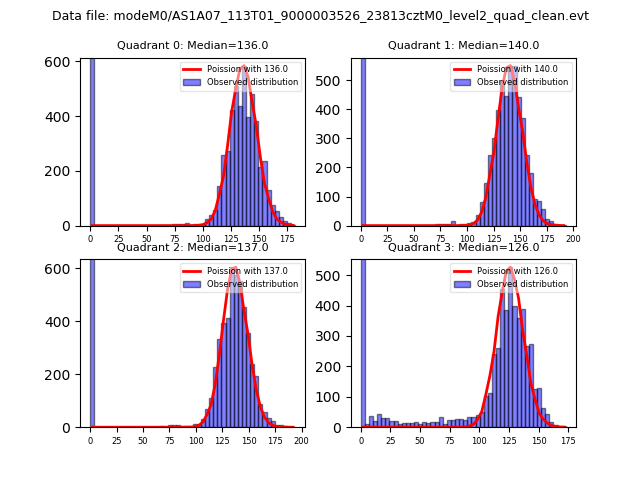 |
 |
| Quadrant-wise count rates Data is divided into 100 sec bins |
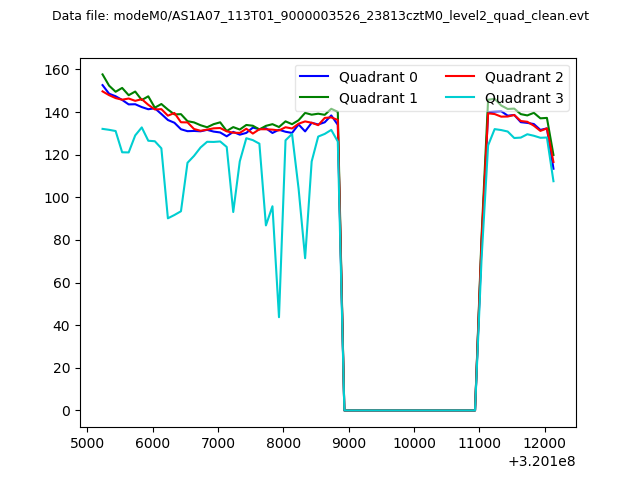 |
|
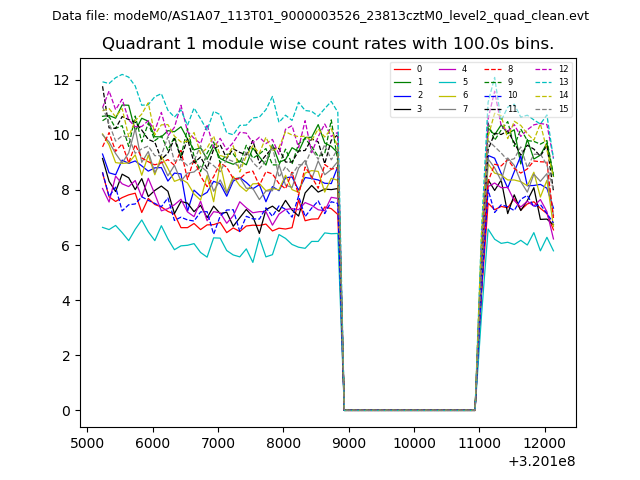
| Module-wise count rates for Quadrant A Data is divided into 100 sec bins |
 |
 |
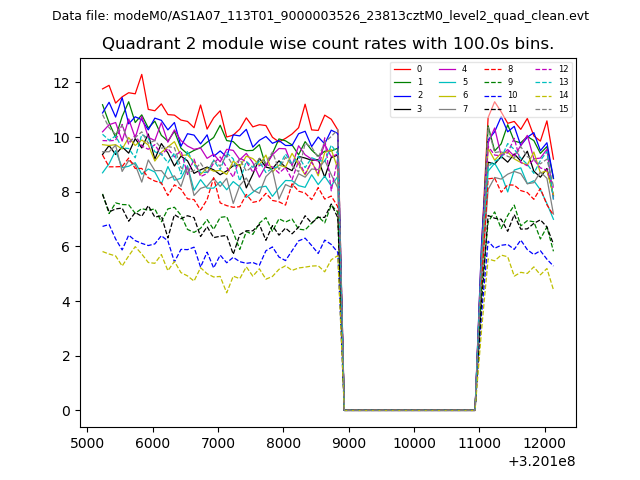
| Module-wise count rates for Quadrant B Data is divided into 100 sec bins |
 |
 |
| Module-wise count rates for Quadrant C Data is divided into 100 sec bins |
 |
 |
| Module-wise count rates for Quadrant D Data is divided into 100 sec bins |
 |
 |
| Parameter | Plot |
|---|---|
| CZT HV Monitor | 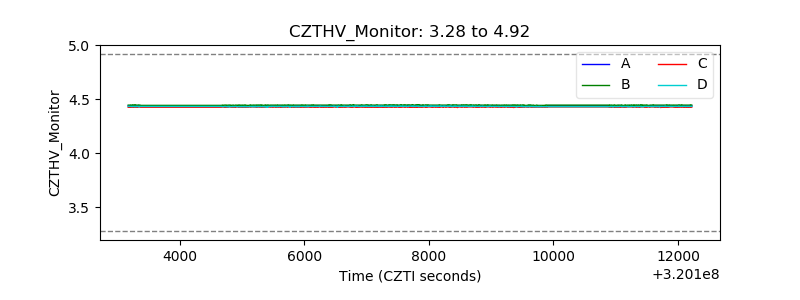 |
| D_VDD | 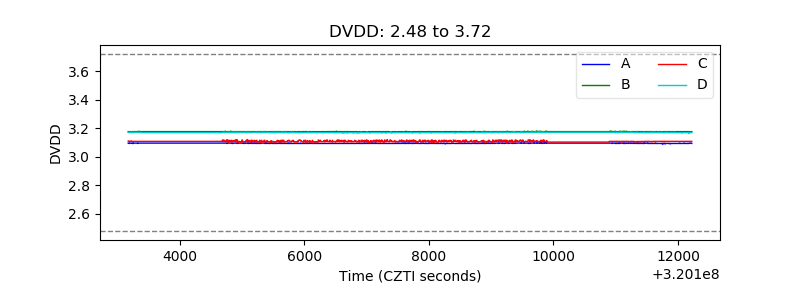 |
| Temperature 1 |  |
| Veto HV Monitor | 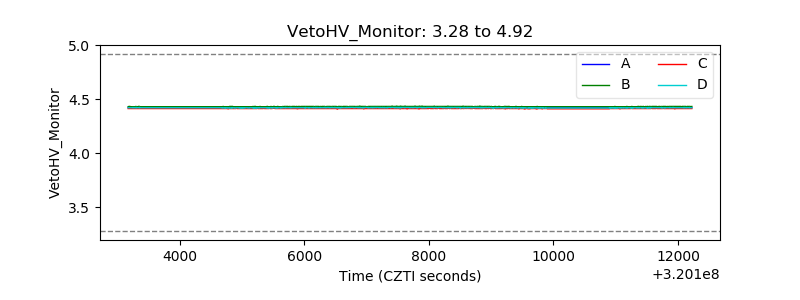 |
| Veto LLD |  |
| Alpha Counter | 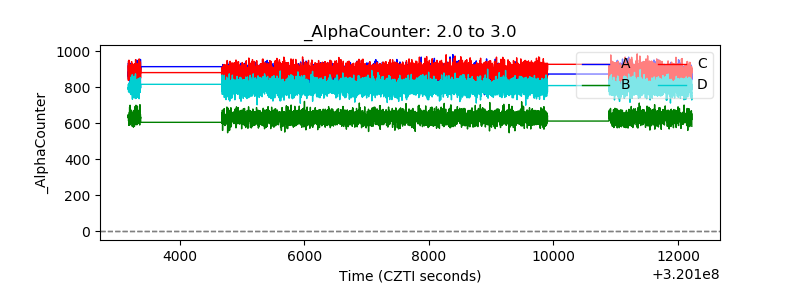 |
| _CPM_Rate | 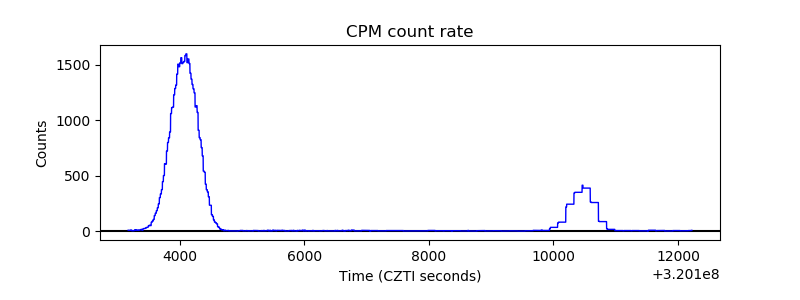 |
| CZT Counter | 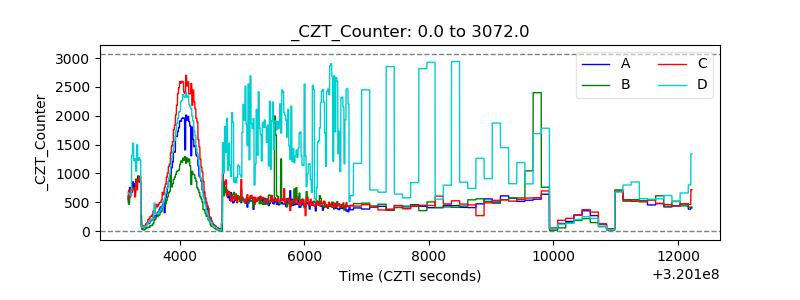 |
| +2.5 Volts monitor |  |
| +5 Volts monitor |  |
| _ROLL_ROT |  |
| _Roll_DEC | 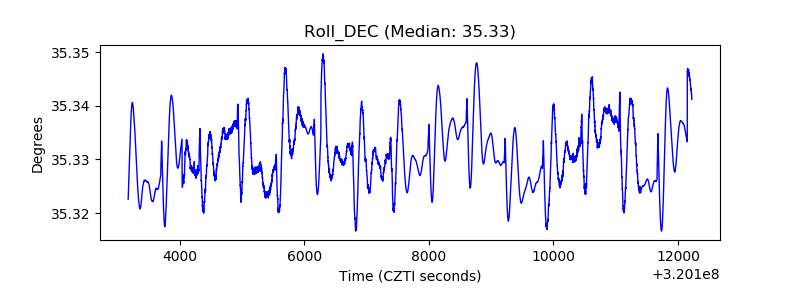 |
| _Roll_RA | 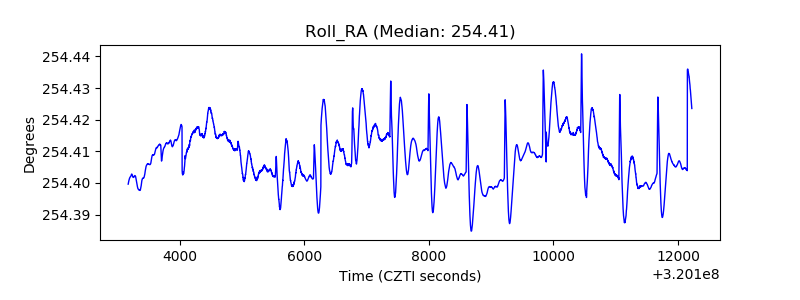 |
| Veto Counter |  |