| Param | Original file | Final file |
|---|---|---|
| Filename | modeM0/AS1A07_113T01_9000003526_23814cztM0_level2.evt | modeM0/AS1A07_113T01_9000003526_23814cztM0_level2_quad_clean.evt |
| Size (bytes) | 625,003,200 | 102,571,200 |
| Size | 596.0 MB | 97.8 MB |
| Events in quadrant A | 3,375,286 | 662,731 |
| Events in quadrant B | 3,515,532 | 686,287 |
| Events in quadrant C | 3,481,985 | 668,462 |
| Events in quadrant D | 8,076,194 | 595,663 |
| Mode M9 | |||
|---|---|---|---|
| Quadrant | BADHDUFLAG | Total packets | Discarded packets |
| A | 0 | 16 | 0 |
| B | 0 | 16 | 0 |
| C | 0 | 16 | 0 |
| D | 0 | 16 | 0 |
| Mode SS | |||
|---|---|---|---|
| Quadrant | BADHDUFLAG | Total packets | Discarded packets |
| A | 0 | 146 | 0 |
| B | 0 | 146 | 0 |
| C | 0 | 146 | 0 |
| D | 0 | 146 | 0 |
| Mode M0 | |||
|---|---|---|---|
| Quadrant | BADHDUFLAG | Total packets | Discarded packets |
| A | 0 | 14696 | 2 |
| B | 0 | 15008 | 2 |
| C | 0 | 14818 | 2 |
| D | 0 | 29032 | 2 |
| Quadrant | Total seconds | Saturated seconds | Saturation percentage |
|---|---|---|---|
| A | 7078 | 38 | 0.536875% |
| B | 7079 | 89 | 1.257240% |
| C | 7079 | 109 | 1.539766% |
| D | 7079 | 970 | 13.702500% |
Noise dominated data is calculated using 1-second bins in cleaned event files. If a bin has >2000 counts, and if more than 50% of those come from <1% of pixels, then it is considered to be noise-dominated and hence unusable.
| Quadrant | # 1 sec bins | Bins with >0 counts | Bins with >2000 counts | High rate bins dominated by noise | Noise dominated (total time) | Noise dominated (detector-on time) | Marked lightcurve |
|---|---|---|---|---|---|---|---|
| A | 8693 | 7080 | 0 | 0 | 0.00% | 0.00% | 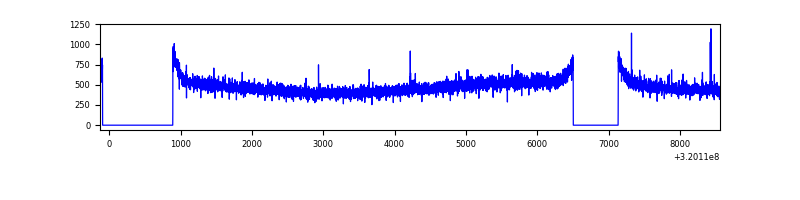 |
| B | 8694 | 7079 | 1 | 1 | 0.01% | 0.01% | 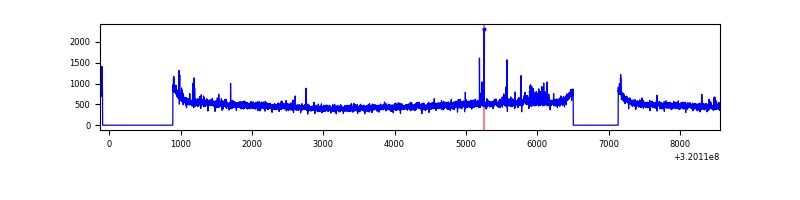 |
| C | 8694 | 7080 | 0 | 0 | 0.00% | 0.00% | 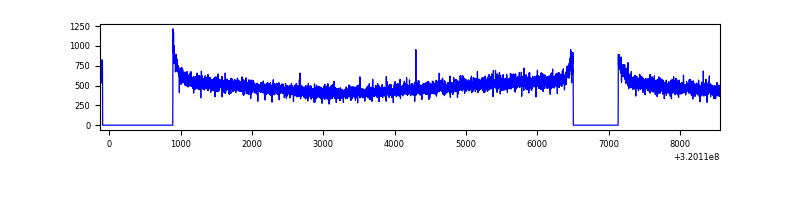 |
| D | 8694 | 7079 | 742 | 742 | 8.53% | 10.48% | 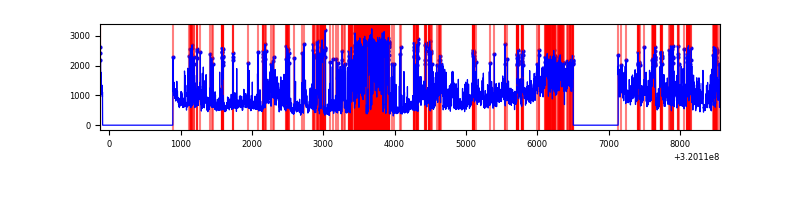 |
Top three noisy pixels from each quadrant. If the there are fewer than three noisy pixels in the level2.evt file, extra rows are filled as -1
| Pixel properties | Quadrant properties | ||||||
|---|---|---|---|---|---|---|---|
| Quadrant | DetID | PixID | Counts | Sigma | Mean | Median | Sigma |
| A | 13 | 254 | 11257 | 59.04 | 872 | 855 | 176.2 |
| A | 3 | 137 | 7859 | 39.75 | 872 | 855 | 176.2 |
| A | 0 | 226 | 7401 | 37.15 | 872 | 855 | 176.2 |
| B | 15 | 33 | 40513 | 233.78 | 879 | 856 | 169.6 |
| B | 3 | 64 | 22943 | 130.21 | 879 | 856 | 169.6 |
| B | 12 | 111 | 20459 | 115.56 | 879 | 856 | 169.6 |
| C | 14 | 238 | 135596 | 670.12 | 854 | 859 | 201.1 |
| C | 2 | 16 | 9509 | 43.02 | 854 | 859 | 201.1 |
| C | 7 | 247 | 6498 | 28.04 | 854 | 859 | 201.1 |
| D | 1 | 52 | 2604927 | 13097.17 | 812 | 789 | 198.8 |
| D | 8 | 195 | 2090392 | 10509.38 | 812 | 789 | 198.8 |
| D | 13 | 174 | 177741 | 889.96 | 812 | 789 | 198.8 |
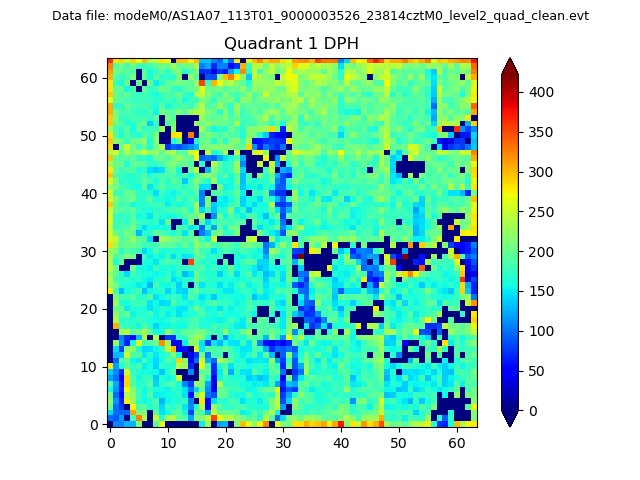
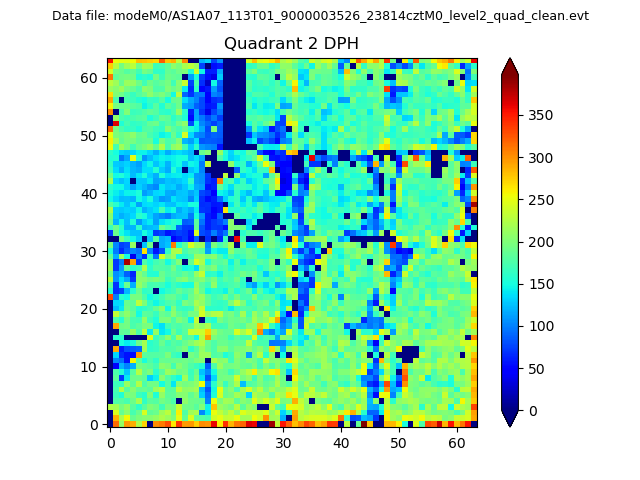
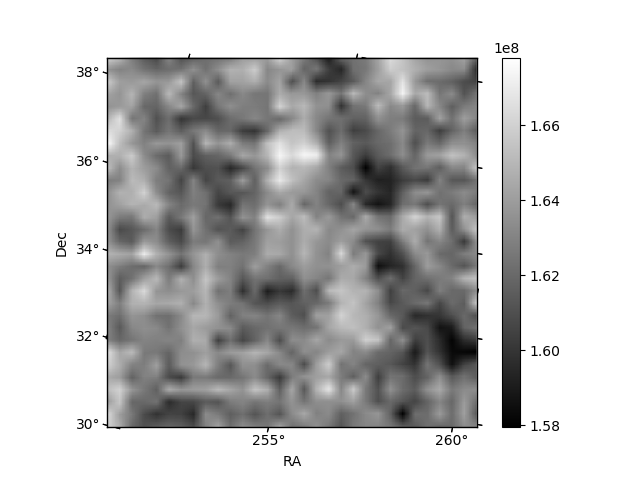
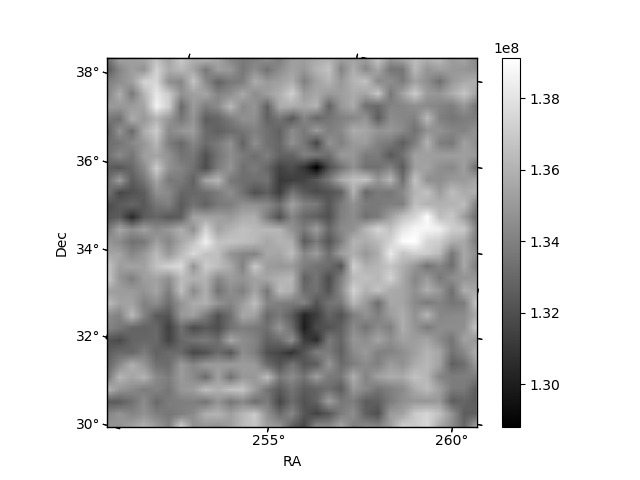
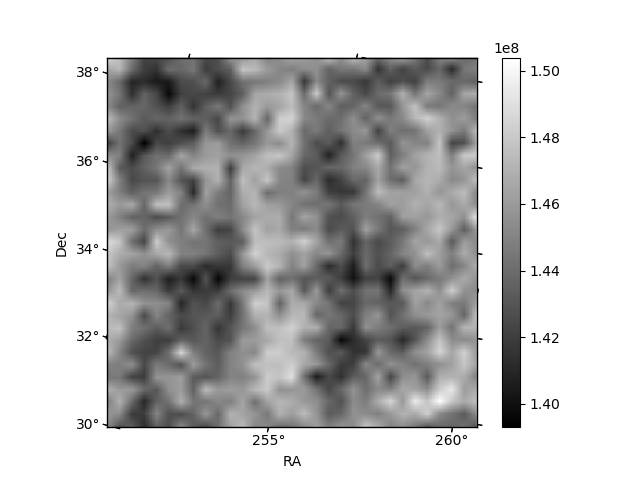
Histogram calculated using DETX and DETY for each event in the final _common_clean file
| Quadrant A |  |
 |
Quadrant B |
|---|---|---|---|
| Quadrant D | 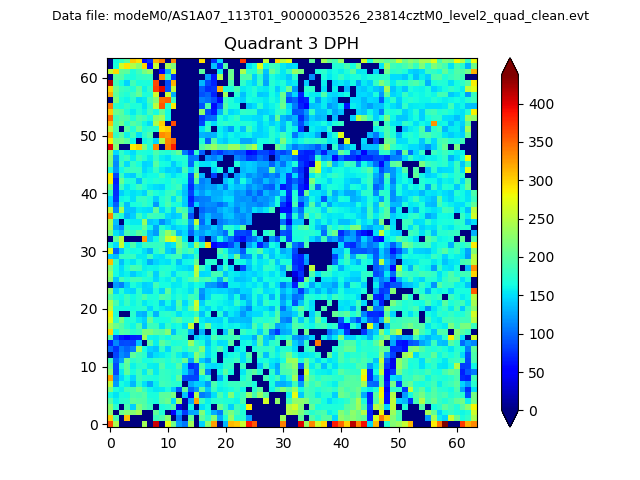 |
 |
Quadrant C |
| Plot type | Count rate plots | Images |
|---|---|---|
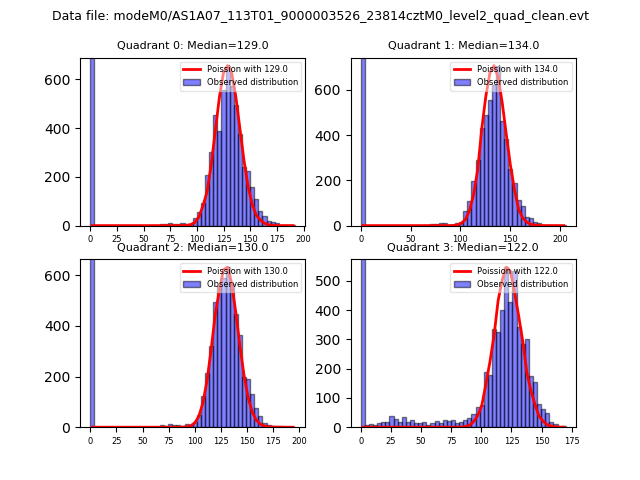
| Comparison with Poisson distribution Blue bars denote a histogram of data divided into 1 sec bins. Red curve is a Poisson curve with rate = median count rate of data. |
 |
 |
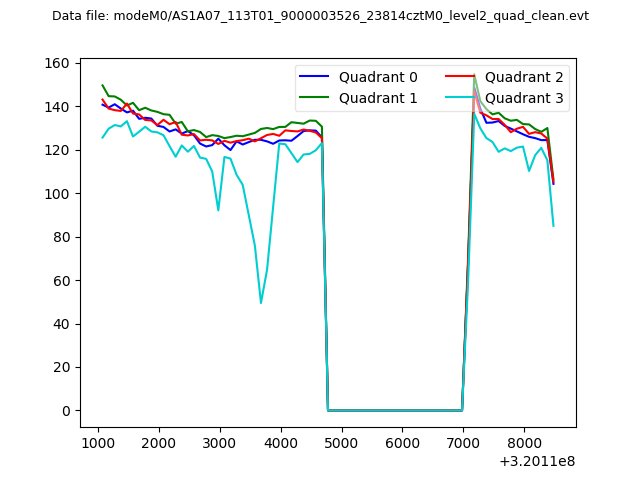
| Quadrant-wise count rates Data is divided into 100 sec bins |
 |
|
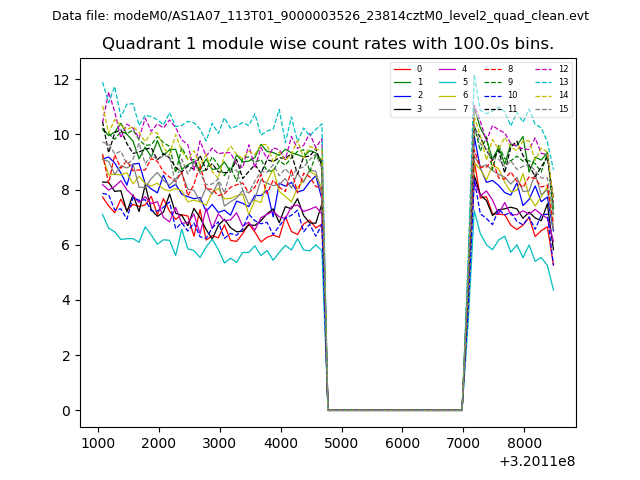
| Module-wise count rates for Quadrant A Data is divided into 100 sec bins |
 |
 |
| Module-wise count rates for Quadrant B Data is divided into 100 sec bins |
 |
 |
| Module-wise count rates for Quadrant C Data is divided into 100 sec bins |
 |
 |
| Module-wise count rates for Quadrant D Data is divided into 100 sec bins |
 |
 |
| Parameter | Plot |
|---|---|
| CZT HV Monitor | 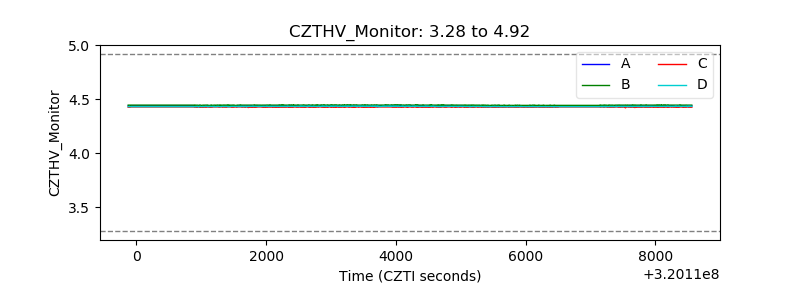 |
| D_VDD | 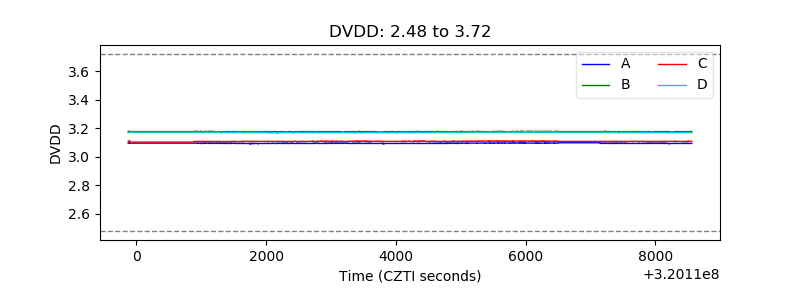 |
| Temperature 1 | 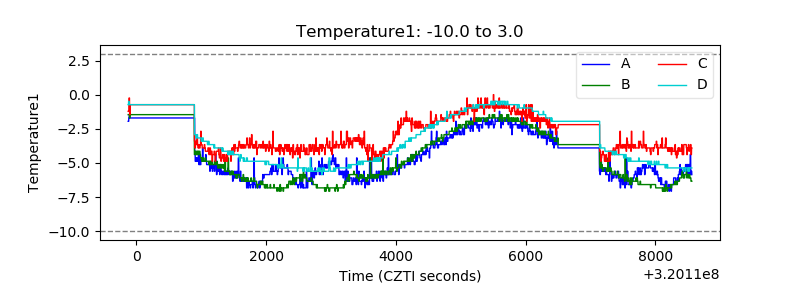 |
| Veto HV Monitor | 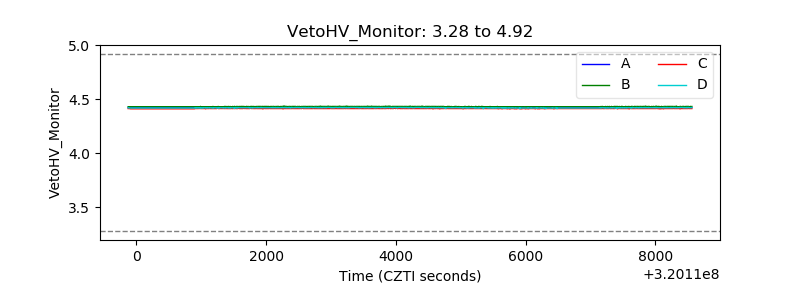 |
| Veto LLD | 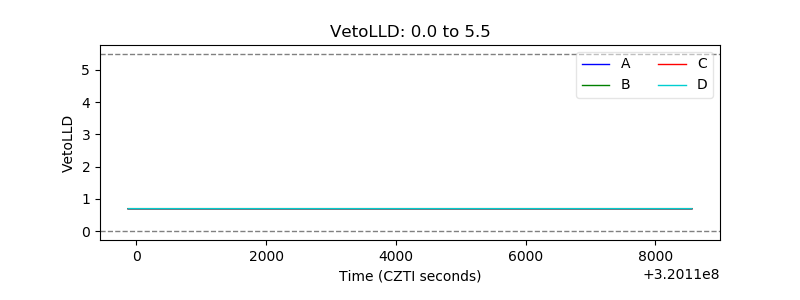 |
| Alpha Counter | 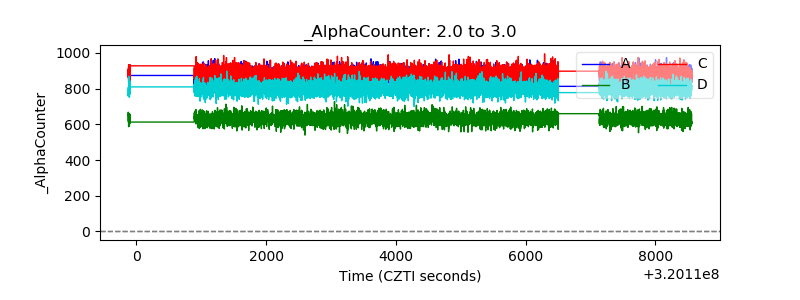 |
| _CPM_Rate | 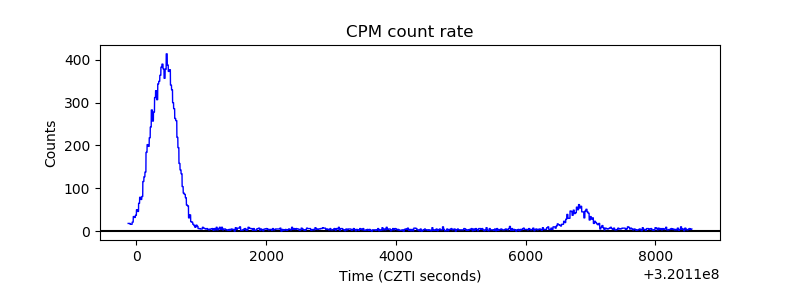 |
| CZT Counter | 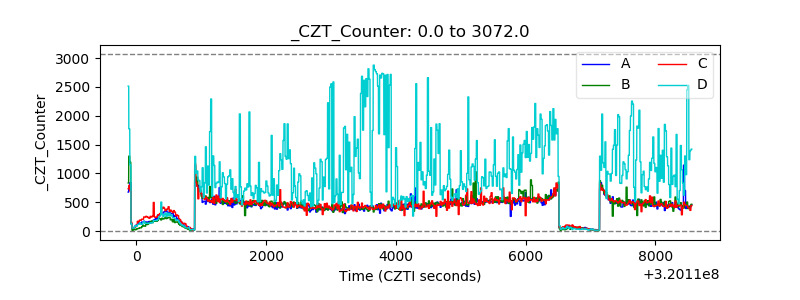 |
| +2.5 Volts monitor |  |
| +5 Volts monitor |  |
| _ROLL_ROT | 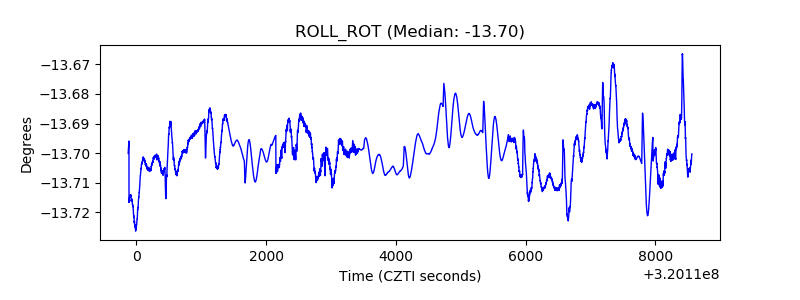 |
| _Roll_DEC | 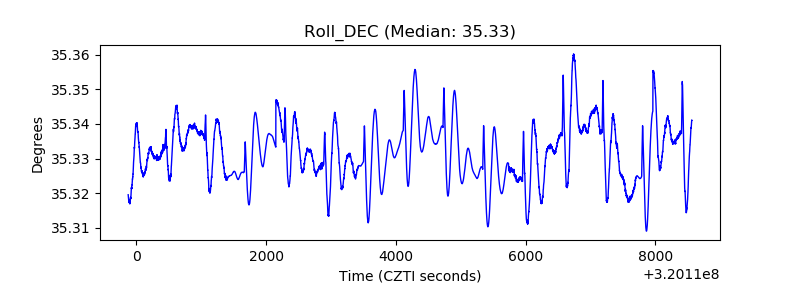 |
| _Roll_RA |  |
| Veto Counter | 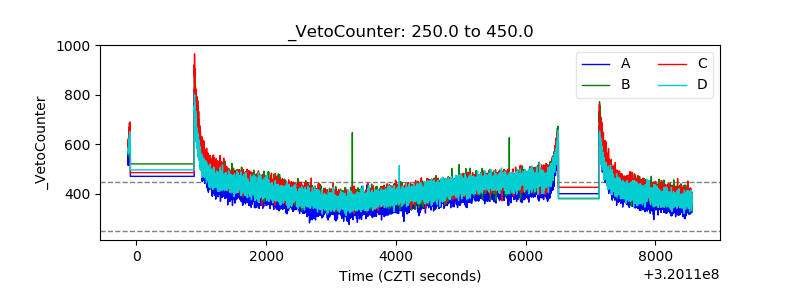 |