| Param | Original file | Final file |
|---|---|---|
| Filename | modeM0/AS1A07_113T01_9000003526_23819cztM0_level2.evt | modeM0/AS1A07_113T01_9000003526_23819cztM0_level2_quad_clean.evt |
| Size (bytes) | 1,993,213,440 | 233,812,800 |
| Size | 1.9 GB | 223.0 MB |
| Events in quadrant A | 8,641,796 | 1,522,569 |
| Events in quadrant B | 9,910,875 | 1,560,366 |
| Events in quadrant C | 8,879,187 | 1,512,963 |
| Events in quadrant D | 31,685,859 | 1,206,867 |
| Mode M9 | |||
|---|---|---|---|
| Quadrant | BADHDUFLAG | Total packets | Discarded packets |
| A | 0 | 19 | 0 |
| B | 0 | 19 | 0 |
| C | 0 | 19 | 0 |
| D | 0 | 19 | 0 |
| Mode SS | |||
|---|---|---|---|
| Quadrant | BADHDUFLAG | Total packets | Discarded packets |
| A | 0 | 372 | 0 |
| B | 0 | 372 | 0 |
| C | 0 | 372 | 0 |
| D | 0 | 374 | 0 |
| Mode M0 | |||
|---|---|---|---|
| Quadrant | BADHDUFLAG | Total packets | Discarded packets |
| A | 0 | 37653 | 3 |
| B | 0 | 41036 | 3 |
| C | 0 | 38052 | 3 |
| D | 0 | 107010 | 10 |
| Quadrant | Total seconds | Saturated seconds | Saturation percentage |
|---|---|---|---|
| A | 18538 | 162 | 0.873881% |
| B | 18538 | 374 | 2.017478% |
| C | 18538 | 256 | 1.380947% |
| D | 18537 | 7877 | 42.493392% |
Noise dominated data is calculated using 1-second bins in cleaned event files. If a bin has >2000 counts, and if more than 50% of those come from <1% of pixels, then it is considered to be noise-dominated and hence unusable.
| Quadrant | # 1 sec bins | Bins with >0 counts | Bins with >2000 counts | High rate bins dominated by noise | Noise dominated (total time) | Noise dominated (detector-on time) | Marked lightcurve |
|---|---|---|---|---|---|---|---|
| A | 20298 | 18538 | 0 | 0 | 0.00% | 0.00% | 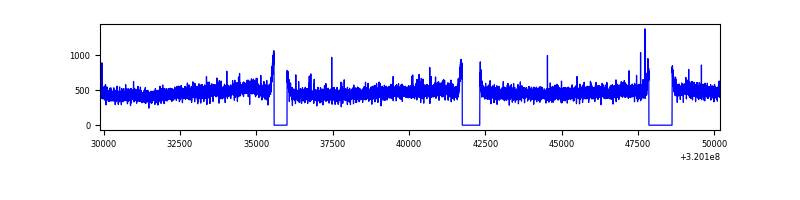 |
| B | 20298 | 18538 | 152 | 152 | 0.75% | 0.82% | 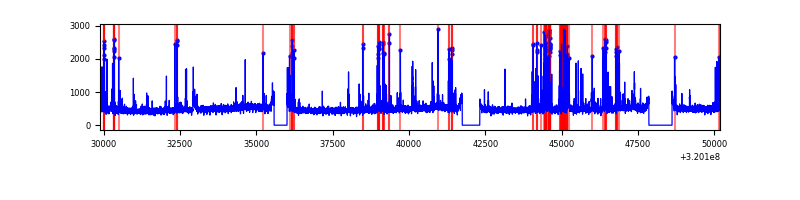 |
| C | 20298 | 18538 | 13 | 13 | 0.06% | 0.07% | 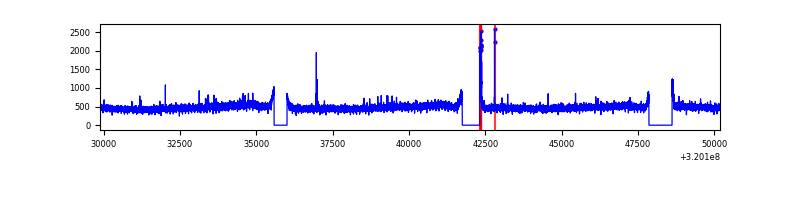 |
| D | 20296 | 18536 | 7100 | 7100 | 34.98% | 38.30% | 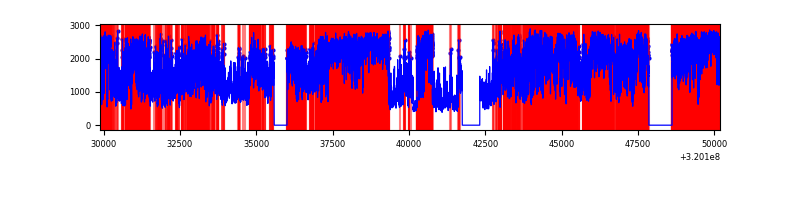 |
Top three noisy pixels from each quadrant. If the there are fewer than three noisy pixels in the level2.evt file, extra rows are filled as -1
| Pixel properties | Quadrant properties | ||||||
|---|---|---|---|---|---|---|---|
| Quadrant | DetID | PixID | Counts | Sigma | Mean | Median | Sigma |
| A | 13 | 254 | 29439 | 60.35 | 2238 | 2187 | 451.6 |
| A | 3 | 137 | 20140 | 39.76 | 2238 | 2187 | 451.6 |
| A | 0 | 226 | 19311 | 37.92 | 2238 | 2187 | 451.6 |
| B | 3 | 64 | 1099732 | 2574.29 | 2226 | 2173 | 426.4 |
| B | 12 | 111 | 52157 | 117.24 | 2226 | 2173 | 426.4 |
| B | 11 | 111 | 46040 | 102.89 | 2226 | 2173 | 426.4 |
| C | 14 | 238 | 341924 | 670.43 | 2158 | 2173 | 506.8 |
| C | 0 | 10 | 74064 | 141.86 | 2158 | 2173 | 506.8 |
| C | 7 | 247 | 49465 | 93.32 | 2158 | 2173 | 506.8 |
| D | 13 | 174 | 17761101 | 39547.61 | 1835 | 1781 | 449.1 |
| D | 8 | 195 | 5718864 | 12731.17 | 1835 | 1781 | 449.1 |
| D | 1 | 52 | 1169355 | 2600.03 | 1835 | 1781 | 449.1 |
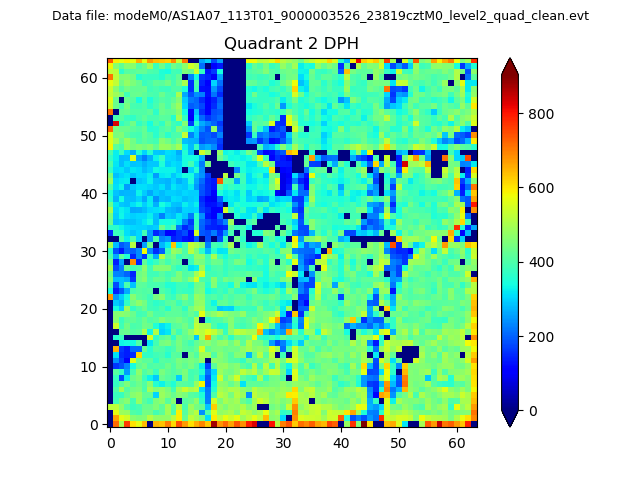
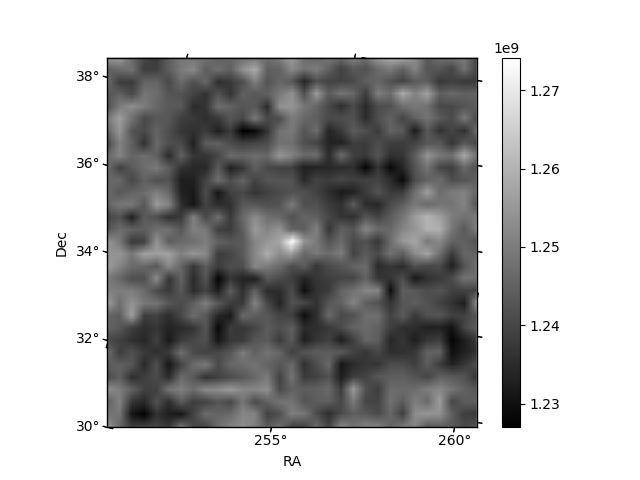
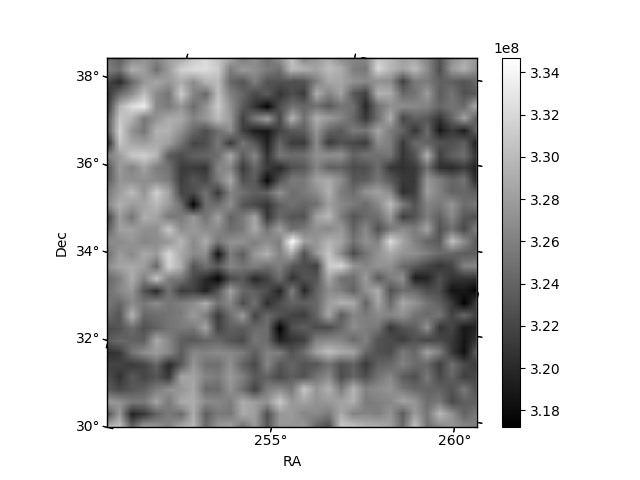
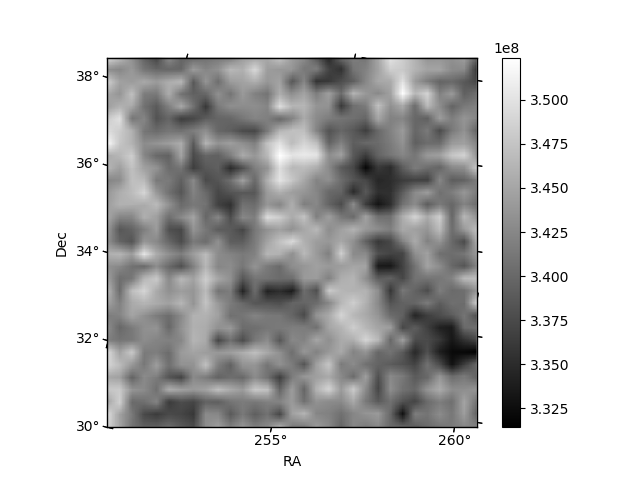
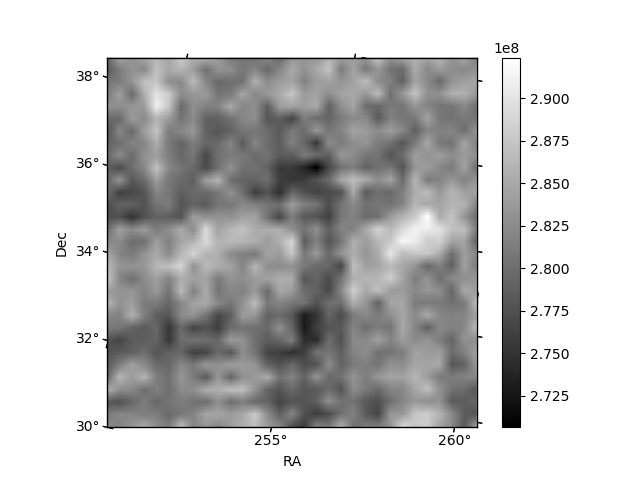
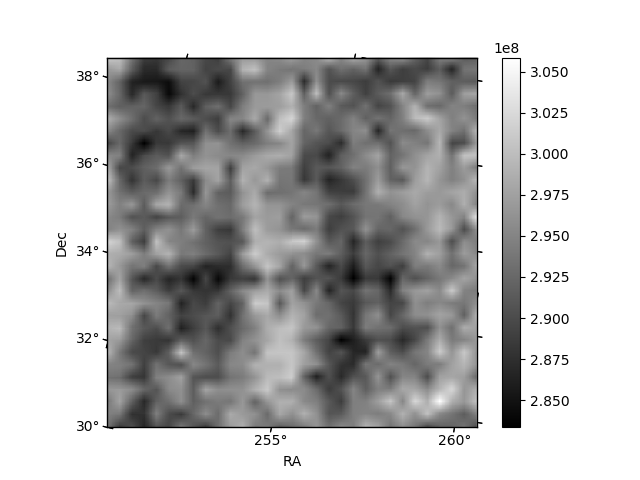
Histogram calculated using DETX and DETY for each event in the final _common_clean file
| Quadrant A | 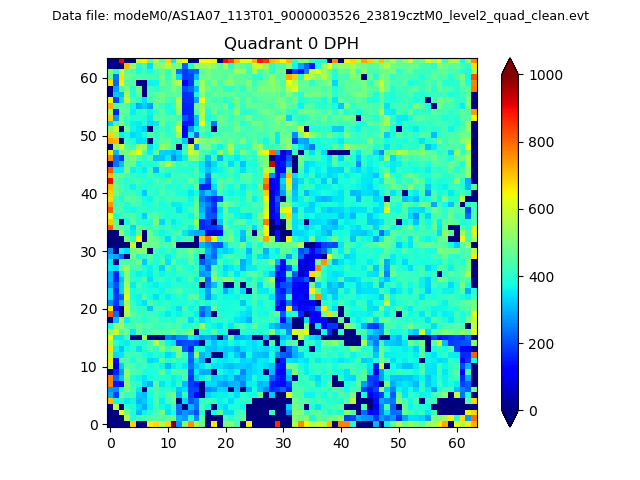 |
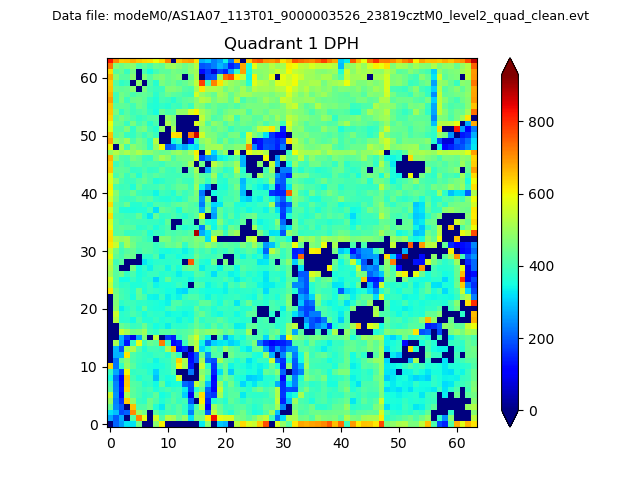 |
Quadrant B |
|---|---|---|---|
| Quadrant D | 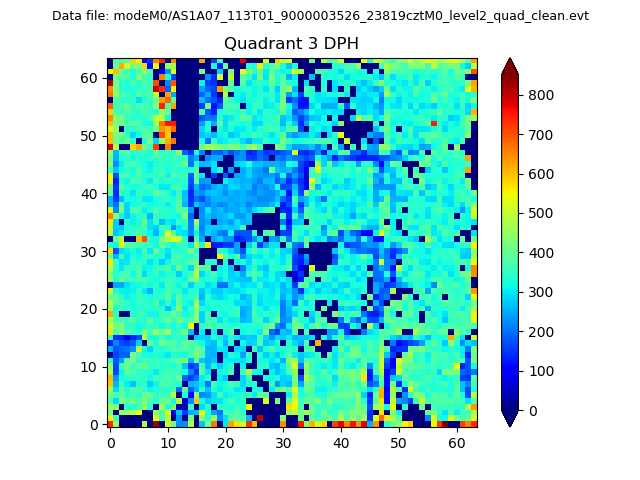 |
 |
Quadrant C |
| Plot type | Count rate plots | Images |
|---|---|---|
| Comparison with Poisson distribution Blue bars denote a histogram of data divided into 1 sec bins. Red curve is a Poisson curve with rate = median count rate of data. |
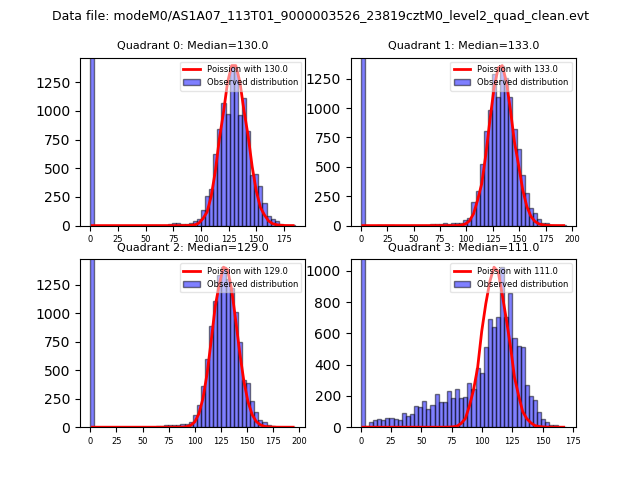 |
 |
| Quadrant-wise count rates Data is divided into 100 sec bins |
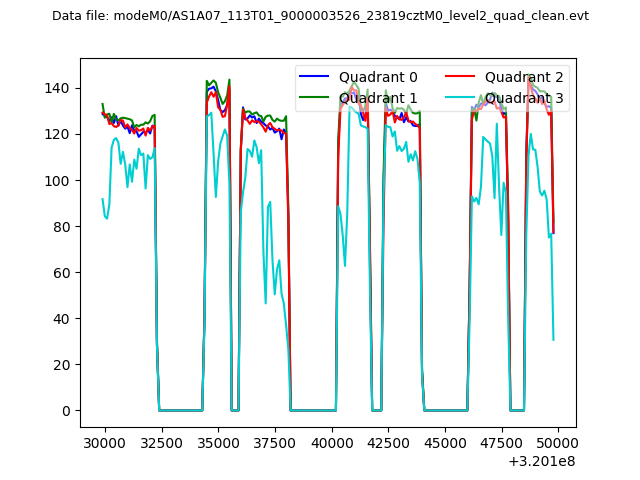 |
|
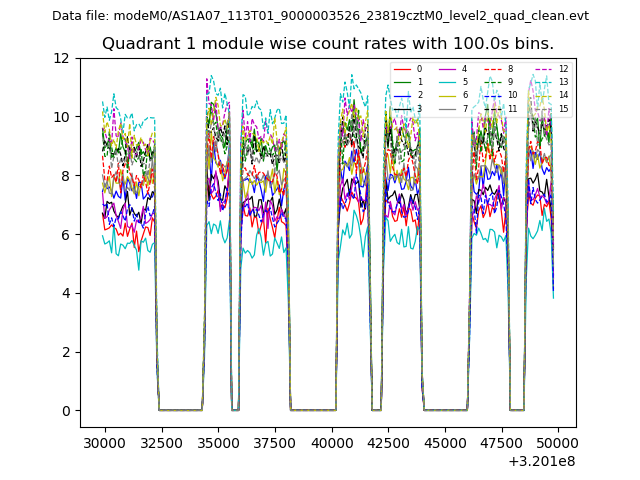
| Module-wise count rates for Quadrant A Data is divided into 100 sec bins |
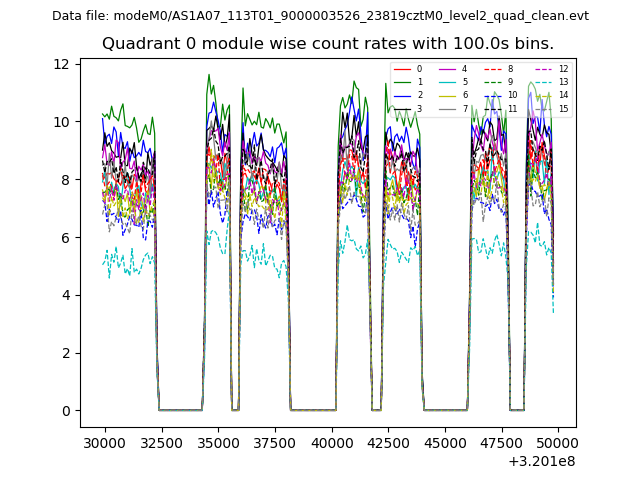 |
 |
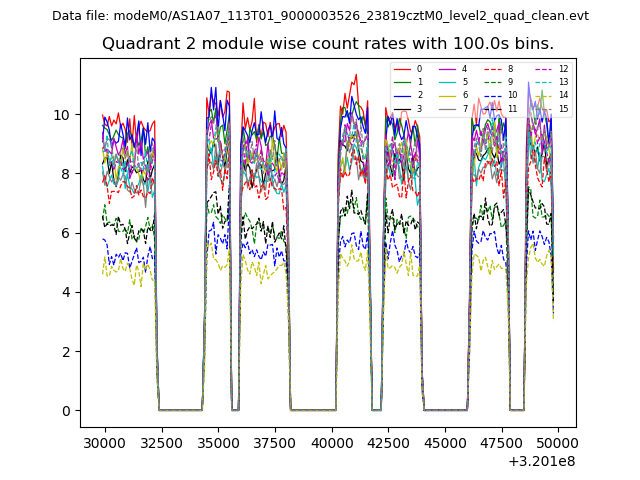
| Module-wise count rates for Quadrant B Data is divided into 100 sec bins |
 |
 |
| Module-wise count rates for Quadrant C Data is divided into 100 sec bins |
 |
 |
| Module-wise count rates for Quadrant D Data is divided into 100 sec bins |
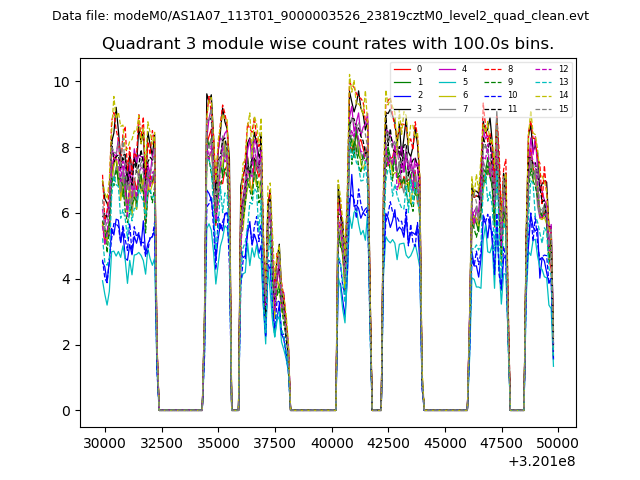 |
 |
| Parameter | Plot |
|---|---|
| CZT HV Monitor | 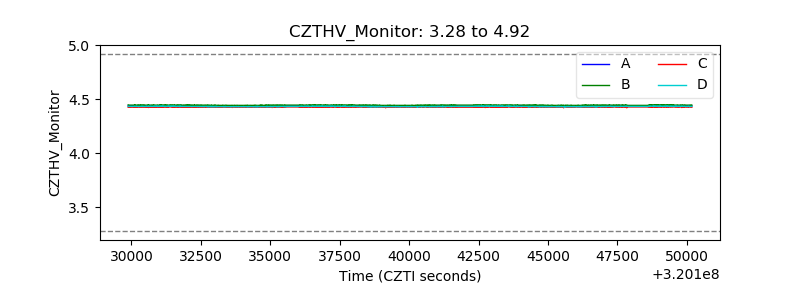 |
| D_VDD | 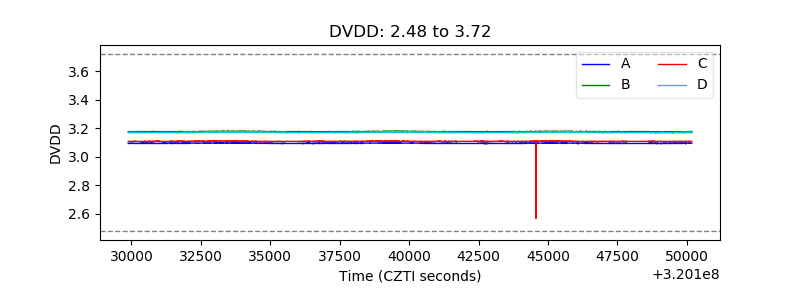 |
| Temperature 1 | 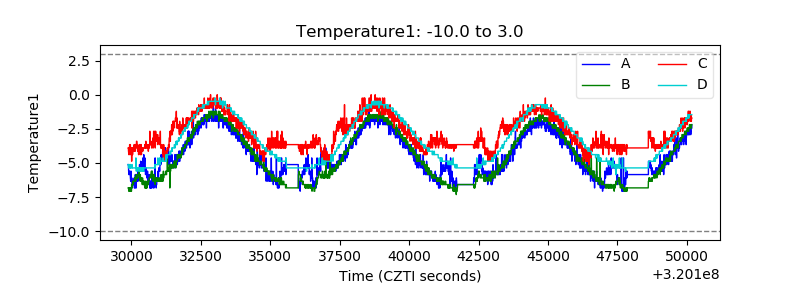 |
| Veto HV Monitor | 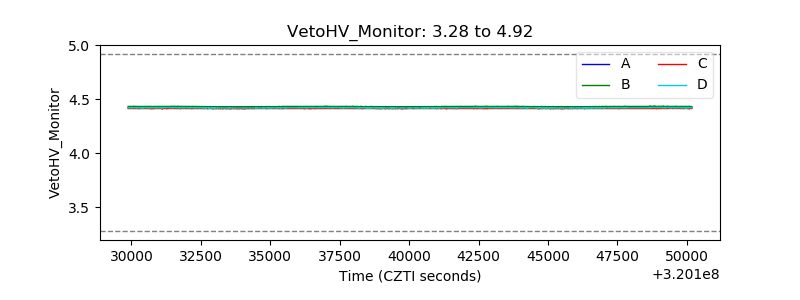 |
| Veto LLD | 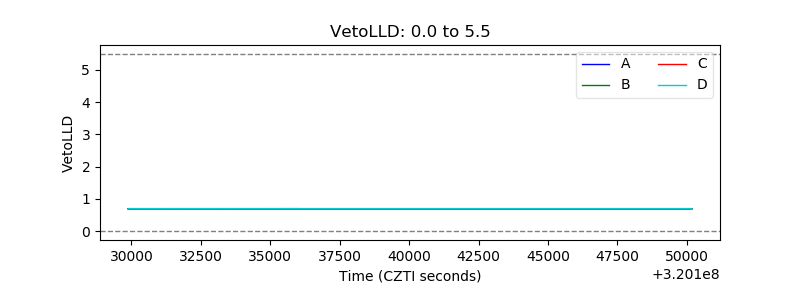 |
| Alpha Counter |  |
| _CPM_Rate | 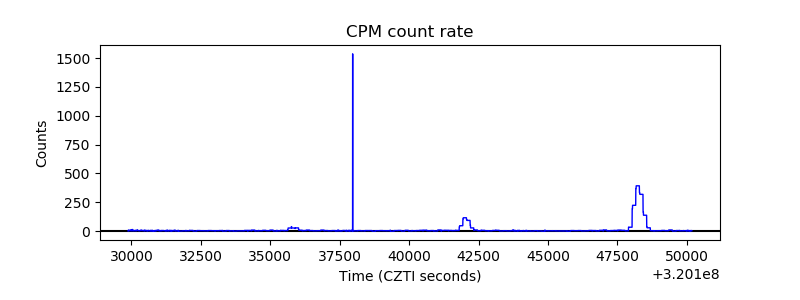 |
| CZT Counter | 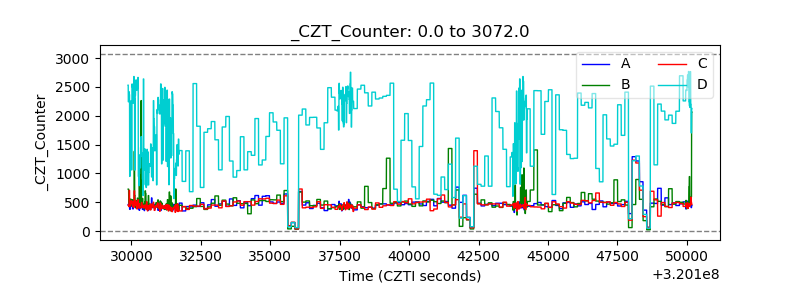 |
| +2.5 Volts monitor |  |
| +5 Volts monitor |  |
| _ROLL_ROT | 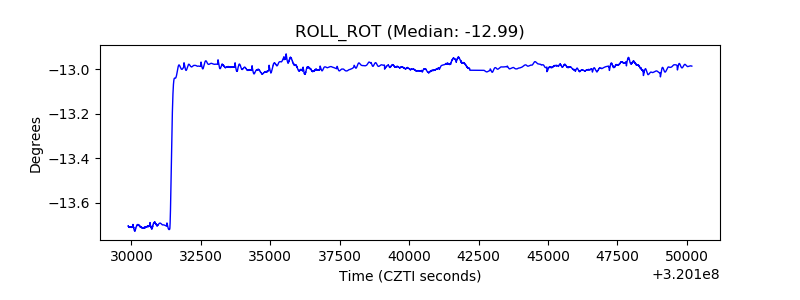 |
| _Roll_DEC | 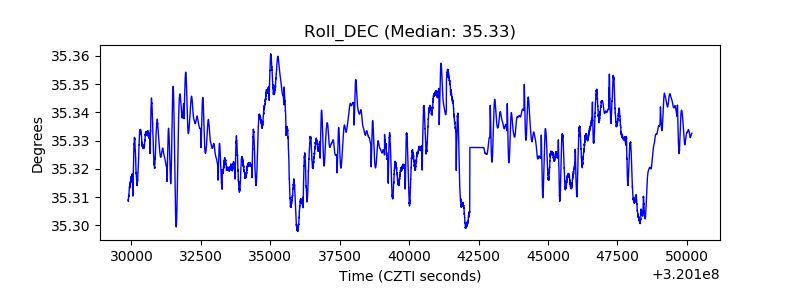 |
| _Roll_RA | 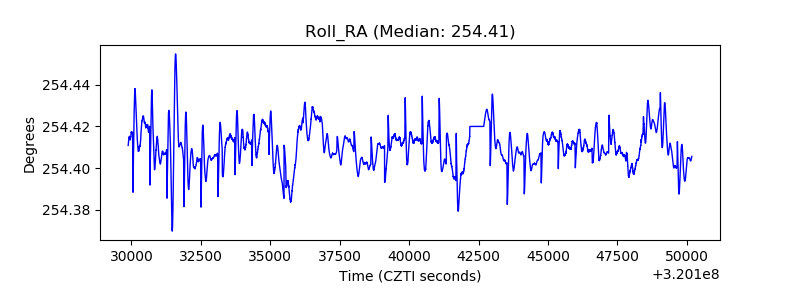 |
| Veto Counter | 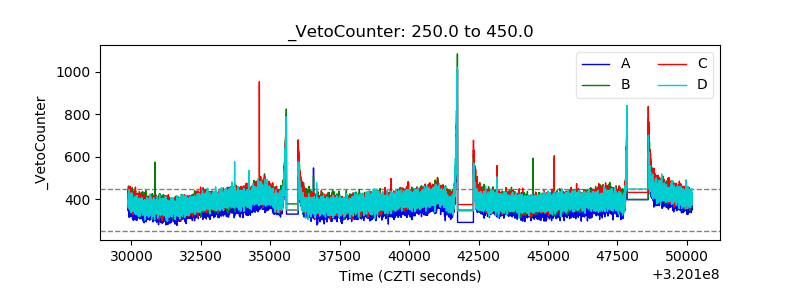 |